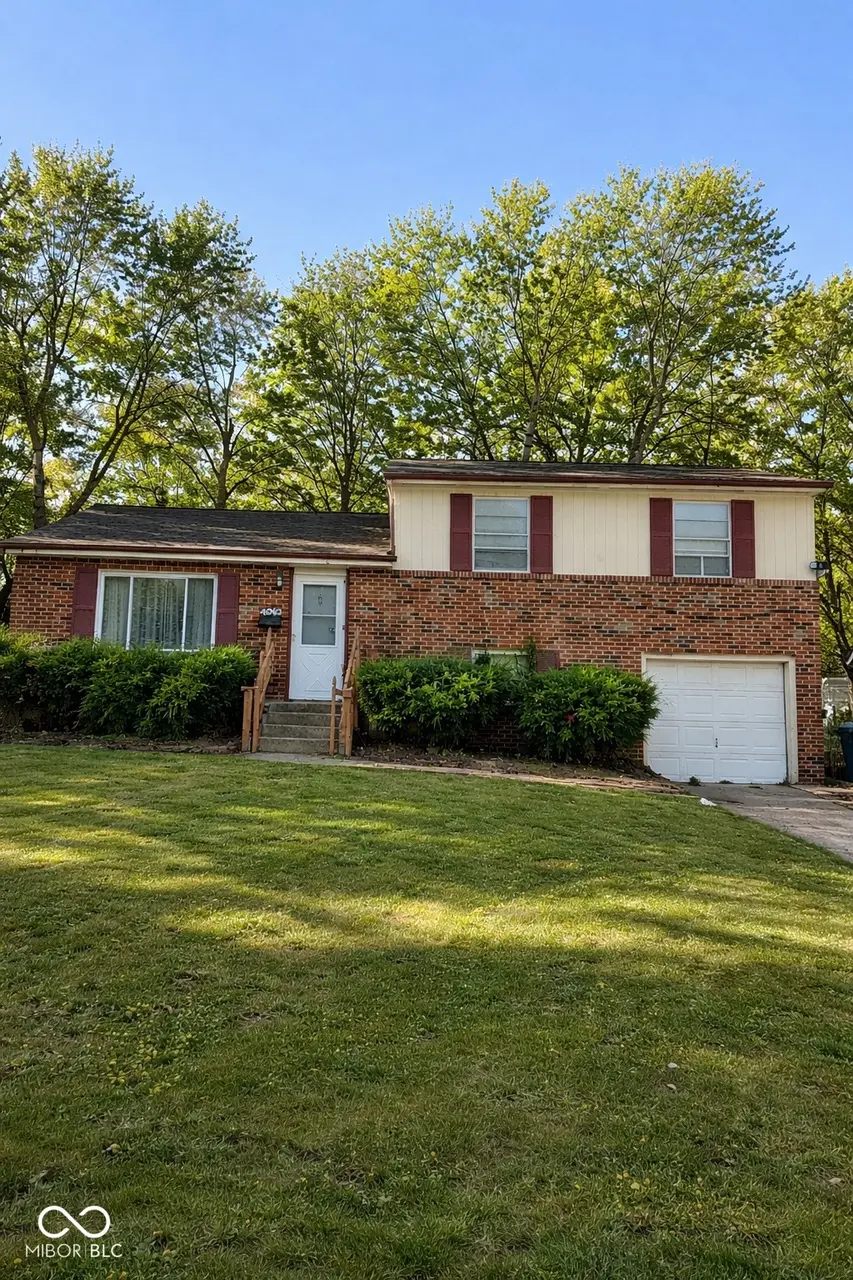
4062 N Webster Ave · Indianapolis city (balance), IN
Flood risk 6/10 · Moderate
- FEMA flood zone
- X (unshaded)
- Chance of flooding over 30 yrs
- 0.71%
- Est. flood insurance / yr
- $507 – $1,088
Fire risk 1/10 · Minimal
- Est. fire insurance / yr
- $717 – $1,331
Heat risk 3/10 · Minor
- Hot days now (above 101°F)
- 7 days/yr
- Hot days in 30 yrs
- 18 days/yr
Wind risk 2/10 · Minimal
- Chance of severe wind over 30 yrs
- 1.0%
Air-quality risk 4/10 · Minor
- Unhealthy air days now
- 5 days/yr
- Unhealthy air days in 30 yrs
- 7 days/yr
Risk factors via First Street. Map © Google.
Why this score? — see what drove the C+ grade
The composite is a weighted blend of 9 inputs, each scored 0–100. Each bar is that input's sub-score; the figure is the points it added to the 100-point composite (weight × sub-score).
- Cash flow +21.9/30.0
- ARV discount +15.0/15.0
- DSCR +7.0/10.0
- 1% rule +5.6/10.0
- Rent growth +4.2/5.0
- Livability +2.5/5.0
- Condition / age +2.5/5.0
- Schools +1.4/10.0
- Appreciation +0.0/10.0
$140,000
🖨 Deal sheet 📄 Offer letter ✓ Due diligence
Listing remarks MLS
Investor Special with Incredible Potential! Located in Sheridan Heights, this 3-bedroom home offers approximately 2,280 square feet of living space and is ready for your vision. With great bones, unique architectural features, and a spacious layout, this property presents an excellent opportunity for investors, flippers, or buyers looking to build equity through renovation. The home features a large living area with dramatic vaulted ceilings and exposed beams, creating a standout architectural focal point rarely found at this price point. The floor plan offers multiple living spaces, generously sized bedrooms, and a lower-level area that could easily be transformed into additional living or entertainment space. Outside, the property sits on a mature lot with an attached garage and plenty of yard space. With comparable renovated homes in the area selling for significantly more, this property offers strong upside potential for the right buyer. Bring your contractor and imagination - this is a prime value-add opportunity on Indianapolis' northeast side.
Key facts
- Plenty of yard space
- Mature lot
- Exposed beams
Tags
Neighborhood map
What this means for you Summary
Snapshot
- This is a 3-bed/1.5-bath single-family listed at $140k.
Deal economics
- At list price, monthly cash flow is $221 ($3k/yr) — positive.
- The deal already cash-flows at list — no discount required.
- Meets the 1% rule at list price ($1k rent vs $140k).
- Recommended offer: $138k (1.5% below list) — sets the bar for market timing.
- Cap rate 8.2% vs local median 4.4% in Indianapolis city (balance) — top-decile yield for the area; either an underpriced asset or a hidden risk that comps aren't pricing in. Stress-test before assuming the spread holds.
Location & tenants
- Location reads: area grade C — affects rentability + tenant quality, not the cash-flow math above.
- Indianapolis Public Schools (urban): math 14% / reading 20% proficiency, ranked #286 of 301 in IN (top 95%) — low school quality limits family demand, transient renter base, plan for 1-2y turnover; 77% free/reduced lunch — lower-income household profile, screen leases tightly.
- Market conditions: Rents rising fast (+6.8%/yr); 151 active listings in the ZIP; 13 comparable units currently listed for rent nearby; rentals at typical pace (median 22d on market — plan ~3-4 weeks tenant-placement turnaround); 1,906 units permitted in Marion County in 2024 (621 in 5+ unit buildings).
- This rent runs 35% of the median local income ($50k/yr) — at the standard rent-burdened threshold; future hikes will face affordability resistance.
Forward outlook
- Local home prices are declining (-3.0%/yr); year-one equity from $968 of loan paydown is wiped out by about $4k of value loss. Plan a longer hold.
- Marion County population projected at +18% by 2050 — long-run rental-demand tailwind backs the buy-and-hold thesis.
- At projected returns (-3.0% appreciation + 6.8% rent growth), your $39k cash investment doubles in ~9 years — after that, you're playing with house money.
Negotiation context
- It's been on market 16 days — a 2% lower offer ($138k) is reasonable based on typical stale-listing flexibility.
- 3 sale attempts since 17y ago; this cycle's ask has dropped $10k (7%) from the opening price — seller is motivated, your offer sets the floor, not the list.
- Current owner paid $19k; list at $140k implies a 637% gain — meaningful room to come down on a strong offer.
Risks & watch-outs
- Watch-outs: built in 1957 — expect roof / HVAC / electrical / plumbing capex.
- Climate carrying-cost: major flood risk — expect insurance premiums to compound above CPI over the hold.
Questions for the listing agent
- Built in 1957 — when were the roof, HVAC, electrical panel, plumbing, and water heater last replaced?
- Is there a deadline driving the sale (1031 exchange, divorce, estate, relocation)? That informs how much negotiation room exists.
- What's the average days-on-market for RENTAL listings here right now (not sales)? A rising rental-DOM trend means longer vacancies and softer asking-rent achievability than the comps imply.
- What's the recent tenant-quality profile in this submarket — average credit score on applications, eviction rate, late-payment / NSF rate, and stable-employment percentage? A property-management company in the area should have these aggregated.
- How much new for-sale + rental construction is in the pipeline within 1–3 miles? Heavy new supply typically softens prices + rents 12–24 months out; constrained supply supports both.
Investment metrics
- 1% rule
- 1.06% ✓
- Cap rate
- 8.18%
- Cash-on-cash
- 6.75%
- DSCR
- 1.30
- GRM
- 7.8
CMA / ARV
- ARV (median comp)
- $188,177
- List price
- $140,000
- Delta
- -25.60%
- Verdict
- UNDERPRICED
- Comps
- 20 within 1.0 mi
Show comp detail 12 sales within ~0.75 mi
| Address | Dist | Beds/Ba | Sqft | Sold | Price | $/sf | Match |
|---|---|---|---|---|---|---|---|
| 4023 N Arlington Ave | 0.07mi | 4/1.5 (+1) | 1,532 (-9%) | 11mo | $222,000 | $145 | 68 |
| 6134 Marilyn Rd | 0.16mi | 4/2.0 (+1) | 1,514 (-10%) | 2mo | $173,000 | $114 | 68 |
| 6149 Woodfox Ct | 0.37mi | 3/2.0 | 1,560 (-7%) | 3mo | $174,900 | $112 | 66 |
| 4128 N Webster Ave | 0.08mi | 4/2.0 (+1) | 1,924 (+14%) | 2mo | $195,000 | $101 | 64 |
| 5426 Culver St | 0.62mi | 3/1.0 | 1,728 (+3%) | 2mo | $179,000 | $104 | 63 |
| 4463 Campbell Ave | 0.54mi | 3/1.5 | 1,594 (-5%) | 4mo | $76,000 | $48 | 63 |
| 4428 N Bolton Ave | 0.50mi | 3/1.5 | 1,540 (-8%) | 0mo | $219,900 | $143 | 63 |
| 6160 E 43rd St | 0.31mi | 3/1.5 | 1,440 (-14%) | 5mo | $179,000 | $124 | 58 |
| 6117 Marilyn Rd | 0.12mi | 4/2.0 (+1) | 1,924 (+14%) | 7mo | $173,000 | $90 | 58 |
| 6402 E Meadowlark Dr | 0.47mi | 4/2.0 (+1) | 1,580 (-6%) | 5mo | $175,000 | $111 | 57 |
| 4013 N Graham Ave | 0.29mi | 3/2.5 | 1,913 (+14%) | 9mo | $200,000 | $105 | 52 |
| 6143 E 43rd St | 0.27mi | 4/2.0 (+1) | 1,443 (-14%) | 10mo | $214,500 | $149 | 49 |
Match score weights: distance 35% · size 25% · config 20% · recency 20%. Top-matched comps best support the ARV.
Projected returns pro-forma
-3.0% appreciation · 6.76% rent growth · sell at horizon
- IRR
- -1.8%
- Equity multiple
- 0.93×
- Total profit
- $-2,791
- Equity at exit
- $20,874
- IRR
- 11.5%
- Equity multiple
- 2.06×
- Total profit
- $41,586
- Equity at exit
- $12,105
Cash invested: $39,200 (down + closing). Projections, not guarantees.
Landlord ↔ Tenant lean methodology
- Overall (STATE)
- 90 Strongly Landlord-Friendly
- State Indiana
- 90 Strongly Landlord-Friendly · R+11
- County
- — inherits STATE
- City
- — inherits STATE
ZIP-level market 46226
- Rents YoY
- 6.8%
- Active inventory
- 151
- Price-to-rent
- 7.8×
Monthly cashflow live
- Estimated rent
- $1,486 high interval (Pro) →
- Mortgage (P&I)
- −$734
- Tax from tax record
- −$161 /mo · $1,933/yr
- Insurance
- −$58
- HOA
- −$0
- Vacancy / Maint / Mgmt
- −$312
- Net cashflow
- $221
Break-even live
UW: 25.0% down · 7.5% · 30yr · 1.5% tax · 5.0% vac · 8.0% maint · 8.0% mgmt
Financing live
Cash to close
- Down payment
- $35,000
- Closing costs
- $4,200
- Reserves months
- —
- Total cash needed
- —
Loan-product check · same deal, 3 products live
Conventional
25% down · 7.5% · 30yr
- Down + closing
- —
- Monthly P&I
- —
- Monthly cashflow
- —
- DSCR
- —
- Eligible?
- —
Personal DTI + credit; lowest rate.
DSCR
20% down · 8.5% · 30yr
- Down + closing
- —
- Monthly P&I
- —
- Monthly cashflow
- —
- DSCR
- —
- Eligible?
- —
No personal income docs; deal must DSCR.
Hard money
10% down · 12.0% · 12mo
- Down + closing
- —
- Monthly P&I
- —
- Monthly cashflow
- —
- DSCR
- —
- Eligible?
- —
Short-term bridge; refi at stabilization.
Rent comps 13 comps
| Address | Beds | Baths | Sqft | Rent | $/sqft | DOM | Units | Dist |
|---|---|---|---|---|---|---|---|---|
| 3912 N Webster Ave Indianapolis, IN | 4.0 | 1.0 | 1274 | $1,350 | $1.06 | 21d | 1 | 0.18mi |
| 4176 N Irwin Ave Indianapolis, IN | 4.0 | 2.0 | 2006 | $1,595 | $0.80 | 21d | 1 | 0.57mi |
| 4555 N Arlington Ave Indianapolis, IN | 1.0–3.0 | 1.0–1.5 | 880 | $1,379 | $1.57 | 3d | 30 | 0.62mi |
| 5865 E 46th St Indianapolis, IN | 3.0 | 2.0 | 1400 | $1,500 | $1.07 | 43d | 1 | 0.66mi |
| 4511 N Kenmore Rd Indianapolis, IN | 4.0 | 2.0 | 1200 | $2,095 | $1.75 | 4d | 1 | 0.70mi |
| 6563 E 46th St Indianapolis, IN | 3.0 | 1.5 | 1185 | $1,250 | $1.05 | 4d | 1 | 0.77mi |
| 3900 N Shadeland Ave Indianapolis, IN | 1.0–2.0 | 1.0 | 1070 | $1,075 | $1.00 | 3d | 6 | 0.91mi |
| 4839 N Kenmore Rd Indianapolis, IN | 3.0 | 2.0 | 1215 | $1,533 | $1.26 | 21d | 1 | 0.94mi |
| 3775 Allerton Pl Indianapolis, IN | 1.0–4.0 | 2.0 | 1068 | $1,617 | $1.51 | 13d | 1 | 1.22mi |
| 3319 N Hawthorne Ln Indianapolis, IN | 3.0 | 1.0 | 1084 | $1,100 | $1.01 | 23d | 1 | 1.26mi |
| 3707 N Riley Ave Indianapolis, IN | 3.0 | 1.5 | 2016 | $1,500 | $0.74 | 23d | 1 | 1.27mi |
| 3070 N Layman Ave #1 Indianapolis, IN | 3.0 | 2.0 | 1480 | $1,700 | $1.15 | 43d | 1 | 1.35mi |
| 5116 Wexford Rd Indianapolis, IN | 4.0 | 2.0 | 1938 | $2,045 | $1.06 | 4d | 1 | 1.38mi |
Listing history 8 events
-
2026-05-02status Pending 1081-char remark
Show marketing remark (1081 chars)
Investor Special with Incredible Potential! Located in Sheridan Heights, this 3-bedroom home offers approximately 2,280 square feet of living space and is ready for your vision. With great bones, unique architectural features, and a spacious layout, this property presents an excellent opportunity for investors, flippers, or buyers looking to build equity through renovation. The home features a large living area with dramatic vaulted ceilings and exposed beams, creating a standout architectural focal point rarely found at this price point. The floor plan offers multiple living spaces, generously sized bedrooms, and a lower-level area that could easily be transformed into additional living or entertainment space. Outside, the property sits on a mature lot with an attached garage and plenty of yard space. With comparable renovated homes in the area selling for significantly more, this property offers strong upside potential for the right buyer. Bring your contractor and imagination - this is a prime value-add opportunity on Indianapolis' northeast side.
-
2026-04-28price $140,000 1081-char remark
Show marketing remark (1081 chars)
Investor Special with Incredible Potential! Located in Sheridan Heights, this 3-bedroom home offers approximately 2,280 square feet of living space and is ready for your vision. With great bones, unique architectural features, and a spacious layout, this property presents an excellent opportunity for investors, flippers, or buyers looking to build equity through renovation. The home features a large living area with dramatic vaulted ceilings and exposed beams, creating a standout architectural focal point rarely found at this price point. The floor plan offers multiple living spaces, generously sized bedrooms, and a lower-level area that could easily be transformed into additional living or entertainment space. Outside, the property sits on a mature lot with an attached garage and plenty of yard space. With comparable renovated homes in the area selling for significantly more, this property offers strong upside potential for the right buyer. Bring your contractor and imagination - this is a prime value-add opportunity on Indianapolis' northeast side.
-
2026-04-16$150,000 Active 1081-char remark
Show marketing remark (1081 chars)
Investor Special with Incredible Potential! Located in Sheridan Heights, this 3-bedroom home offers approximately 2,280 square feet of living space and is ready for your vision. With great bones, unique architectural features, and a spacious layout, this property presents an excellent opportunity for investors, flippers, or buyers looking to build equity through renovation. The home features a large living area with dramatic vaulted ceilings and exposed beams, creating a standout architectural focal point rarely found at this price point. The floor plan offers multiple living spaces, generously sized bedrooms, and a lower-level area that could easily be transformed into additional living or entertainment space. Outside, the property sits on a mature lot with an attached garage and plenty of yard space. With comparable renovated homes in the area selling for significantly more, this property offers strong upside potential for the right buyer. Bring your contractor and imagination - this is a prime value-add opportunity on Indianapolis' northeast side.
-
2010-05-28historical 54-char remark
Show marketing remark (54 chars)
Large 3BR tri-level, blt in garage, lots of potential!
-
2010-05-28soldstatus $19,000 54-char remark
Show marketing remark (54 chars)
Large 3BR tri-level, blt in garage, lots of potential!
-
2010-04-13$19,900 54-char remark
Show marketing remark (54 chars)
Large 3BR tri-level, blt in garage, lots of potential!
-
2009-09-12historical
-
2009-04-24$25,000
ⓘ Source: listings_history table (triggers on properties + properties_extension) + one-shot
backfill from property_details.listing_events for pre-trigger history.
Tax reassessment forecast IN · Partial reset (capped growth)
- Current annual tax
- $1,933 · $161/mo
- Projected year-2 tax
- $1,933 · $161/mo
- Expected delta
- $0/yr ($0/mo · 0.0%)
ⓘ Screening estimate from a state-policy table — verify with the county assessor before closing.
Climate risk First Street
- Flood 6/10 Major FEMA zone X (unshaded) · 71% chance over 30 yrs
- Wildfire 1/10 Low
- Heat 3/10 Moderate 7 d/yr ≥101°F today · 18 d/yr by 30 yrs out
- Wind 2/10 Low 100% chance of damaging wind over 30 yrs
- Air quality 4/10 Moderate 5 unhealthy d/yr today · 7 by 30 yrs out
Nearby sold comps map
Loading sold comps map…
Walkable amenities ~0.75 mi
Loading nearby amenities…
Taxation est. · year 1
- Rental income
- $17,835
- − Mortgage interest
- −$7,842
- − Property taxes
- −$1,933
- − Insurance
- −$700
- − Repairs & maintenance
- −$1,427
- − Management
- −$1,427
- − Depreciation
- −$4,073
- Taxable income
- $433
- Est. tax owed @ 24.0%
- −$104
- After-tax cash flow
- $2,542/yr
For passive investors: Depreciation is non-cash, so a rental often shows a tax loss while cash-flowing — sheltering income. Rental losses are passive: they offset passive income freely, and up to $25,000/yr can offset ordinary (W-2) income if you actively participate and your MAGI is under $100k (phasing out to $0 by $150k); unused losses carry forward. On sale, claimed depreciation is recaptured at up to 25%, and gains may owe capital-gains tax (a 1031 exchange can defer both). Figures are a year-1 estimate at your 24.0% rate — not tax advice; consult a CPA.
Schools (NCES district)
- District
- Indianapolis Public Schools
- NCES district ID
- 1804770
- Math proficiency
- 14% ▼ -7.00%
- Reading proficiency
- 20% ▼ -3.00%
- Median HH income
- $32,034
- Composite
- 13.69/100
- National rank
- #9499
- State rank
- #286 of 301 in IN
Livability — Indianapolis city (balance)
No livability data for this city. (Only ~50 U.S. cities are tracked.)
Census & demographics
- Census place
- Indianapolis city (balance), IN
- County
- Marion County · 998,460 people
- City population
- 881,119
- Metro
- Indianapolis-Carmel-Anderson, IN
- Population (ZIP)
- 47,099
- Household income
- $50,325
- Rent vs Own
- Severe rent burden
- 2742.0
Population outlook (Marion County) Hauer SSP2
- Today (2025)
- 1,025,572 people
- By 2030
- 1,065,727 · +3.9%
- By 2040
- 1,141,577 · +11.3%
- By 2050
- 1,208,920 · +17.9%
- By 2075
- 1,367,288 · +33.3%
- By 2100
- 1,438,201 · +40.2%
Race, ethnicity, and origin ACS 2023
- Neighborhood character
- Diverse neighborhood (Simpson 0.62)
- Race & ethnicity
- Black 53% White 25% Hispanic / Latino 17% Two or more races 9% Asian 2%
- Hispanic origin (detail)
- Mexican 11%
- Common ancestry
- Lithuanian 1% Italian 1% Romanian 1%
- Foreign-born
- 11% · Canada
- Languages at home
- 86% English-only · Spanish 10% French/Haitian/Cajun 1% Other Asian/Pacific 1%
Political lean MEDSL · Marion
- 2024 margin
- Strong D (+27.7) · D 63.0% · R 35.3% · Other 1.7%
- 2008→2024 swing
- -0.7pp no change · 2008: 28.4pp · 2024: 27.7pp
- All cycles
- 2024: D+27.7 2020: D+29.1 2016: D+22.8 2012: D+22.2 2008: D+28.4
Not yet ingested
- Civics
- —
Market trends
- HPI YoY
- ▼ -218.85%
- Current HPI
- 239.43
- Rent YoY
- ▲ 6.76%
- Metro
- Indianapolis-Carmel-Anderson, IN
- State GDP YoY
- ▲ 2.90%
- F500 in state
- 18
Industry mix (Fortune 500 HQ in IN)
| Industry | F500 HQs | Revenue |
|---|---|---|
| Industrial Machinery | 2 | $37B |
|
||
| Healthcare | 1 | $177B |
|
||
| Pharmaceuticals | 1 | $45B |
|
||
| Metals / Steel | 1 | $18B |
|
||
| Agriculture | 1 | $17B |
|
||
| Packaging | 1 | $12B |
|
||
Price history
+460.0% since first listed8 events — show timeline
- 2026-05-02 Pending — MIBOR as Distributed by MLS Grid
- 2026-04-28 Price Changed $140,000 MIBOR as Distributed by MLS Grid
- 2026-04-16 Listed $150,000 MIBOR as Distributed by MLS Grid
- 2010-05-28 Listing Removed — MIBOR as Distributed by MLS Grid
- 2010-05-28 Sold (MLS) $19,000 MIBOR as Distributed by MLS Grid
- 2010-04-13 Listed $19,900 MIBOR as Distributed by MLS Grid
- 2009-09-12 Listing Removed — MIBOR as Distributed by MLS Grid
- 2009-04-24 Listed $25,000 MIBOR as Distributed by MLS Grid
Property tax history
+10.9%/yrLatest (2025): $1,933 · -3.0% YoY. Source: county tax records.
Cash-flow waterfall
monthlySold comps — $/sqft
last 12 mo · ≤1 miLoading sold comps…