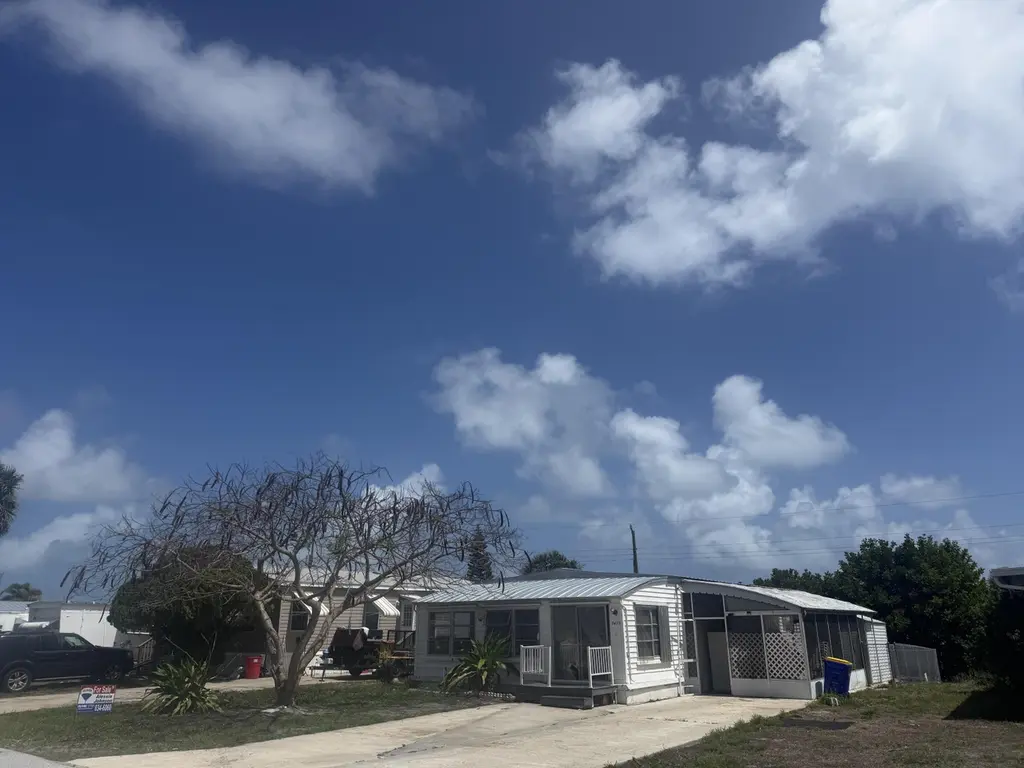
8479 SE Eagle Ave · Hobe Sound, FL
Flood risk 1/10 · Minimal
- FEMA flood zone
- X (unshaded)
- Chance of flooding over 30 yrs
- 0.0%
- Est. flood insurance / yr
- $507 – $1,088
Fire risk 3/10 · Minor
- Est. fire insurance / yr
- $947 – $1,759
Heat risk 10/10 · Severe
- Hot days now (above 106°F)
- 7 days/yr
- Hot days in 30 yrs
- 25 days/yr
Wind risk 10/10 · Severe
- Chance of severe wind over 30 yrs
- 99.0%
Air-quality risk 2/10 · Minimal
- Unhealthy air days now
- 1 days/yr
- Unhealthy air days in 30 yrs
- 1 days/yr
Risk factors via First Street. Map © Google.
Why this score? — see what drove the B+ grade
The composite is a weighted blend of 9 inputs, each scored 0–100. Each bar is that input's sub-score; the figure is the points it added to the 100-point composite (weight × sub-score).
- Cash flow +30.0/30.0
- ARV discount +15.0/15.0
- 1% rule +10.0/10.0
- DSCR +10.0/10.0
- Schools +4.5/10.0
- Livability +3.5/5.0
- Rent growth +3.0/5.0
- Condition / age +2.5/5.0
- Appreciation +0.0/10.0
$129,000
🖨 Deal sheet 📄 Offer letter ✓ Due diligence
Listing remarks MLS
LAND OWNED NO HOA! Handyperson Wanted! Needs total Re-Hab or remove and put a new Manufacture Home on the lot! 2BED/2BATHS 960 SQ FT! Front and Side Porches! Metal Roof, Hot Water Heater and Electric panel they were updated from prior owner! Lot Size 50x100 City Water and Septic. Bring your Truck, Boat/Rv, all Ages, Pets!!! Sold As-is Cash Only! If you like to join there is a Clubhouse and Heated Pool for $365 Year! 2 Mile to Hobe Sound Beach and Downtown Hobe Sound and Shopping! EZ To Show!
Key facts
- Metal roof
- Hot water heater
- Land owned
Tags
Neighborhood map
What this means for you Summary
Snapshot
- This is a 2-bed/2.0-bath manufactured listed at $129k.
Deal economics
- At list price, monthly cash flow is $714 ($9k/yr) — positive.
- The deal already cash-flows at list — no discount required.
- Meets the 1% rule at list price ($2k rent vs $129k).
- Recommended offer: $125k (3.0% below list) — sets the bar for market timing.
- Cap rate 12.9% vs local median 3.5% in Hobe Sound — top-decile yield for the area; either an underpriced asset or a hidden risk that comps aren't pricing in. Stress-test before assuming the spread holds.
Location & tenants
- Location reads 69/100 on livability (#497 in FL) — a middle-class / working-renter tenant base. Strengths: housing A+, crime A, cost of living A; Watch: employment C-, amenities F, commute F.
- Martin (suburban): math 52% / reading 53% proficiency, ranked #24 of 73 in FL (top 33%) — acceptable for families but not a draw, mixed tenant base, ~2y average lease.
- Market conditions: Rents rising (+1.8%/yr); 279 active listings in the ZIP; 12 comparable units currently listed for rent nearby; rentals at typical pace (median 24d on market — plan ~3-4 weeks tenant-placement turnaround); 737 units permitted in Martin County in 2024 (167 in 5+ unit buildings).
- This rent runs 35% of the median local income ($70k/yr) — at the standard rent-burdened threshold; future hikes will face affordability resistance.
Forward outlook
- Local home prices are declining (-3.0%/yr); year-one equity from $892 of loan paydown is wiped out by about $4k of value loss. Plan a longer hold.
- Martin County population projected at +19% by 2050 — long-run rental-demand tailwind backs the buy-and-hold thesis.
- At projected returns (-3.0% appreciation + 1.8% rent growth), your $36k cash investment doubles in ~6 years — after that, you're playing with house money.
Negotiation context
- It's been on market 57 days — a 3% lower offer ($125k) is reasonable based on typical stale-listing flexibility.
- 2 sale attempts since 17y ago with the ask held roughly flat each time — persistent listings suggest the price (not the market) is what's stuck; bring a comps-based counter.
- Current owner paid $35k; list at $129k implies a 269% gain — meaningful room to come down on a strong offer.
Risks & watch-outs
- Climate carrying-cost: severe wind risk, 99% chance of damaging wind over 30y; extreme-heat days projected 7→25/yr by 2055 (HVAC capex compounding) — expect insurance premiums to compound above CPI over the hold.
Questions for the listing agent
- It's been on market 57 days. Have you received any prior offers? Is the seller open to a 3% concession, seller financing, or rate buy-down credit?
- Built in 1971 — when were the roof, HVAC, electrical panel, plumbing, and water heater last replaced?
- Is there a deadline driving the sale (1031 exchange, divorce, estate, relocation)? That informs how much negotiation room exists.
- What's the average days-on-market for RENTAL listings here right now (not sales)? A rising rental-DOM trend means longer vacancies and softer asking-rent achievability than the comps imply.
- What's the recent tenant-quality profile in this submarket — average credit score on applications, eviction rate, late-payment / NSF rate, and stable-employment percentage? A property-management company in the area should have these aggregated.
- How much new for-sale + rental construction is in the pipeline within 1–3 miles? Heavy new supply typically softens prices + rents 12–24 months out; constrained supply supports both.
Investment metrics
- 1% rule
- 1.59% ✓
- Cap rate
- 12.93%
- Cash-on-cash
- 23.71%
- DSCR
- 2.06
- GRM
- 5.2
CMA / ARV
- ARV (median comp)
- $170,833
- List price
- $129,000
- Delta
- -24.49%
- Verdict
- UNDERPRICED
- Comps
- 20 within 1.0 mi
Show comp detail 12 sales within ~0.75 mi
| Address | Dist | Beds/Ba | Sqft | Sold | Price | $/sf | Match |
|---|---|---|---|---|---|---|---|
| 8500 SE Eagle Ave | 0.03mi | 2/2.0 | 960 (0%) | 4mo | $135,000 | $141 | 95 |
| 8217 SE Swan Ave | 0.26mi | 2/2.0 | 960 (0%) | 2mo | $196,000 | $204 | 86 |
| 6900 SE Congress St | 0.41mi | 2/2.0 | 960 (0%) | 3mo | $138,000 | $144 | 78 |
| 8301 SE Skylark Ave | 0.15mi | 2/1.0 | 1,020 (+6%) | 1mo | $213,000 | $209 | 78 |
| 7184 SE Redbird Cir | 0.14mi | 2/2.0 | 1,080 (+12%) | 2mo | $190,000 | $176 | 71 |
| 8001 SE Shenandoah Dr | 0.56mi | 2/2.0 | 960 (0%) | 7mo | $180,000 | $188 | 68 |
| 7058 SE Delegate St | 0.36mi | 2/2.0 | 1,008 (+5%) | 11mo | $175,000 | $174 | 66 |
| 7878 SE Swan Ave | 0.58mi | 2/2.0 | 999 (+4%) | 2mo | $154,000 | $154 | 65 |
| 7123 SE Redbird Cir | 0.19mi | 2/2.0 | 1,056 (+10%) | 11mo | $170,000 | $161 | 65 |
| 7142 SE Bluebird Cir | 0.33mi | 2/2.0 | 840 (-12%) | 11mo | $120,000 | $143 | 55 |
| 7749 SE Eagle Ave | 0.66mi | 2/2.0 | 896 (-7%) | 7mo | $210,000 | $234 | 52 |
| 7690 SE Eagle Ave | 0.71mi | 3/1.0 (+1) | 1,056 (+10%) | 8mo | $150,000 | $142 | 34 |
Match score weights: distance 35% · size 25% · config 20% · recency 20%. Top-matched comps best support the ARV.
Projected returns pro-forma
-3.0% appreciation · 1.8% rent growth · sell at horizon
- IRR
- 15.5%
- Equity multiple
- 1.61×
- Total profit
- $22,145
- Equity at exit
- $19,234
- IRR
- 23.3%
- Equity multiple
- 2.89×
- Total profit
- $68,169
- Equity at exit
- $11,154
Cash invested: $36,120 (down + closing). Projections, not guarantees.
Landlord ↔ Tenant lean methodology
- Overall (STATE)
- 87 Strongly Landlord-Friendly
- State Florida
- 87 Strongly Landlord-Friendly · R+3
- County
- — inherits STATE
- City
- — inherits STATE
ZIP-level market 33455
- Rents YoY
- 1.8%
- Active inventory
- 279
- Price-to-rent
- 5.2×
Monthly cashflow live
- Estimated rent
- $2,055 high interval (Pro) →
- Mortgage (P&I)
- −$676
- Tax from tax record
- −$179 /mo · $2,152/yr
- Insurance
- −$54
- HOA
- −$0
- Vacancy / Maint / Mgmt
- −$432
- Net cashflow
- $714
Break-even live
UW: 25.0% down · 7.5% · 30yr · 1.5% tax · 5.0% vac · 8.0% maint · 8.0% mgmt
Financing live
Cash to close
- Down payment
- $32,250
- Closing costs
- $3,870
- Reserves months
- —
- Total cash needed
- —
Loan-product check · same deal, 3 products live
Conventional
25% down · 7.5% · 30yr
- Down + closing
- —
- Monthly P&I
- —
- Monthly cashflow
- —
- DSCR
- —
- Eligible?
- —
Personal DTI + credit; lowest rate.
DSCR
20% down · 8.5% · 30yr
- Down + closing
- —
- Monthly P&I
- —
- Monthly cashflow
- —
- DSCR
- —
- Eligible?
- —
No personal income docs; deal must DSCR.
Hard money
10% down · 12.0% · 12mo
- Down + closing
- —
- Monthly P&I
- —
- Monthly cashflow
- —
- DSCR
- —
- Eligible?
- —
Short-term bridge; refi at stabilization.
Rent comps 12 comps
| Address | Beds | Baths | Sqft | Rent | $/sqft | DOM | Units | Dist |
|---|---|---|---|---|---|---|---|---|
| 7109 SE Ridgeway Ter Hobe Sound, FL | 2.0 | 1.0 | 624 | $1,600 | $2.56 | 21d | 1 | 0.19mi |
| 8160 SE Eagle Ave Hobe Sound, FL | 2.0 | 1.0 | 672 | $1,600 | $2.38 | 23d | 1 | 0.29mi |
| 6948 SE Delegate St Hobe Sound, FL | 2.0 | 2.0 | 840 | $1,775 | $2.11 | 23d | 1 | 0.39mi |
| 8002 SE Skylark Ave Hobe Sound, FL | 3.0 | 2.0 | 990 | $2,000 | $2.02 | 23d | 1 | 0.40mi |
| 8905 SE Sandy Ln Hobe Sound, FL | 2.0 | 2.0 | 1006 | $1,850 | $1.84 | 23d | 1 | 0.40mi |
| 8997 SE Sandy Ln Hobe Sound, FL | 2.0 | 1.0 | 900 | $2,000 | $2.22 | 23d | 1 | 0.47mi |
| 9073 SE Hobe Ridge Ave Hobe Sound, FL | 2.0 | 2.0 | 1029 | $2,100 | $2.04 | 14d | 1 | 0.55mi |
| 7959 SE Woodview Ter Hobe Sound, FL | 1.0 | 1.0 | 700 | $1,675 | $2.39 | 23d | 4 | 0.84mi |
| 7568 SE Swan Ave Hobe Sound, FL | 2.0 | 2.0 | 1052 | $2,300 | $2.19 | 23d | 1 | 0.84mi |
| 7920 SE Woodview Ter Unit 792007 Hobe Sound, FL | 1.0 | 1.0 | 700 | $1,675 | $2.39 | 23d | 1 | 0.86mi |
| 8005 SE Villa Cir Hobe Sound, FL | 2.0 | 2.0 | 1026 | $1,850 | $1.80 | 23d | 1 | 1.22mi |
| 8042 SE Villa Cir Unit 8042 Hobe Sound, FL | 2.0 | 2.0 | 1026 | $1,950 | $1.90 | 23d | 1 | 1.26mi |
Listing history 4 events
-
2026-03-31$129,000 Active 497-char remark
Show marketing remark (497 chars)
LAND OWNED NO HOA! Handyperson Wanted! Needs total Re-Hab or remove and put a new Manufacture Home on the lot! 2BED/2BATHS 960 SQ FT! Front and Side Porches! Metal Roof, Hot Water Heater and Electric panel they were updated from prior owner! Lot Size 50x100 City Water and Septic. Bring your Truck, Boat/Rv, all Ages, Pets!!! Sold As-is Cash Only! If you like to join there is a Clubhouse and Heated Pool for $365 Year! 2 Mile to Hobe Sound Beach and Downtown Hobe Sound and Shopping! EZ To Show!
-
2009-09-11soldstatus $35,000 108-char remark
Show marketing remark (108 chars)
VACANT DOUBLE WIDE NEEDS TLC, LOOK AT ALL OFFERS CLUBHOUSE- LOW YEARLY FEE- SHUFFLEBOARD-POOL-55+ SOLD-AS-IS
-
2009-07-13$49,500 108-char remark
Show marketing remark (108 chars)
VACANT DOUBLE WIDE NEEDS TLC, LOOK AT ALL OFFERS CLUBHOUSE- LOW YEARLY FEE- SHUFFLEBOARD-POOL-55+ SOLD-AS-IS
-
1996-04-12soldstatus $35,000
ⓘ Source: listings_history table (triggers on properties + properties_extension) + one-shot
backfill from property_details.listing_events for pre-trigger history.
Tax reassessment forecast FL · Resets to sale price
- Current annual tax
- $2,152 · $179/mo
- Projected year-2 tax
- $2,152 · $179/mo
- Expected delta
- $0/yr ($0/mo · 0.0%)
ⓘ Screening estimate from a state-policy table — verify with the county assessor before closing.
Climate risk First Street
- Flood 1/10 Low FEMA zone X (unshaded) · 0% chance over 30 yrs
- Wildfire 3/10 Moderate
- Heat 10/10 Extreme 7 d/yr ≥106°F today · 25 d/yr by 30 yrs out
- Wind 10/10 Extreme 99% chance of damaging wind over 30 yrs
- Air quality 2/10 Low 1 unhealthy d/yr today · 1 by 30 yrs out
Nearby sold comps map
Loading sold comps map…
Walkable amenities ~0.75 mi
Loading nearby amenities…
Taxation est. · year 1
- Rental income
- $24,657
- − Mortgage interest
- −$7,226
- − Property taxes
- −$2,152
- − Insurance
- −$645
- − Repairs & maintenance
- −$1,973
- − Management
- −$1,973
- − Depreciation
- −$3,753
- Taxable income
- $6,937
- Est. tax owed @ 24.0%
- −$1,665
- After-tax cash flow
- $6,900/yr
For passive investors: Depreciation is non-cash, so a rental often shows a tax loss while cash-flowing — sheltering income. Rental losses are passive: they offset passive income freely, and up to $25,000/yr can offset ordinary (W-2) income if you actively participate and your MAGI is under $100k (phasing out to $0 by $150k); unused losses carry forward. On sale, claimed depreciation is recaptured at up to 25%, and gains may owe capital-gains tax (a 1031 exchange can defer both). Figures are a year-1 estimate at your 24.0% rate — not tax advice; consult a CPA.
Schools (NCES district)
- District
- Martin
- NCES district ID
- 1201290
- Math proficiency
- 52% ▼ -14.00%
- Reading proficiency
- 53% ▼ -4.00%
- Median HH income
- $52,482
- Composite
- 45.1/100
- National rank
- #2690
- State rank
- #24 of 73 in FL
Livability — Hobe Sound
- Score
- 69/100
- State rank
- #497
- US rank
- #8763
Category grades
Schools grade is shown separately in the Schools card above.
Census & demographics
- Census place
- Hobe Sound, FL
- County
- Martin County · 165,223 people
- City population
- 20,018
- Metro
- Port St. Lucie, FL
- Population (ZIP)
- 20,018
- Household income
- $70,389
- Rent vs Own
- Severe rent burden
- 317.0
Population outlook (Martin County) Hauer SSP2
- Today (2025)
- 172,383 people
- By 2030
- 180,192 · +4.5%
- By 2040
- 194,114 · +12.6%
- By 2050
- 204,992 · +18.9%
- By 2075
- 229,641 · +33.2%
- By 2100
- 232,146 · +34.7%
Race, ethnicity, and origin ACS 2023
- Neighborhood character
- Predominantly White (84%)
- Race & ethnicity
- White 84% Hispanic / Latino 8% Two or more races 6% Black 5% Asian 1%
- Hispanic origin (detail)
- Mexican 3% Dominican 1%
- Common ancestry
- Romanian 5% Italian 2% Slovak 2%
- Foreign-born
- 8% · Canada
- Languages at home
- 91% English-only · Spanish 6% Other Indo-European 1%
Political lean MEDSL · Martin
- 2024 margin
- Solid R (+31.1) · D 34.1% · R 65.2%
- 2008→2024 swing
- -17.5pp toward R · 2008: -13.6pp · 2024: -31.1pp
- All cycles
- 2024: R+31.1 2020: R+24.6 2016: R+26.9 2012: R+22.9 2008: R+13.6
Not yet ingested
- Civics
- —
Market trends
- HPI YoY
- ▼ -287.05%
- Current HPI
- 356.7273
- Rent YoY
- ▲ 1.80%
- Metro
- Port St. Lucie, FL
- State GDP YoY
- ▲ 3.28%
- F500 in state
- 36
Industry mix (Fortune 500 HQ in FL)
| Industry | F500 HQs | Revenue |
|---|---|---|
| Industrial Technology | 2 | $29B |
|
||
| Insurance | 2 | $17B |
|
||
| Retail | 1 | $60B |
|
||
| Technology Distribution | 1 | $58B |
|
||
| Homebuilding | 1 | $35B |
|
||
| Technology Manufacturing | 1 | $35B |
|
||
Price history
+268.6% since first listed4 events — show timeline
- 2026-03-31 Listed $129,000 Beaches MLS
- 2009-09-11 Sold (MLS) $35,000 MCRTC
- 2009-07-13 Listed $49,500 MCRTC
- 1996-04-12 Sold (Public Records) $35,000 Public Records
Property tax history
+19.7%/yrLatest (2025): $2,152 · +4.8% YoY. Source: county tax records.
Cash-flow waterfall
monthlySold comps — $/sqft
last 12 mo · ≤1 miLoading sold comps…