 🏷️ Likely Rental
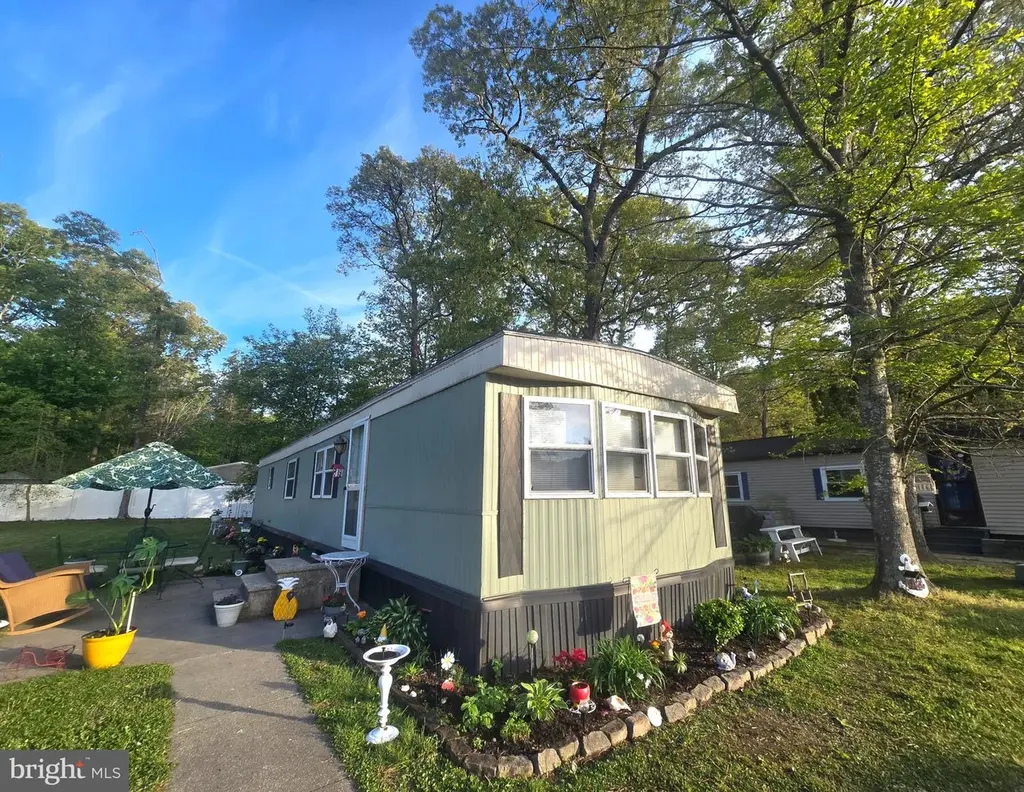
33996 Yoshino Dr · Long Neck, DE
Flood risk 6/10 · Moderate
- FEMA flood zone
- X (unshaded)
- Chance of flooding over 30 yrs
- 0.53%
- Est. flood insurance / yr
- $473 – $860
Fire risk 3/10 · Minor
- Est. fire insurance / yr
- $476 – $884
Heat risk 8/10 · Major
- Hot days now (above 102°F)
- 7 days/yr
- Hot days in 30 yrs
- 17 days/yr
Wind risk 8/10 · Major
- Chance of severe wind over 30 yrs
- 80.0%
Air-quality risk 2/10 · Minimal
- Unhealthy air days now
- 1 days/yr
- Unhealthy air days in 30 yrs
- 1 days/yr
Risk factors via First Street. Map © Google.
Why this score? — see what drove the B grade
The composite is a weighted blend of 9 inputs, each scored 0–100. Each bar is that input's sub-score; the figure is the points it added to the 100-point composite (weight × sub-score).
- Cash flow +30.0/30.0
- 1% rule +10.0/10.0
- DSCR +10.0/10.0
- ARV discount +7.5/15.0
- Schools +4.2/10.0
- Livability +3.5/5.0
- Rent growth +2.7/5.0
- Condition / age +2.5/5.0
- Appreciation +0.0/10.0
$72,500
🖨 Deal sheet 📄 Offer letter ✓ Due diligence
Listing remarks
Presenting move in ready Budd Model 2 beds, 1 bath located less than 8 miles to Lewes Beach, Rehoboth Canal, and less than 2 miles away from a pier dock with kayak launch and boat slips with easy access to Love Creek. This cozy mobile home located in Cherry Creek Valley Subdivision estimated 840 sqft of space with backyard fenced. Land lease is currently $499 per month. Buyers are contingent on park approval owner/ seller is real estate licensee in state of Delaware. Cherry Creek Valley is in the sewer expansion district. Home is not available for rent nor allowed to be rent out per park rules. The mobile home is for sale "As Is. " Buyers will be responsible for the full dmv doc f
Key facts
- 32.72 acre lot
- Built 1986
- Listed 50 days
Property features AI
Finance
- Other: Federal flood zone: AE
- Financial info: Land lease: $499 per month with 99 years remaining; Ownership interest: Land lease; Annual ground rent listed
Exterior
- Parking: Driveway
- Utilities: Public water; Community septic tank; Hot water: Electric; Cooling fuel: Other; Heating fuel: Propane (leased)
- Home design: Manufactured single-wide; Estimated year built; effective remodel year 2025
- Construction: Other structures above and below grade; Pets allowed with no pet restrictions
- Exterior features: Ground rent exists; Tidal water: No
Interior
- Kitchen: Microwave; Range hood; Stove; Refrigerator
- Bedrooms: 2 bedrooms on main level
- Bathrooms: 1 full bathroom on main level
- Heating & cooling: Central air conditioning; Heating: Propane (leased)
- Interior features: No basement; Living area source: Assessor
- Laundry & utility: Washer; Dryer; Electric hot water
Neighborhood map
What this means for you Summary
Snapshot
- This is a 2-bed/1.0-bath manufactured listed at $72k.
Deal economics
- At list price, monthly cash flow is $1k ($14k/yr) — positive.
- The deal already cash-flows at list — no discount required.
- Meets the 1% rule at list price ($2k rent vs $72k).
- Recommended offer: $70k (3.0% below list) — sets the bar for market timing.
- Cap rate 25.5% vs local median 3.2% in Long Neck — top-decile yield for the area; either an underpriced asset or a hidden risk that comps aren't pricing in. Stress-test before assuming the spread holds.
Location & tenants
- Location reads 69/100 on livability (#30 in DE) — a middle-class / working-renter tenant base. Strengths: cost of living A+, housing A+, crime A-; Watch: employment D+, schools F, amenities F.
- Cape Henlopen School District (town): math 42% / reading 55% proficiency, ranked #5 of 26 in DE (top 19%) — families likely to look elsewhere, expect single-tenant / working-renter base with shorter leases.
- Market conditions: Rents flat; 818 active listings in the ZIP; 4 comparable units currently listed for rent nearby; rentals leasing fast (median 14d on market — plan ~1-2 weeks tenant-placement turnaround); solid renter incomes; 4,354 units permitted in Sussex County in 2024 (344 in 5+ unit buildings).
Forward outlook
- Local home prices are declining (-3.0%/yr); year-one equity from $501 of loan paydown is wiped out by about $2k of value loss. Plan a longer hold.
- Sussex County population projected at +25% by 2050 — long-run rental-demand tailwind backs the buy-and-hold thesis.
- At projected returns (-3.0% appreciation + 0.8% rent growth), your $20k cash investment doubles in ~2 years — after that, you're playing with house money.
Negotiation context
- It's been on market 50 days — a 3% lower offer ($70k) is reasonable based on typical stale-listing flexibility.
- 2 sale attempts with the ask held roughly flat each time — persistent listings suggest the price (not the market) is what's stuck; bring a comps-based counter.
Risks & watch-outs
- Climate carrying-cost: major flood risk; severe wind risk, 80% chance of damaging wind over 30y; extreme-heat days projected 7→17/yr by 2055 (HVAC capex compounding) — expect insurance premiums to compound above CPI over the hold.
Questions for the listing agent
- It's been on market 50 days. Have you received any prior offers? Is the seller open to a 3% concession, seller financing, or rate buy-down credit?
- Is there a deadline driving the sale (1031 exchange, divorce, estate, relocation)? That informs how much negotiation room exists.
- Schools are F-rated, which usually means shorter tenancies and higher turnover. Who's the typical renter profile here, and what's been the actual vacancy rate?
- What's the average days-on-market for RENTAL listings here right now (not sales)? A rising rental-DOM trend means longer vacancies and softer asking-rent achievability than the comps imply.
- What's the recent tenant-quality profile in this submarket — average credit score on applications, eviction rate, late-payment / NSF rate, and stable-employment percentage? A property-management company in the area should have these aggregated.
- How much new for-sale + rental construction is in the pipeline within 1–3 miles? Heavy new supply typically softens prices + rents 12–24 months out; constrained supply supports both.
Investment metrics
- 1% rule
- 2.76% ✓
- Cap rate
- 25.45%
- Cash-on-cash
- 68.43%
- DSCR
- 4.04
- GRM
- 3.0
CMA / ARV
- ARV (median comp)
- $202,266
- List price
- $72,500
- Delta
- -64.16%
- Verdict
- UNDERPRICED
- Comps
- 10 within 1.0 mi
Projected returns pro-forma
-3.0% appreciation · 0.77% rent growth · sell at horizon
- IRR
- 65.4%
- Equity multiple
- 3.84×
- Total profit
- $57,571
- Equity at exit
- $10,810
- IRR
- 69.0%
- Equity multiple
- 7.29×
- Total profit
- $127,758
- Equity at exit
- $6,268
Cash invested: $20,300 (down + closing). Projections, not guarantees.
Landlord ↔ Tenant lean methodology
- Overall (STATE)
- 70 Landlord-Friendly
- State Delaware
- 70 Landlord-Friendly · D+7
- County
- — inherits STATE
- City
- — inherits STATE
ZIP-level market 19958
- Rents YoY
- 0.8%
- Active inventory
- 818
- Price-to-rent
- 3.0×
Monthly cashflow live
- Estimated rent
- $2,002 medium interval (Pro) →
- Mortgage (P&I)
- −$380
- Tax from tax record
- −$14 /mo · $163/yr
- Insurance
- −$30
- HOA
- −$0
- Vacancy / Maint / Mgmt
- −$420
- Net cashflow
- $1,158
Break-even live
UW: 25.0% down · 7.5% · 30yr · 1.5% tax · 5.0% vac · 8.0% maint · 8.0% mgmt
Financing live
Cash to close
- Down payment
- $18,125
- Closing costs
- $2,175
- Reserves months
- —
- Total cash needed
- —
Loan-product check · same deal, 3 products live
Conventional
25% down · 7.5% · 30yr
- Down + closing
- —
- Monthly P&I
- —
- Monthly cashflow
- —
- DSCR
- —
- Eligible?
- —
Personal DTI + credit; lowest rate.
DSCR
20% down · 8.5% · 30yr
- Down + closing
- —
- Monthly P&I
- —
- Monthly cashflow
- —
- DSCR
- —
- Eligible?
- —
No personal income docs; deal must DSCR.
Hard money
10% down · 12.0% · 12mo
- Down + closing
- —
- Monthly P&I
- —
- Monthly cashflow
- —
- DSCR
- —
- Eligible?
- —
Short-term bridge; refi at stabilization.
Rent comps 4 comps
| Address | Beds | Baths | Sqft | Rent | $/sqft | DOM | Units | Dist |
|---|---|---|---|---|---|---|---|---|
| 33725 Skiff Aly #5309 Lewes, DE | 2.0 | 2.0 | 844 | $1,800 | $2.13 | 21d | 1 | 1.16mi |
| 22806 Sycamore Dr Lewes, DE | 2.0 | 1.5 | 840 | $1,550 | $1.85 | 13d | 1 | 1.32mi |
| 22828 Sycamore Dr Lewes, DE | 2.0 | 2.0 | 1100 | $2,400 | $2.18 | 13d | 1 | 1.34mi |
| 33135 Woodland Ct N Lewes, DE | 3.0 | 2.0 | 1120 | $2,250 | $2.01 | 13d | 1 | 1.35mi |
Listing history 24 events
-
2026-06-18days on market $72,500 Active 50 DOM
-
2026-06-17days on market $72,500 Active 49 DOM
-
2026-06-16days on market $72,500 Active 48 DOM
-
2026-06-15days on market $72,500 Active 47 DOM
-
2026-06-14days on market $72,500 Active 45 DOM
-
2026-06-13days on market $72,500 Active 44 DOM
-
2026-06-10days on market $72,500 Active 42 DOM
-
2026-06-09days on market $72,500 Active 41 DOM
-
2026-06-08days on market $72,500 Active 40 DOM
-
2026-06-07days on market $72,500 Active 39 DOM
-
2026-06-05days on market $72,500 Active 36 DOM
-
2026-06-03days on market $72,500 Active 35 DOM
-
2026-06-02days on market $72,500 Active 34 DOM
-
2026-06-01days on market $72,500 Active 33 DOM
-
2026-05-31days on market $72,500 Active 32 DOM
-
2026-05-30days on market $72,500 Active 31 DOM
-
2026-04-29price $77,000 1420-char remark
-
2026-04-29$75,000 Active 1420-char remark
-
2026-02-11historical
-
2026-01-08price $65,000
-
2025-12-08price $67,500
-
2025-11-08price $70,000
-
2025-11-08$70,000 Active
-
2025-10-03historical
ⓘ Source: listings_history table (triggers on properties + properties_extension) + one-shot
backfill from property_details.listing_events for pre-trigger history.
Tax reassessment forecast DE · Partial reset (capped growth)
- Current annual tax
- $163 · $14/mo
- Projected year-2 tax
- $292 · $24/mo
- Expected delta
- +$129/yr (+$11/mo · 79.3%)
ⓘ Screening estimate from a state-policy table — verify with the county assessor before closing.
Climate risk First Street
- Flood 6/10 Major FEMA zone X (unshaded) · 53% chance over 30 yrs
- Wildfire 3/10 Moderate
- Heat 8/10 Severe 7 d/yr ≥102°F today · 17 d/yr by 30 yrs out
- Wind 8/10 Severe 80% chance of damaging wind over 30 yrs
- Air quality 2/10 Low 1 unhealthy d/yr today · 1 by 30 yrs out
Nearby sold comps map
Loading sold comps map…
Walkable amenities ~0.75 mi
Loading nearby amenities…
Taxation est. · year 1
- Rental income
- $24,024
- − Mortgage interest
- −$4,061
- − Property taxes
- −$163
- − Insurance
- −$362
- − Repairs & maintenance
- −$1,922
- − Management
- −$1,922
- − Depreciation
- −$2,109
- Taxable income
- $13,485
- Est. tax owed @ 24.0%
- −$3,236
- After-tax cash flow
- $10,655/yr
For passive investors: Depreciation is non-cash, so a rental often shows a tax loss while cash-flowing — sheltering income. Rental losses are passive: they offset passive income freely, and up to $25,000/yr can offset ordinary (W-2) income if you actively participate and your MAGI is under $100k (phasing out to $0 by $150k); unused losses carry forward. On sale, claimed depreciation is recaptured at up to 25%, and gains may owe capital-gains tax (a 1031 exchange can defer both). Figures are a year-1 estimate at your 24.0% rate — not tax advice; consult a CPA.
Schools (NCES district)
- District
- Cape Henlopen School District
- NCES district ID
- 1000170
- Math proficiency
- 42% ▼ -14.00%
- Reading proficiency
- 55% ▼ -10.00%
- Median HH income
- $60,196
- Composite
- 42.47/100
- National rank
- #3214
- State rank
- #5 of 26 in DE
Livability — Long Neck
- Score
- 69/100
- State rank
- #30
- US rank
- #8720
Category grades
Schools grade is shown separately in the Schools card above.
Census & demographics
- County
- Sussex County · 82,708 people
- Metro
- Salisbury, MD-DE
- Population (ZIP)
- 31,938
- Household income
- $97,197
- Rent vs Own
- Severe rent burden
- 545.0
Population outlook (Sussex County) Hauer SSP2
- Today (2025)
- 248,853 people
- By 2030
- 264,464 · +6.3%
- By 2040
- 290,980 · +16.9%
- By 2050
- 311,259 · +25.1%
- By 2075
- 352,488 · +41.6%
- By 2100
- 367,406 · +47.6%
Race, ethnicity, and origin ACS 2023
- Neighborhood character
- Predominantly White (88%)
- Race & ethnicity
- White 88% Two or more races 6% Hispanic / Latino 4% Black 2% Asian 2%
- Common ancestry
- Romanian 6% Slovak 3% Italian 2%
- Foreign-born
- 6% · Canada
- Languages at home
- 93% English-only · Spanish 3% Other Indo-European 1% Russian/Polish/Slavic 1%
Political lean MEDSL · Sussex
- 2024 margin
- R (+11.0) · D 43.9% · R 54.9% · Other 1.2%
- 2008→2024 swing
- -2.4pp toward R · 2008: -8.6pp · 2024: -11.0pp
- All cycles
- 2024: R+11.0 2020: R+11.2 2016: R+22.0 2012: R+13.0 2008: R+8.6
Not yet ingested
- Civics
- —
Market trends
- HPI YoY
- ▼ -204.07%
- Current HPI
- 299.0736
- Rent YoY
- ▲ 0.77%
- Metro
- Salisbury, MD-DE
- State GDP YoY
- —
- F500 in state
- 0
Price history
+3.6% since first listed9 events — show timeline
- 2026-05-26 Price Changed $72,500 BRIGHT MLS
- 2026-04-29 Price Changed $77,000 BRIGHT MLS
- 2026-04-29 Listed $75,000 BRIGHT MLS
- 2026-02-11 Listing Removed — BRIGHT MLS
- 2026-01-08 Price Changed $65,000 BRIGHT MLS
- 2025-12-08 Price Changed $67,500 BRIGHT MLS
- 2025-11-08 Price Changed $70,000 BRIGHT MLS
- 2025-11-08 Listed $70,000 BRIGHT MLS
- 2025-10-03 Coming Soon — BRIGHT MLS
Property tax history
-4.1%/yrLatest (2025): $163 · -38.9% YoY. Source: county tax records.
Cash-flow waterfall
monthlySold comps — $/sqft
last 12 mo · ≤1 miLoading sold comps…