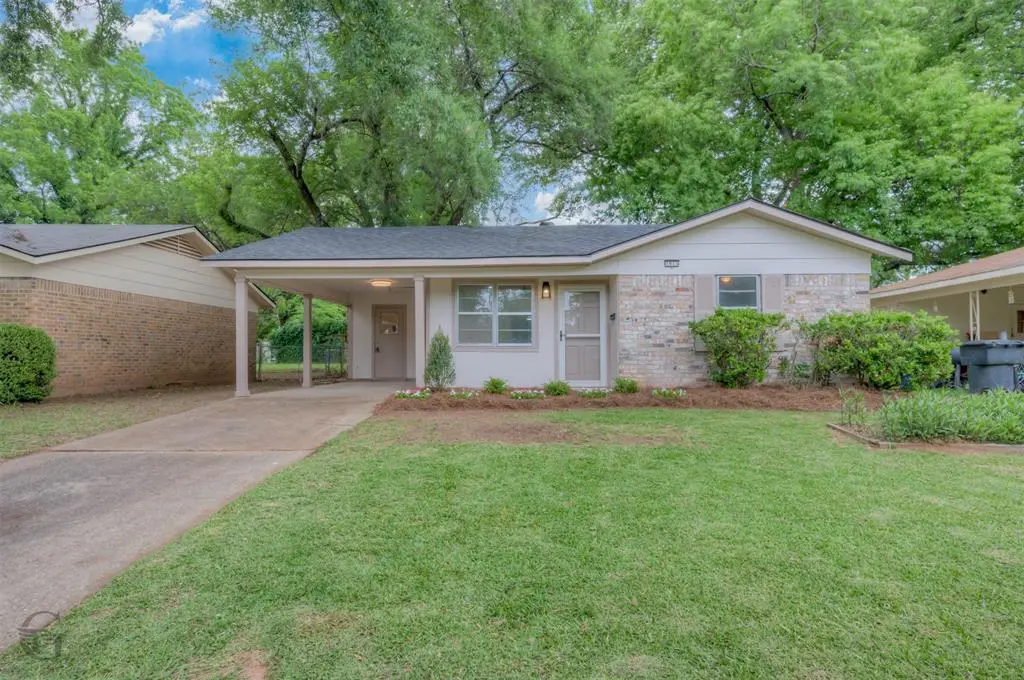
1915 Saturn St · Bossier City, LA
Flood risk 1/10 · Minimal
- FEMA flood zone
- X (unshaded)
- Chance of flooding over 30 yrs
- 0.0%
- Est. flood insurance / yr
- $507 – $1,088
Fire risk 2/10 · Minimal
- Est. fire insurance / yr
- $1,269 – $2,357
Heat risk 7/10 · Major
- Hot days now (above 110°F)
- 7 days/yr
- Hot days in 30 yrs
- 22 days/yr
Wind risk 6/10 · Moderate
- Chance of severe wind over 30 yrs
- 69.0%
Air-quality risk 2/10 · Minimal
- Unhealthy air days now
- 1 days/yr
- Unhealthy air days in 30 yrs
- 2 days/yr
Risk factors via First Street. Map © Google.
Why this score? — see what drove the D grade
The composite is a weighted blend of 9 inputs, each scored 0–100. Each bar is that input's sub-score; the figure is the points it added to the 100-point composite (weight × sub-score).
- Cash flow +15.8/30.0
- DSCR +4.9/10.0
- ARV discount +4.3/15.0
- Schools +3.8/10.0
- Livability +3.6/5.0
- 1% rule +3.4/10.0
- Rent growth +3.4/5.0
- Condition / age +2.5/5.0
- Appreciation +0.0/10.0
$184,900
🖨 Deal sheet 📄 Offer letter ✓ Due diligence
Listing remarks
Newly Remodeled 3-Bed, 2-Bath Home with Modern Upgrades Throughout! Step into this beautifully remodeled 3-bedroom, 2-bath home where style meets comfort. The open floor plan creates a bright, airy flow, perfect for both everyday living and entertaining. Enjoy brand-new flooring throughout, a stunning kitchen with quartz countertops, all-new stainless-steel appliances, and ample cabinet space. Both bathrooms have been tastefully updated with modern finishes to accentuate the rest of the house. Outside, the covered back porch patio offers ample space for family functions, a place to sip on morning coffee, or watch a summer storm blow in. A new roof provides peace of mind, while the fresh,
Key facts
- Open floor plan
- Quartz countertops
- Brand-new flooring
Tags
Property features AI
Finance
- Other: Subdivision: Sun City Sub; County: Bossier
- Financial info: Second mortgage: none; Loan type: Treat As Clear
- HOA & community: No association
Exterior
- Parking: Attached carport (1 covered space) and 1 carport space; Driveway
- Utilities: City water; City sewer; No municipal utility district
- Home design: Single family residence; One story; Residential property
- Construction: Built in 1971; Shingle roof; Slab foundation
- Exterior features: Lot less than 0.5 acre (approximately 0.165 acres); Concrete driveway; Covered parking
Interior
- Kitchen: Dishwasher; Electric cooktop; Electric oven; Gas range
- Bedrooms: 3 bedrooms (primary bedroom on level 1)
- Flooring: Luxury vinyl plank flooring
- Bathrooms: 2 bathrooms (1 full, 1 half)
- Heating & cooling: Central heating; Central air conditioning
- Interior features: Open floorplan; Built-in features; Decorative lighting; Plantation shutters
Neighborhood map
What this means for you Summary
Snapshot
- This is a 3-bed/1.5-bath single-family listed at $185k.
Deal economics
- At list price, monthly cash flow is $86 ($1k/yr) — positive.
- The deal already cash-flows at list — no discount required.
- To meet the 1% rule (rent ≥ 1% of price), the offer needs to be $156k (15.8% below list).
- Recommended offer: $156k (15.8% below list) — sets the bar for 1% rule.
- Cap rate 6.9% vs local median 4.7% in Bossier City — top-decile yield for the area; either an underpriced asset or a hidden risk that comps aren't pricing in. Stress-test before assuming the spread holds.
Location & tenants
- Location reads 71/100 on livability (#47 in LA) — a middle-class / working-renter tenant base. Strengths: commute A+, cost of living A+, housing A+; Watch: employment D+, crime F, amenities F.
- Bossier Parish (urban): math 40% / reading 47% proficiency, ranked #17 of 98 in LA (top 17%) — families likely to look elsewhere, expect single-tenant / working-renter base with shorter leases.
- Zoned schools: Bossier Elementary School (math 8% / reading 17%, grade F, #550 of 646 statewide, top 88%, 222 students, 93% FRL) — zoned schools average 93% FRL vs 41% district-wide (52 pts higher); higher-poverty schools than district average — tighter screening recommended.
- Zoned-school proficiency averages 12% at this address vs 44% district-wide (-31 pts) — the specific schools serving this property underperform the Bossier Parish average; the district grade overstates school quality for this exact location.
- Market conditions: Rents rising (+3.6%/yr); 145 active listings in the ZIP; 9 comparable units currently listed for rent nearby; rentals at typical pace (median 22d on market — plan ~3-4 weeks tenant-placement turnaround); 44% of comp listings sitting > 30 days — soft ceiling on asking rent; 716 units permitted in Bossier Parish in 2024 (0 in 5+ unit buildings).
- This rent runs 30% of the median local income ($62k/yr) — at the standard rent-burdened threshold; future hikes will face affordability resistance.
Forward outlook
- Local home prices are declining (-3.0%/yr); year-one equity from $1k of loan paydown is wiped out by about $6k of value loss. Plan a longer hold.
- Bossier County population projected at +28% by 2050 — long-run rental-demand tailwind backs the buy-and-hold thesis.
Negotiation context
- It's been on market 40 days — a 3% lower offer ($179k) is reasonable based on typical stale-listing flexibility.
- Current owner paid $60k; list at $185k implies a 208% gain — meaningful room to come down on a strong offer.
Risks & watch-outs
- Climate carrying-cost: major wind risk, 69% chance of damaging wind over 30y; extreme-heat days projected 7→22/yr by 2055 (HVAC capex compounding) — expect insurance premiums to compound above CPI over the hold.
Questions for the listing agent
- It's been on market 40 days. Have you received any prior offers? Is the seller open to a 16% concession, seller financing, or rate buy-down credit?
- Built in 1971 — when were the roof, HVAC, electrical panel, plumbing, and water heater last replaced?
- Is there a deadline driving the sale (1031 exchange, divorce, estate, relocation)? That informs how much negotiation room exists.
- Schools are B-rated — typically a magnet for longer-tenancy family renters. What's the average tenant stay here, and is there a school-zone premium baked into asking?
- Crime grade is F in this area — have there been break-ins, vandalism, or insurance claims at this property in the last 3 years? What carrier currently insures it and at what premium?
- The area grade is low — what's the realistic commute time and amenity access for the typical tenant pool here? Any planned neighborhood developments (good or bad) we should know about?
- What's the average days-on-market for RENTAL listings here right now (not sales)? A rising rental-DOM trend means longer vacancies and softer asking-rent achievability than the comps imply.
- What's the recent tenant-quality profile in this submarket — average credit score on applications, eviction rate, late-payment / NSF rate, and stable-employment percentage? A property-management company in the area should have these aggregated.
- How much new for-sale + rental construction is in the pipeline within 1–3 miles? Heavy new supply typically softens prices + rents 12–24 months out; constrained supply supports both.
Investment metrics
- 1% rule
- 0.84% ✗
- Cap rate
- 6.85%
- Cash-on-cash
- 1.99%
- DSCR
- 1.09
- GRM
- 9.9
CMA / ARV
- ARV (median comp)
- $172,521
- List price
- $184,900
- Delta
- 7.18%
- Verdict
- FAIR
- Comps
- 20 within 1.0 mi
Show comp detail 12 sales within ~0.75 mi
| Address | Dist | Beds/Ba | Sqft | Sold | Price | $/sf | Match |
|---|---|---|---|---|---|---|---|
| 2037 Orbit Dr | 0.06mi | 3/1.0 | 1,180 (-6%) | 1mo | $159,999 | $136 | 84 |
| 316 Gaston Ln | 0.27mi | 3/2.0 | 1,278 (+2%) | 2mo | $219,900 | $172 | 81 |
| 4214 Paul St | 0.41mi | 3/1.0 | 1,257 (-0%) | 1mo | $169,900 | $135 | 78 |
| 2102 Orbit Dr | 0.16mi | 3/1.5 | 1,151 (-9%) | 0mo | $167,500 | $146 | 78 |
| 4216 Evelyn St | 0.27mi | 3/1.0 | 1,172 (-7%) | 2mo | $164,900 | $141 | 72 |
| 2044 Orbit Dr | 0.11mi | 3/1.5 | 1,087 (-14%) | 1mo | $149,000 | $137 | 71 |
| 1819 Mars Dr | 0.28mi | 3/1.5 | 1,376 (+9%) | 1mo | $179,500 | $130 | 71 |
| 1908 Alison Ave | 0.26mi | 4/2.0 (+1) | 1,339 (+6%) | 1mo | $174,900 | $131 | 69 |
| 575 Whitefield Ln | 0.55mi | 3/2.0 | 1,278 (+2%) | 1mo | $224,900 | $176 | 69 |
| 604 Whitefield Ln | 0.49mi | 3/2.0 | 1,311 (+4%) | 0mo | $230,000 | $175 | 68 |
| 513 Linnhurst Dr | 0.33mi | 3/2.0 | 1,134 (-10%) | 1mo | $210,000 | $185 | 65 |
| 1952 Wild Iris | 0.54mi | 3/2.0 | 1,350 (+7%) | 2mo | $240,000 | $178 | 60 |
Match score weights: distance 35% · size 25% · config 20% · recency 20%. Top-matched comps best support the ARV.
Projected returns pro-forma
-3.0% appreciation · 3.6% rent growth · sell at horizon
- IRR
- -12.6%
- Equity multiple
- 0.54×
- Total profit
- $-23,600
- Equity at exit
- $27,569
- IRR
- -2.8%
- Equity multiple
- 0.81×
- Total profit
- $-9,811
- Equity at exit
- $15,987
Cash invested: $51,772 (down + closing). Projections, not guarantees.
Landlord ↔ Tenant lean methodology
- Overall (STATE)
- 90 Strongly Landlord-Friendly
- State Louisiana
- 90 Strongly Landlord-Friendly · R+12
- County
- — inherits STATE
- City
- — inherits STATE
ZIP-level market 71112
- Rents YoY
- 3.6%
- Active inventory
- 145
- Price-to-rent
- 9.9×
Monthly cashflow live
- Estimated rent
- $1,557 high interval (Pro) →
- Mortgage (P&I)
- −$970
- Tax from tax record
- −$98 /mo · $1,171/yr
- Insurance
- −$77
- HOA
- −$0
- Vacancy / Maint / Mgmt
- −$327
- Net cashflow
- $86
Break-even live
UW: 25.0% down · 7.5% · 30yr · 1.5% tax · 5.0% vac · 8.0% maint · 8.0% mgmt
Financing live
Cash to close
- Down payment
- $46,225
- Closing costs
- $5,547
- Reserves months
- —
- Total cash needed
- —
Loan-product check · same deal, 3 products live
Conventional
25% down · 7.5% · 30yr
- Down + closing
- —
- Monthly P&I
- —
- Monthly cashflow
- —
- DSCR
- —
- Eligible?
- —
Personal DTI + credit; lowest rate.
DSCR
20% down · 8.5% · 30yr
- Down + closing
- —
- Monthly P&I
- —
- Monthly cashflow
- —
- DSCR
- —
- Eligible?
- —
No personal income docs; deal must DSCR.
Hard money
10% down · 12.0% · 12mo
- Down + closing
- —
- Monthly P&I
- —
- Monthly cashflow
- —
- DSCR
- —
- Eligible?
- —
Short-term bridge; refi at stabilization.
Rent comps 9 comps
| Address | Beds | Baths | Sqft | Rent | $/sqft | DOM | Units | Dist |
|---|---|---|---|---|---|---|---|---|
| 4223 Elaine St Bossier City, LA | 3.0 | 1.0 | 1030 | $1,475 | $1.43 | 44d | 1 | 0.32mi |
| 1401 Gardenia St Bossier City, LA | 2.0 | 1.0 | 878 | $1,100 | $1.25 | 21d | 1 | 0.52mi |
| 1711 San Saba St Bossier City, LA | 3.0 | 1.5 | 1119 | $1,250 | $1.12 | 21d | 1 | 0.54mi |
| 4708 Longstreet Pl Bossier City, LA | 3.0 | 1.5 | 1108 | $1,500 | $1.35 | 44d | 1 | 0.57mi |
| 4720 Longstreet Pl Bossier City, LA | 3.0 | 2.0 | 1407 | $1,500 | $1.07 | 44d | 1 | 0.60mi |
| 3979 Stuart Ave Bossier City, LA | 3.0 | 1.5 | 1135 | $1,300 | $1.15 | 14d | 1 | 0.98mi |
| 5005 Longstreet Pl Unit 19 Bossier City, LA | 2.0 | 2.0 | 1200 | $1,500 | $1.25 | 21d | 1 | 1.15mi |
| 5005 Longstreet Pl #72 Bossier City, LA | 3.0 | 2.0 | 1309 | $1,650 | $1.26 | 44d | 1 | 1.15mi |
| 530 Antietam Dr Bossier City, LA | 3.0 | 2.0 | 1654 | $2,300 | $1.39 | 21d | 1 | 1.22mi |
Listing history 17 events
-
2026-06-18days on market $184,900 Active 40 DOM
-
2026-06-17price $184,900 Active 39 DOM
-
2026-06-17days on market $189,900 Active 39 DOM
-
2026-06-16days on market $189,900 Active 38 DOM
-
2026-06-15days on market $189,900 Active 37 DOM
-
2026-06-14days on market $189,900 Active 35 DOM
-
2026-06-13days on market $189,900 Active 34 DOM
-
2026-06-10days on market $189,900 Active 32 DOM
-
2026-06-09days on market $189,900 Active 31 DOM
-
2026-06-08days on market $189,900 Active 30 DOM
-
2026-06-07days on market $189,900 Active 29 DOM
-
2026-06-02days on market $189,900 Active 24 DOM
-
2026-06-01days on market $189,900 Active 23 DOM
-
2026-05-31days on market $189,900 Active 22 DOM
-
2026-05-30days on market $189,900 Active 21 DOM
-
2026-05-09$199,900 Active 943-char remark
-
2026-02-06soldstatus $60,000
ⓘ Source: listings_history table (triggers on properties + properties_extension) + one-shot
backfill from property_details.listing_events for pre-trigger history.
Tax reassessment forecast LA · Resets to sale price
- Current annual tax
- $1,171 · $98/mo
- Projected year-2 tax
- $1,171 · $98/mo
- Expected delta
- $0/yr ($0/mo · 0.0%)
ⓘ Screening estimate from a state-policy table — verify with the county assessor before closing.
Climate risk First Street
- Flood 1/10 Low FEMA zone X (unshaded) · 0% chance over 30 yrs
- Wildfire 2/10 Low
- Heat 7/10 Severe 7 d/yr ≥110°F today · 22 d/yr by 30 yrs out
- Wind 6/10 Major 69% chance of damaging wind over 30 yrs
- Air quality 2/10 Low 1 unhealthy d/yr today · 2 by 30 yrs out
Nearby sold comps map
Loading sold comps map…
Walkable amenities ~0.75 mi
Loading nearby amenities…
Taxation est. · year 1
- Rental income
- $18,687
- − Mortgage interest
- −$10,357
- − Property taxes
- −$1,171
- − Insurance
- −$924
- − Repairs & maintenance
- −$1,495
- − Management
- −$1,495
- − Depreciation
- −$5,379
- Taxable loss
- −$2,135
- Est. tax savings @ 24.0%
- +$512
- After-tax cash flow
- $1,544/yr
For passive investors: Depreciation is non-cash, so a rental often shows a tax loss while cash-flowing — sheltering income. Rental losses are passive: they offset passive income freely, and up to $25,000/yr can offset ordinary (W-2) income if you actively participate and your MAGI is under $100k (phasing out to $0 by $150k); unused losses carry forward. On sale, claimed depreciation is recaptured at up to 25%, and gains may owe capital-gains tax (a 1031 exchange can defer both). Figures are a year-1 estimate at your 24.0% rate — not tax advice; consult a CPA.
Schools (NCES district)
- District
- Bossier Parish
- NCES district ID
- 2200270
- Math proficiency
- 40% ▼ -32.00%
- Reading proficiency
- 47% ▼ -28.00%
- Median HH income
- $51,326
- Composite
- 37.5/100
- National rank
- #4402
- State rank
- #17 of 98 in LA
Livability — Bossier City
- Score
- 71/100
- State rank
- #47
- US rank
- #7044
Category grades
Schools grade is shown separately in the Schools card above.
Census & demographics
- Census place
- Bossier City, LA
- County
- Bossier Parish · 98,704 people
- City population
- 91,925
- Metro
- Shreveport-Bossier City, LA
- Population (ZIP)
- 33,587
- Household income
- $61,760
- Rent vs Own
- Severe rent burden
- 1391.0
Population outlook (Bossier County) Hauer SSP2
- Today (2025)
- 143,247 people
- By 2030
- 151,802 · +6.0%
- By 2040
- 168,194 · +17.4%
- By 2050
- 183,533 · +28.1%
- By 2075
- 217,009 · +51.5%
- By 2100
- 230,091 · +60.6%
Race, ethnicity, and origin ACS 2023
- Neighborhood character
- Diverse neighborhood (Simpson 0.57)
- Race & ethnicity
- White 59% Black 24% Hispanic / Latino 12% Two or more races 8% Asian 2%
- Hispanic origin (detail)
- Mexican 9%
- Common ancestry
- Lithuanian 2% Slovak 1% Scottish 1%
- Foreign-born
- 5% · Canada, Vietnam
- Languages at home
- 89% English-only · Spanish 7% Other Indo-European 1% Tagalog/Filipino 1%
Political lean MEDSL · Bossier
- 2024 margin
- Solid R (+43.3) · D 27.7% · R 71.0% · Other 1.3%
- 2008→2024 swing
- +0.3pp no change · 2008: -43.7pp · 2024: -43.3pp
- All cycles
- 2024: R+43.3 2020: R+41.0 2016: R+45.8 2012: R+45.4 2008: R+43.7
Not yet ingested
- Civics
- —
Market trends
- HPI YoY
- ▼ -77.48%
- Current HPI
- 127.9821
- Rent YoY
- ▲ 3.60%
- Metro
- Shreveport-Bossier City, LA
- State GDP YoY
- ▲ 3.29%
- F500 in state
- 10
Industry mix (Fortune 500 HQ in LA)
| Industry | F500 HQs | Revenue |
|---|---|---|
| Telecommunications | 2 | $23B |
|
||
| Utilities | 1 | $12B |
|
||
| Wholesale / Distribution | 1 | $5B |
|
||
| Advertising | 1 | $2B |
|
||
Price history
+208.2% since first listed4 events — show timeline
- 2026-06-17 Price Changed $184,900 NTREIS
- 2026-05-28 Price Changed $189,900 NTREIS
- 2026-05-09 Listed $199,900 NTREIS
- 2026-02-06 Sold (Public Records) $60,000 Public Records
Property tax history
-1.2%/yrLatest (2025): $1,171 · -1.3% YoY. Source: county tax records.
Cash-flow waterfall
monthlySold comps — $/sqft
last 12 mo · ≤1 miLoading sold comps…