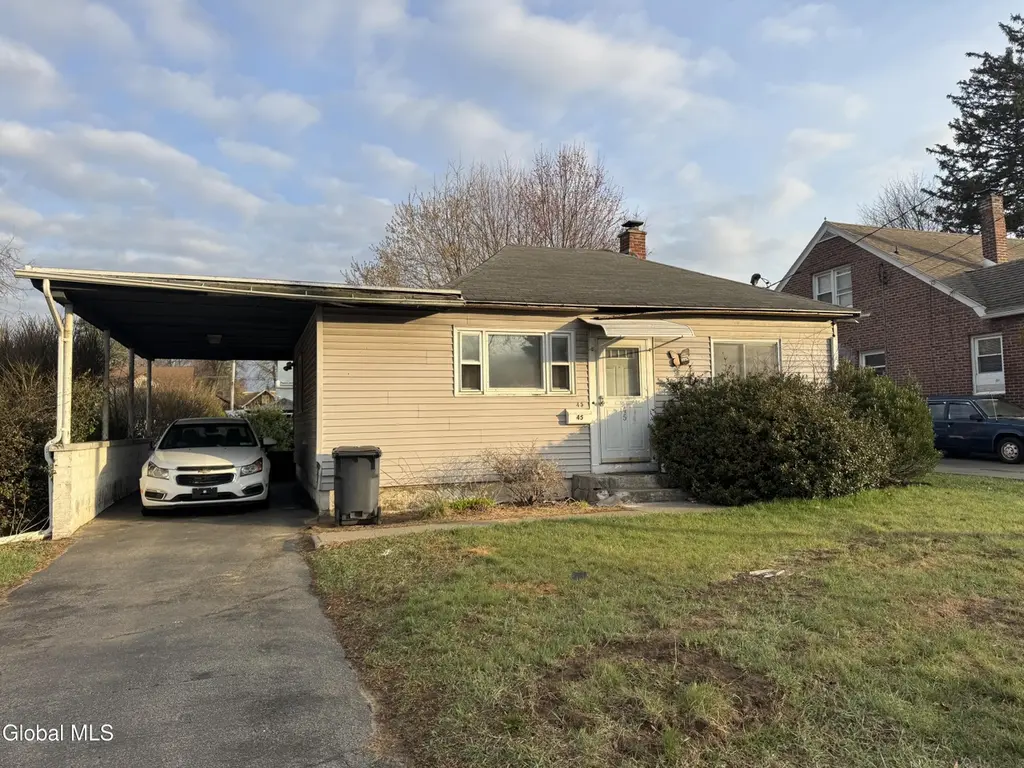
45 Hudson Ave · Roessleville, NY
Flood risk 1/10 · Minimal
- FEMA flood zone
- X (unshaded)
- Chance of flooding over 30 yrs
- 0.0%
- Est. flood insurance / yr
- $473 – $860
Fire risk 1/10 · Minimal
- Est. fire insurance / yr
- $691 – $1,283
Heat risk 4/10 · Minor
- Hot days now (above 96°F)
- 7 days/yr
- Hot days in 30 yrs
- 16 days/yr
Wind risk 3/10 · Minor
- Chance of severe wind over 30 yrs
- 6.0%
Air-quality risk 1/10 · Minimal
- Unhealthy air days now
- 0 days/yr
- Unhealthy air days in 30 yrs
- 0 days/yr
Risk factors via First Street. Map © Google.
Why this score? — see what drove the B grade
The composite is a weighted blend of 9 inputs, each scored 0–100. Each bar is that input's sub-score; the figure is the points it added to the 100-point composite (weight × sub-score).
- Cash flow +30.0/30.0
- 1% rule +10.0/10.0
- DSCR +10.0/10.0
- ARV discount +7.5/15.0
- Schools +5.3/10.0
- Rent growth +2.5/5.0
- Livability +2.5/5.0
- Condition / age +2.5/5.0
- Appreciation +0.0/10.0
$79,000
🖨 Deal sheet 📄 Offer letter ✓ Due diligence
Listing remarks
MULTIPLE OFFERS RECEIVED ON THIS HOME. SELLER IS ASKING FOR ALL OFFERS TO BE IN BY THIS FRIDAY, APRIL 24 AT 4PM Opportunity knocks in Colonie! This 2-bedroom, 774 sq ft bungalow located in the highly desirable South Colonie School District offers incredible potential for investors, contractors, or flippers. Situated in a great neighborhood on a double lot, this property features solid bones but requires significant renovation due to prior water damage.
Key facts
- Solid bones
- Great neighborhood
- Double lot
Tags
Neighborhood map
What this means for you Summary
Snapshot
- This is a 2-bed/1.0-bath single-family listed at $79k.
Deal economics
- At list price, monthly cash flow is $758 ($9k/yr) — positive.
- The deal already cash-flows at list — no discount required.
- Meets the 1% rule at list price ($2k rent vs $79k).
- Cap rate 17.8% vs local median 5.3% in Roessleville — top-decile yield for the area; either an underpriced asset or a hidden risk that comps aren't pricing in. Stress-test before assuming the spread holds.
Location & tenants
- Location reads: area grade B — affects rentability + tenant quality, not the cash-flow math above.
- South Colonie Central School District (suburban): math 63% / reading 57% proficiency, ranked #215 of 590 in NY (top 36%) — acceptable for families but not a draw, mixed tenant base, ~2y average lease; only 19% free/reduced lunch — higher-income household profile.
- Zoned schools: Colonie Central High School (math 96% / reading 72%, grade A, #404 of 1,100 statewide, top 37%, 1,538 students, 39% FRL) — zoned schools average 39% FRL vs 19% district-wide (20 pts higher); higher-poverty schools than district average — tighter screening recommended.
- Zoned-school proficiency averages 84% at this address vs 60% district-wide (+24 pts) — the actual schools serving this property are materially stronger than the South Colonie Central School District average implies; a family-tenant draw the district grade alone would hide.
- Market conditions: 105 active listings in the ZIP; 10 comparable units currently listed for rent nearby; rentals at typical pace (median 22d on market — plan ~3-4 weeks tenant-placement turnaround); solid renter incomes; 675 units permitted in Albany County in 2024 (451 in 5+ unit buildings).
Forward outlook
- Local home prices are declining (-3.0%/yr); year-one equity from $546 of loan paydown is wiped out by about $2k of value loss. Plan a longer hold.
- Albany County population projected at +9% by 2050 — modest demand growth; plan on rents tracking national, not racing it.
- At projected returns (-3.0% appreciation + 3.0% rent growth), your $22k cash investment doubles in ~3 years — after that, you're playing with house money.
Negotiation context
- Only 4 days on market — expect competitive offers; lowballing is unlikely to land.
Risks & watch-outs
- Watch-outs: property tax is 4.1% of price; built in 1950 — expect roof / HVAC / electrical / plumbing capex.
Questions for the listing agent
- Built in 1950 — when were the roof, HVAC, electrical panel, plumbing, and water heater last replaced?
- Property tax is high relative to price — has the assessment been appealed recently, and will the sale trigger a re-assessment?
- Is there a deadline driving the sale (1031 exchange, divorce, estate, relocation)? That informs how much negotiation room exists.
- What's the average days-on-market for RENTAL listings here right now (not sales)? A rising rental-DOM trend means longer vacancies and softer asking-rent achievability than the comps imply.
- What's the recent tenant-quality profile in this submarket — average credit score on applications, eviction rate, late-payment / NSF rate, and stable-employment percentage? A property-management company in the area should have these aggregated.
- How much new for-sale + rental construction is in the pipeline within 1–3 miles? Heavy new supply typically softens prices + rents 12–24 months out; constrained supply supports both.
Investment metrics
- 1% rule
- 2.36% ✓
- Cap rate
- 17.80%
- Cash-on-cash
- 41.10%
- DSCR
- 2.83
- GRM
- 3.5
CMA / ARV
- ARV (on-the-fly)
- $194,274
- Comps found
- 5
Show comp detail 5 sales within ~0.75 mi
| Address | Dist | Beds/Ba | Sqft | Sold | Price | $/sf | Match |
|---|---|---|---|---|---|---|---|
| 45 Hudson Ave | 0.23mi | 2/1.0 | 774 (0%) | 0mo | $133,888 | $173 | 89 |
| 1 Spruce St | 0.17mi | 2/1.0 | 816 (+5%) | 1mo | $205,000 | $251 | 82 |
| 14 Mountain View Ave | 0.32mi | 1/1.0 (-1) | 838 (+8%) | 10mo | $170,000 | $203 | 58 |
| 29 Rooney Ave | 0.71mi | 2/1.0 | 744 (-4%) | 10mo | $225,000 | $302 | 53 |
| 36 Elmhurst Ave | 0.64mi | 2/1.0 | 832 (+8%) | 18mo | $211,501 | $254 | 43 |
Match score weights: distance 35% · size 25% · config 20% · recency 20%. Top-matched comps best support the ARV.
Projected returns pro-forma
-3.0% appreciation · 3.0% rent growth · sell at horizon
- IRR
- 37.7%
- Equity multiple
- 2.61×
- Total profit
- $35,578
- Equity at exit
- $11,779
- IRR
- 44.3%
- Equity multiple
- 5.23×
- Total profit
- $93,644
- Equity at exit
- $6,830
Cash invested: $22,120 (down + closing). Projections, not guarantees.
Landlord ↔ Tenant lean methodology
- Overall (STATE)
- 15 Strongly Tenant-Friendly
- State New York
- 15 Strongly Tenant-Friendly · D+10
- County
- — inherits STATE
- City
- — inherits STATE
ZIP-level market 12205
- Active inventory
- 105
- Price-to-rent
- 3.5×
Monthly cashflow live
- Estimated rent
- $1,864 high interval (Pro) →
- Mortgage (P&I)
- −$414
- Tax from tax record
- −$268 /mo · $3,212/yr
- Insurance
- −$33
- HOA
- −$0
- Vacancy / Maint / Mgmt
- −$391
- Net cashflow
- $758
Break-even live
UW: 25.0% down · 7.5% · 30yr · 1.5% tax · 5.0% vac · 8.0% maint · 8.0% mgmt
Financing live
Cash to close
- Down payment
- $19,750
- Closing costs
- $2,370
- Reserves months
- —
- Total cash needed
- —
Loan-product check · same deal, 3 products live
Conventional
25% down · 7.5% · 30yr
- Down + closing
- —
- Monthly P&I
- —
- Monthly cashflow
- —
- DSCR
- —
- Eligible?
- —
Personal DTI + credit; lowest rate.
DSCR
20% down · 8.5% · 30yr
- Down + closing
- —
- Monthly P&I
- —
- Monthly cashflow
- —
- DSCR
- —
- Eligible?
- —
No personal income docs; deal must DSCR.
Hard money
10% down · 12.0% · 12mo
- Down + closing
- —
- Monthly P&I
- —
- Monthly cashflow
- —
- DSCR
- —
- Eligible?
- —
Short-term bridge; refi at stabilization.
Rent comps 10 comps
| Address | Beds | Baths | Sqft | Rent | $/sqft | DOM | Units | Dist |
|---|---|---|---|---|---|---|---|---|
| 12 California Ave Albany, NY | 2.0 | 1.0 | 685 | $1,825 | $2.66 | 14d | 1 | 0.36mi |
| 50 Rooney Ave Albany, NY | 2.0 | 1.0 | 714 | $2,000 | $2.80 | 44d | 1 | 0.76mi |
| 8 Norton St Albany, NY | 2.0 | 1.0 | 1100 | $1,695 | $1.54 | 14d | 1 | 0.92mi |
| 8 Norton St Trlr 10 Albany, NY | 2.0 | 1.0 | 1100 | $1,695 | $1.54 | 23d | 1 | 0.92mi |
| 14 Orford St Unit 1 1s Albany, NY | 2.0 | 1.0 | 800 | $1,700 | $2.12 | 14d | 1 | 0.97mi |
| 420 Sand Creek Rd Albany, NY | 1.0–2.0 | 1.0 | 720 | $1,755 | $2.44 | 14d | 1 | 1.02mi |
| 13 Richards Dr Albany, NY | 2.0 | 1.0 | 1100 | $2,500 | $2.27 | 21d | 1 | 1.22mi |
| 13 Hawley Ave Albany, NY | 3.0 | 1.0 | 864 | $2,550 | $2.95 | 44d | 1 | 1.24mi |
| 18 Lily St Albany, NY | 2.0 | 1.0 | 650 | $1,200 | $1.85 | 44d | 1 | 1.31mi |
| 255 Patroon Creek Blvd Albany, NY | 1.0–3.0 | 1.0–2.0 | 1080 | $2,226 | $2.06 | 14d | 22 | 1.32mi |
Listing history 2 events
-
2026-04-25status Pending
-
2026-04-21$79,000 Active
ⓘ Source: listings_history table (triggers on properties + properties_extension) + one-shot
backfill from property_details.listing_events for pre-trigger history.
Tax reassessment forecast NY · Partial reset (capped growth)
- Current annual tax
- $3,212 · $268/mo
- Projected year-2 tax
- $3,212 · $268/mo
- Expected delta
- $0/yr ($0/mo · 0.0%)
ⓘ Screening estimate from a state-policy table — verify with the county assessor before closing.
Climate risk First Street
- Flood 1/10 Low FEMA zone X (unshaded) · 0% chance over 30 yrs
- Wildfire 1/10 Low
- Heat 4/10 Moderate 7 d/yr ≥96°F today · 16 d/yr by 30 yrs out
- Wind 3/10 Moderate 6% chance of damaging wind over 30 yrs
- Air quality 1/10 Low 0 unhealthy d/yr today · 0 by 30 yrs out
Nearby sold comps map
Loading sold comps map…
Walkable amenities ~0.75 mi
Loading nearby amenities…
Taxation est. · year 1
- Rental income
- $22,365
- − Mortgage interest
- −$4,425
- − Property taxes
- −$3,212
- − Insurance
- −$395
- − Repairs & maintenance
- −$1,789
- − Management
- −$1,789
- − Depreciation
- −$2,298
- Taxable income
- $8,457
- Est. tax owed @ 24.0%
- −$2,030
- After-tax cash flow
- $7,061/yr
For passive investors: Depreciation is non-cash, so a rental often shows a tax loss while cash-flowing — sheltering income. Rental losses are passive: they offset passive income freely, and up to $25,000/yr can offset ordinary (W-2) income if you actively participate and your MAGI is under $100k (phasing out to $0 by $150k); unused losses carry forward. On sale, claimed depreciation is recaptured at up to 25%, and gains may owe capital-gains tax (a 1031 exchange can defer both). Figures are a year-1 estimate at your 24.0% rate — not tax advice; consult a CPA.
Schools (NCES district)
- District
- South Colonie Central School District
- NCES district ID
- 3627210
- Math proficiency
- 63% ▼ -1.00%
- Reading proficiency
- 57% ▲ 4.00%
- Median HH income
- $69,499
- Composite
- 52.97/100
- National rank
- #1527
- State rank
- #215 of 590 in NY
Livability — Roessleville
No livability data for this city. (Only ~50 U.S. cities are tracked.)
Census & demographics
- Census place
- Roessleville, NY
- County
- Albany County · 196,626 people
- Metro
- Albany-Schenectady-Troy, NY
- Population (ZIP)
- 25,838
- Household income
- $91,020
- Rent vs Own
- Severe rent burden
- 530.0
Population outlook (Albany County) Hauer SSP2
- Today (2025)
- 320,794 people
- By 2030
- 327,401 · +2.1%
- By 2040
- 338,218 · +5.4%
- By 2050
- 348,467 · +8.6%
- By 2075
- 381,693 · +19.0%
- By 2100
- 393,809 · +22.8%
Race, ethnicity, and origin ACS 2023
- Neighborhood character
- Predominantly White (73%)
- Race & ethnicity
- White 73% Asian 8% Black 8% Two or more races 6% Hispanic / Latino 5%
- Hispanic origin (detail)
- Puerto Rican 3%
- Common ancestry
- Romanian 6% Lithuanian 3% Iranian 2%
- Foreign-born
- 13% · Canada, China, Vietnam
- Languages at home
- 84% English-only · Other Indo-European 4% Russian/Polish/Slavic 3% Tagalog/Filipino 2%
Political lean MEDSL · Albany
- 2024 margin
- Strong D (+25.8) · D 62.9% · R 37.1%
- 2008→2024 swing
- -3.6pp toward R · 2008: 29.4pp · 2024: 25.8pp
- All cycles
- 2024: D+25.8 2020: D+31.4 2016: D+24.3 2012: D+31.0 2008: D+29.4
Not yet ingested
- Civics
- —
Market trends
- HPI YoY
- ▼ -182.10%
- Current HPI
- 302.9752
- Rent YoY
- —
- Metro
- Albany-Schenectady-Troy, NY
- State GDP YoY
- ▲ 2.60%
- F500 in state
- 92
Industry mix (Fortune 500 HQ in NY)
| Industry | F500 HQs | Revenue |
|---|---|---|
| Financial Services | 10 | $950B |
|
||
| Consumer Goods | 9 | $162B |
|
||
| Insurance | 4 | $225B |
|
||
| Telecommunications | 2 | $144B |
|
||
| Pharmaceuticals | 2 | $112B |
|
||
| Media / Entertainment | 2 | $69B |
|
||
Price history
2 events — show timeline
- 2026-04-25 Pending — Global MLS
- 2026-04-21 Listed $79,000 Global MLS
Property tax history
+2.8%/yrLatest (2025): $3,212 · -4.4% YoY. Source: county tax records.
Cash-flow waterfall
monthlySold comps — $/sqft
last 12 mo · ≤1 miLoading sold comps…