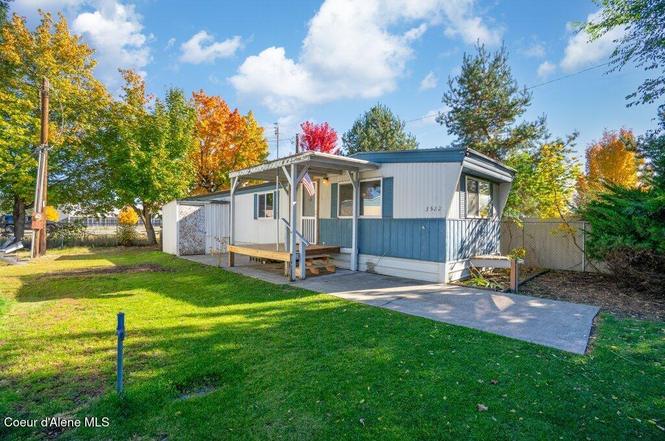
3522 N Baron Ct · Coeur d'Alene, ID
Flood risk No data
- FEMA flood zone
- —
- Chance of flooding over 30 yrs
- —
- Est. flood insurance / yr
- —
Fire risk No data
- Est. fire insurance / yr
- —
Heat risk No data
- Hot days now (above threshold)
- —
- Hot days in 30 yrs
- —
Wind risk No data
- Chance of severe wind over 30 yrs
- —
Air-quality risk No data
- Unhealthy air days now
- —
- Unhealthy air days in 30 yrs
- —
Risk factors via First Street. Map © Google.
Why this score? — see what drove the B grade
The composite is a weighted blend of 9 inputs, each scored 0–100. Each bar is that input's sub-score; the figure is the points it added to the 100-point composite (weight × sub-score).
- Cash flow +30.0/30.0
- 1% rule +10.0/10.0
- DSCR +10.0/10.0
- ARV discount +7.5/15.0
- Schools +4.4/10.0
- Rent growth +3.6/5.0
- Livability +2.5/5.0
- Condition / age +2.5/5.0
- Appreciation +0.0/10.0
$55,000
🖨 Deal sheet 📄 Offer letter ✓ Due diligence
Listing remarks
Welcome to this completely custom remodeled single-wide home that perfectly blends modern comfort with unbeatable convenience. This turn-key residence offers 2 bedrooms and 1 beautifully updated bathroom, thoughtfully designed to make the most of every inch of space. Step inside to find brand-new cabinetry, contemporary flooring, and a sleek, fully updated bathroom. The vaulted ceilings in the living room create an open, airy feeling.
Key facts
- Custom remodeled
- Vaulted ceilings
- Brand-new cabinetry
Tags
Property features AI
Exterior
- Parking: Paved parking
- Utilities: Public sewer; Community water system
- Home design: Mobile home; Pillar/post/pier foundation; Rubber roof
- Construction: Aluminum siding; BRKW make/model mobile home
- Exterior features: Covered deck; Corner lot; Private maintained road
Interior
- Kitchen: Electric range; Refrigerator; Dishwasher
- Bedrooms: 2 bedrooms on the main level
- Flooring: Laminate flooring
- Bathrooms: 1 bathroom on the main level
- Heating & cooling: Forced air heating (natural gas and electric); Wall cooling unit(s)
- Interior features: Washer hookup; No basement (crawl space)
- Laundry & utility: Washer hookup; Gas water heater
Neighborhood map
What this means for you Summary
Snapshot
- This is a 2-bed/1.0-bath single-family listed at $55k.
Deal economics
- At list price, monthly cash flow is $841 ($10k/yr) — positive.
- The deal already cash-flows at list — no discount required.
- Meets the 1% rule at list price ($2k rent vs $55k).
- Recommended offer: $50k (9.0% below list) — sets the bar for market timing.
- Cap rate 24.6% vs local median 2.2% in Coeur d'Alene — top-decile yield for the area; either an underpriced asset or a hidden risk that comps aren't pricing in. Stress-test before assuming the spread holds.
Location & tenants
- Location reads: area grade B — affects rentability + tenant quality, not the cash-flow math above.
- Coeur D'Alene District (urban): math 44% / reading 60% proficiency, ranked #23 of 92 in ID (top 25%) — acceptable for families but not a draw, mixed tenant base, ~2y average lease.
- Market conditions: Rents rising fast (+4.2%/yr); 318 active listings in the ZIP; 7 comparable units currently listed for rent nearby; rentals leasing fast (median 13d on market — plan ~1-2 weeks tenant-placement turnaround); solid renter incomes; 1,606 units permitted in Kootenai County in 2024 (154 in 5+ unit buildings).
Forward outlook
- Local home prices are declining (-3.0%/yr); year-one equity from $380 of loan paydown is wiped out by about $2k of value loss. Plan a longer hold.
- Kootenai County population projected at +33% by 2050 — long-run rental-demand tailwind backs the buy-and-hold thesis.
- At projected returns (-3.0% appreciation + 4.2% rent growth), your $15k cash investment doubles in ~2 years — after that, you're playing with house money.
Negotiation context
- It's been on market 120 days — a 9% lower offer ($50k) is reasonable based on typical stale-listing flexibility.
Questions for the listing agent
- It's been on market 120 days. Have you received any prior offers? Is the seller open to a 9% concession, seller financing, or rate buy-down credit?
- Built in 1971 — when were the roof, HVAC, electrical panel, plumbing, and water heater last replaced?
- Why hasn't it sold? Are there any deal-killer items the seller is aware of (foundation, flood, title, zoning, code violations)?
- Is there a deadline driving the sale (1031 exchange, divorce, estate, relocation)? That informs how much negotiation room exists.
- What's the average days-on-market for RENTAL listings here right now (not sales)? A rising rental-DOM trend means longer vacancies and softer asking-rent achievability than the comps imply.
- What's the recent tenant-quality profile in this submarket — average credit score on applications, eviction rate, late-payment / NSF rate, and stable-employment percentage? A property-management company in the area should have these aggregated.
- How much new for-sale + rental construction is in the pipeline within 1–3 miles? Heavy new supply typically softens prices + rents 12–24 months out; constrained supply supports both.
Investment metrics
- 1% rule
- 2.81% ✓
- Cap rate
- 24.65%
- Cash-on-cash
- 65.55%
- DSCR
- 3.92
- GRM
- 3.0
CMA / ARV
- ARV (on-the-fly)
- $306,252
- Comps found
- 7
Show comp detail 7 sales within ~0.75 mi
| Address | Dist | Beds/Ba | Sqft | Sold | Price | $/sf | Match |
|---|---|---|---|---|---|---|---|
| 4408 N Meadow Ranch Ave | 0.33mi | 2/1.0 | 767 (+6%) | 6mo | $339,000 | $442 | 70 |
| 158 W Stratus Ln | 0.29mi | 2/1.0 | 784 (+8%) | 9mo | $70,000 | $89 | 65 |
| 4386 N Meadow Ranch Ave | 0.34mi | 2/1.0 | 795 (+10%) | 4mo | $330,000 | $415 | 64 |
| 4372 N Meadow Ranch Ave | 0.35mi | 2/1.0 | 792 (+9%) | 8mo | $340,000 | $429 | 62 |
| 4368 N Meadow Ranch Ave | 0.35mi | 2/1.0 | 792 (+9%) | 8mo | $335,000 | $423 | 61 |
| 3041 N Weathers Ln | 0.31mi | 2/1.0 | 784 (+8%) | 23mo | $67,500 | $86 | 52 |
| 4412 N Meadow Ranch Ave | 0.33mi | 2/1.0 | 792 (+9%) | 20mo | $345,000 | $436 | 52 |
Match score weights: distance 35% · size 25% · config 20% · recency 20%. Top-matched comps best support the ARV.
Projected returns pro-forma
-3.0% appreciation · 4.2% rent growth · sell at horizon
- IRR
- 66.1%
- Equity multiple
- 4.02×
- Total profit
- $46,577
- Equity at exit
- $8,201
- IRR
- 70.8%
- Equity multiple
- 8.64×
- Total profit
- $117,586
- Equity at exit
- $4,755
Cash invested: $15,400 (down + closing). Projections, not guarantees.
Landlord ↔ Tenant lean methodology
- Overall (STATE)
- 91 Strongly Landlord-Friendly
- State Idaho
- 91 Strongly Landlord-Friendly · R+18
- County
- — inherits STATE
- City
- — inherits STATE
ZIP-level market 83815
- Rents YoY
- 4.2%
- Active inventory
- 318
- Price-to-rent
- 3.0×
Monthly cashflow live
- Estimated rent
- $1,546 high interval (Pro) →
- Mortgage (P&I)
- −$288
- Tax est. 1.5%
- −$69 /mo · $825/yr
- Insurance
- −$23
- HOA
- −$0
- Vacancy / Maint / Mgmt
- −$325
- Net cashflow
- $841
Break-even live
UW: 25.0% down · 7.5% · 30yr · 1.5% tax · 5.0% vac · 8.0% maint · 8.0% mgmt
Financing live
Cash to close
- Down payment
- $13,750
- Closing costs
- $1,650
- Reserves months
- —
- Total cash needed
- —
Loan-product check · same deal, 3 products live
Conventional
25% down · 7.5% · 30yr
- Down + closing
- —
- Monthly P&I
- —
- Monthly cashflow
- —
- DSCR
- —
- Eligible?
- —
Personal DTI + credit; lowest rate.
DSCR
20% down · 8.5% · 30yr
- Down + closing
- —
- Monthly P&I
- —
- Monthly cashflow
- —
- DSCR
- —
- Eligible?
- —
No personal income docs; deal must DSCR.
Hard money
10% down · 12.0% · 12mo
- Down + closing
- —
- Monthly P&I
- —
- Monthly cashflow
- —
- DSCR
- —
- Eligible?
- —
Short-term bridge; refi at stabilization.
Rent comps 7 comps
| Address | Beds | Baths | Sqft | Rent | $/sqft | DOM | Units | Dist |
|---|---|---|---|---|---|---|---|---|
| 110 E Borah Ave Unit 3 Coeur d'Alene, ID | 2.0 | 1.0 | 600 | $1,295 | $2.16 | 21d | 1 | 0.77mi |
| 1000 W Ironwood Dr Coeur D Alene, ID | 2.0 | 1.0 | 715 | $1,610 | $2.25 | 13d | 2 | 0.98mi |
| 1053 Emma Ave Apt 214 Coeur d'Alene, ID | 1.0 | 1.0 | 740 | $473 | $0.64 | 13d | 1 | 1.13mi |
| 1001 W Emma Ave Coeur D Alene, ID | 1.0–2.0 | 1.0 | 650 | $1,350 | $2.08 | 13d | 3 | 1.14mi |
| 1101 Emma Ave Unit 1101 Emma L Coeur d'Alene, ID | 2.0 | 2.0 | 700 | $1,375 | $1.96 | 21d | 1 | 1.17mi |
| 1705 N Government Way Coeur D Alene, ID | 1.0–2.0 | 1.0 | 770 | $1,550 | $2.01 | 13d | 5 | 1.27mi |
| 1908 N 8th St Unit Pin Coeur d'Alene, ID | 2.0 | 1.0 | 750 | $1,475 | $1.97 | 21d | 1 | 1.34mi |
Listing history 19 events
-
2026-06-19days on market $55,000 Active 120 DOM
-
2026-06-18days on market $55,000 Active 119 DOM
-
2026-06-17days on market $55,000 Active 118 DOM
-
2026-06-16days on market $55,000 Active 117 DOM
-
2026-06-15days on market $55,000 Active 116 DOM
-
2026-06-14days on market $55,000 Active 114 DOM
-
2026-06-13days on market $55,000 Active 113 DOM
-
2026-06-10days on market $55,000 Active 111 DOM
-
2026-06-09days on market $55,000 Active 110 DOM
-
2026-06-09price $55,000 Active 109 DOM
-
2026-06-08days on market $64,999 Active 109 DOM
-
2026-06-07days on market $64,999 Active 108 DOM
-
2026-06-03days on market $64,999 Active 104 DOM
-
2026-06-02days on market $64,999 Active 103 DOM
-
2026-06-01days on market $64,999 Active 102 DOM
-
2026-05-31days on market $64,999 Active 101 DOM
-
2026-05-30days on market $64,999 Active 100 DOM
-
2026-04-12price $64,999
-
2026-02-19$74,999 Active
ⓘ Source: listings_history table (triggers on properties + properties_extension) + one-shot
backfill from property_details.listing_events for pre-trigger history.
Nearby sold comps map
Loading sold comps map…
Walkable amenities ~0.75 mi
Loading nearby amenities…
Taxation est. · year 1
- Rental income
- $18,552
- − Mortgage interest
- −$3,081
- − Property taxes
- −$825
- − Insurance
- −$275
- − Repairs & maintenance
- −$1,484
- − Management
- −$1,484
- − Depreciation
- −$1,600
- Taxable income
- $9,802
- Est. tax owed @ 24.0%
- −$2,353
- After-tax cash flow
- $7,742/yr
For passive investors: Depreciation is non-cash, so a rental often shows a tax loss while cash-flowing — sheltering income. Rental losses are passive: they offset passive income freely, and up to $25,000/yr can offset ordinary (W-2) income if you actively participate and your MAGI is under $100k (phasing out to $0 by $150k); unused losses carry forward. On sale, claimed depreciation is recaptured at up to 25%, and gains may owe capital-gains tax (a 1031 exchange can defer both). Figures are a year-1 estimate at your 24.0% rate — not tax advice; consult a CPA.
Schools (NCES district)
- District
- Coeur D'Alene District
- NCES district ID
- 1600780
- Math proficiency
- 44% ▼ -6.00%
- Reading proficiency
- 60% ▼ -2.00%
- Median HH income
- $47,652
- Composite
- 44.16/100
- National rank
- #2858
- State rank
- #23 of 92 in ID
Livability — Coeur d'Alene
No livability data for this city. (Only ~50 U.S. cities are tracked.)
Census & demographics
- Census place
- Coeur d'Alene, ID
- County
- Kootenai County · 146,553 people
- City population
- 67,464
- Metro
- Coeur d'Alene, ID
- Population (ZIP)
- 41,405
- Household income
- $77,864
- Rent vs Own
- Severe rent burden
- 1036.0
Population outlook (Kootenai County) Hauer SSP2
- Today (2025)
- 177,692 people
- By 2030
- 190,689 · +7.3%
- By 2040
- 214,704 · +20.8%
- By 2050
- 236,510 · +33.1%
- By 2075
- 285,984 · +60.9%
- By 2100
- 316,459 · +78.1%
Race, ethnicity, and origin ACS 2023
- Neighborhood character
- Predominantly White (87%)
- Race & ethnicity
- White 87% Two or more races 6% Hispanic / Latino 4% Asian 1%
- Common ancestry
- Portuguese 4% Slovak 4% Iranian 3%
- Foreign-born
- 3% · Canada
- Languages at home
- 96% English-only · Spanish 3%
Political lean MEDSL · Kootenai
- 2024 margin
- Solid R (+51.9) · D 22.9% · R 74.8% · Other 2.2%
- 2008→2024 swing
- -25.6pp toward R · 2008: -26.3pp · 2024: -51.9pp
- All cycles
- 2024: R+51.9 2020: R+42.9 2016: R+42.5 2012: R+34.3 2008: R+26.3
Not yet ingested
- Civics
- —
Market trends
- HPI YoY
- ▼ -255.27%
- Current HPI
- 252.5165
- Rent YoY
- ▲ 4.20%
- Metro
- Coeur d'Alene, ID
- State GDP YoY
- ▲ 4.51%
- F500 in state
- 6
Industry mix (Fortune 500 HQ in ID)
| Industry | F500 HQs | Revenue |
|---|---|---|
| Retail | 1 | $79B |
|
||
| Technology | 1 | $25B |
|
||
| Food / Agriculture | 1 | $6B |
|
||
Price history
-13.3% since first listed2 events — show timeline
- 2026-04-12 Price Changed $64,999 CDAMLS
- 2026-02-19 Listed $74,999 CDAMLS
Cash-flow waterfall
monthlySold comps — $/sqft
last 12 mo · ≤1 miLoading sold comps…