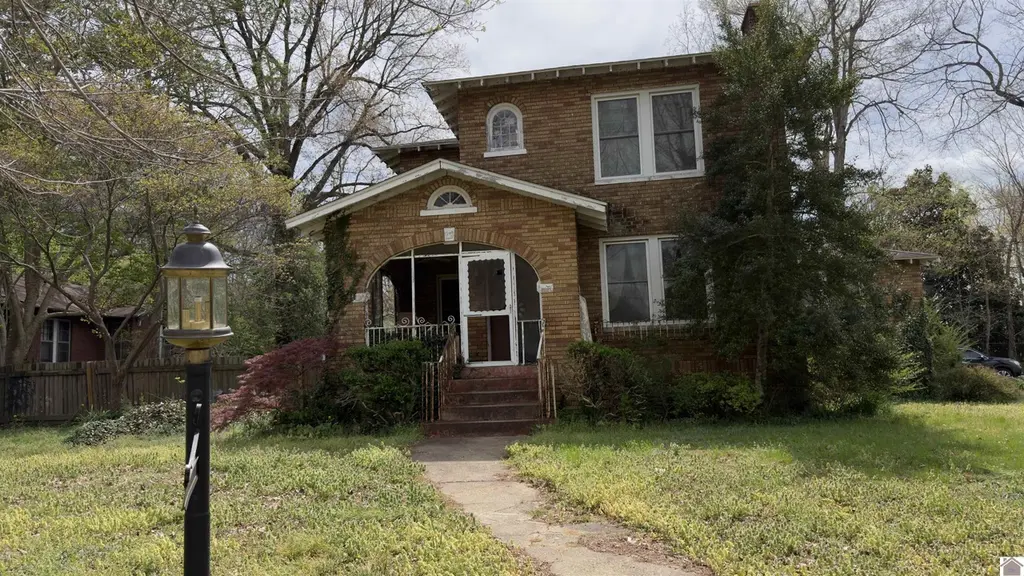
161 Cheatham St · Bardwell, KY
Flood risk 4/10 · Minor
- FEMA flood zone
- X (unshaded)
- Chance of flooding over 30 yrs
- 0.2%
- Est. flood insurance / yr
- $473 – $860
Fire risk 3/10 · Minor
- Est. fire insurance / yr
- $839 – $1,559
Heat risk 6/10 · Moderate
- Hot days now (above 108°F)
- 7 days/yr
- Hot days in 30 yrs
- 22 days/yr
Wind risk 3/10 · Minor
- Chance of severe wind over 30 yrs
- 7.0%
Air-quality risk 2/10 · Minimal
- Unhealthy air days now
- 0 days/yr
- Unhealthy air days in 30 yrs
- 1 days/yr
Risk factors via First Street. Map © Google.
Why this score? — see what drove the A- grade
The composite is a weighted blend of 9 inputs, each scored 0–100. Each bar is that input's sub-score; the figure is the points it added to the 100-point composite (weight × sub-score).
- Cash flow +27.5/30.0
- ARV discount +15.0/15.0
- DSCR +9.6/10.0
- Appreciation +9.3/10.0
- 1% rule +7.5/10.0
- Livability +3.2/5.0
- Schools +3.0/10.0
- Rent growth +2.5/5.0
- Condition / age +2.5/5.0
$92,000
🖨 Deal sheet 📄 Offer letter ✓ Due diligence
Listing remarks
Investor special full of character and potential! This 3-bedroom home offers the possibility of up to 5 bedrooms, making it a great value-add opportunity. Situated on a corner lot with beautiful mature trees, this property features a finished basement with exterior access, ideal for additional living space or rental potential. Charming brick exterior with a covered front porch, carport and partially fenced yard. With the right vision and updates, this property could truly shine! Perfect for investors or buyers looking to build equity.
Key facts
- Covered front porch
- Exterior access
- Carport
Tags
Property features AI
Exterior
- Parking: Carport (1 space)
- Security: Smoke detector(s)
- Utilities: Public water; Public sewer
- Home design: Single-family residence; 2 stories
- Construction: Frame construction; Shingle roof; Below-grade finished area; Below-grade finished area approx. 1,361
- Exterior features: Covered, screened patio/porch; Level, corner lot
Interior
- Kitchen: Dishwasher
- Flooring: Carpet; Laminate; Vinyl; Wood
- Bathrooms: 1 full bathroom; 1 half bathroom
- Heating & cooling: Forced air heating (natural gas); Central air; Window unit(s); Ceiling fan(s)
- Interior features: Walk-in closet(s); Insulated windows; Fireplace in living room; Basement partially finished with walk-out access
- Laundry & utility: Laundry in basement
Neighborhood map
What this means for you Summary
Snapshot
- This is a 3-bed/2.0-bath single-family listed at $92k.
Deal economics
- At list price, monthly cash flow is $271 ($3k/yr) — positive.
- The deal already cash-flows at list — no discount required.
- Meets the 1% rule at list price ($1k rent vs $92k).
- Recommended offer: $89k (3.0% below list) — sets the bar for market timing.
Location & tenants
- Location reads 64/100 on livability (#306 in KY) — a middle-class / working-renter tenant base. Strengths: crime A+, cost of living A+, housing A+; Watch: amenities F, commute F, employment D-.
- Carlisle County (rural): math 34% / reading 39% proficiency, ranked #59 of 165 in KY (top 36%) — families likely to look elsewhere, expect single-tenant / working-renter base with shorter leases.
- Zoned schools: Carlisle County Elementary School (math 42% / reading 42%, grade F, #178 of 676 statewide, top 29%, 409 students, 66% FRL); Carlisle County Middle School (math 27% / reading 42%, grade F, #99 of 217 statewide, top 47%, 146 students, 58% FRL); Carlisle County High School (math 24% / reading 34%, grade F, #127 of 254 statewide, top 58%, 204 students, 56% FRL).
- Market conditions: 10 active listings in the ZIP.
Forward outlook
- In year one you build about $9k of equity ($636 loan paydown + $8k appreciation (8.6% local appreciation)).
- Carlisle County population projected at -18% by 2050 — secular population decline; favor cash flow + early exit over multi-decade hold.
- At projected returns (8.6% appreciation + 3.0% rent growth), your $26k cash investment doubles in ~3 years — after that, you're playing with house money.
- By year 5, paydown + projected appreciation supports a ~$39k cash-out refi (75% LTV) — recoverable capital for the next deal without selling this one.
Negotiation context
- It's been on market 36 days — a 3% lower offer ($89k) is reasonable based on typical stale-listing flexibility.
Risks & watch-outs
- Watch-outs: built in 1927 — expect roof / HVAC / electrical / plumbing capex.
- Climate carrying-cost: extreme-heat days projected 7→22/yr by 2055 (HVAC capex compounding) — expect insurance premiums to compound above CPI over the hold.
Questions for the listing agent
- It's been on market 36 days. Have you received any prior offers? Is the seller open to a 3% concession, seller financing, or rate buy-down credit?
- Built in 1927 — when were the roof, HVAC, electrical panel, plumbing, and water heater last replaced?
- Is there a deadline driving the sale (1031 exchange, divorce, estate, relocation)? That informs how much negotiation room exists.
- Schools are D-rated, which usually means shorter tenancies and higher turnover. Who's the typical renter profile here, and what's been the actual vacancy rate?
- What's the average days-on-market for RENTAL listings here right now (not sales)? A rising rental-DOM trend means longer vacancies and softer asking-rent achievability than the comps imply.
- What's the recent tenant-quality profile in this submarket — average credit score on applications, eviction rate, late-payment / NSF rate, and stable-employment percentage? A property-management company in the area should have these aggregated.
- How much new for-sale + rental construction is in the pipeline within 1–3 miles? Heavy new supply typically softens prices + rents 12–24 months out; constrained supply supports both.
Investment metrics
- 1% rule
- 1.25% ✓
- Cap rate
- 9.83%
- Cash-on-cash
- 12.64%
- DSCR
- 1.56
- GRM
- 6.7
CMA / ARV
- ARV (on-the-fly)
- $166,296
- Comps found
- 3
Show comp detail 3 sales within ~0.75 mi
| Address | Dist | Beds/Ba | Sqft | Sold | Price | $/sf | Match |
|---|---|---|---|---|---|---|---|
| 419 Hillcrest Dr | 0.56mi | 3/2.0 | 2,060 (+2%) | 7mo | $168,000 | $82 | 65 |
| 130 Ashford St | 0.49mi | 2/1.0 (-1) | 2,000 (-1%) | 12mo | $120,000 | $60 | 55 |
| 147 Ky 1591 | 0.43mi | 3/3.0 | 2,236 (+10%) | 7mo | $299,000 | $134 | 53 |
Match score weights: distance 35% · size 25% · config 20% · recency 20%. Top-matched comps best support the ARV.
Projected returns pro-forma
8.58% appreciation · 3.0% rent growth · sell at horizon
- IRR
- 30.9%
- Equity multiple
- 3.28×
- Total profit
- $58,625
- Equity at exit
- $73,543
- IRR
- 27.3%
- Equity multiple
- 7.12×
- Total profit
- $157,555
- Equity at exit
- $149,607
Cash invested: $25,760 (down + closing). Projections, not guarantees.
Landlord ↔ Tenant lean methodology
- Overall (STATE)
- 83 Strongly Landlord-Friendly
- State Kentucky
- 83 Strongly Landlord-Friendly · R+16
- County
- — inherits STATE
- City
- — inherits STATE
ZIP-level market 42023
- Home prices YoY
- 4.1%
- Active inventory
- 10
- Price-to-rent
- 6.7×
Monthly cashflow live
- Estimated rent
- $1,148 medium interval (Pro) →
- Mortgage (P&I)
- −$482
- Tax est. 1.5%
- −$115 /mo · $1,380/yr
- Insurance
- −$38
- HOA
- −$0
- Vacancy / Maint / Mgmt
- −$241
- Net cashflow
- $271
Break-even live
UW: 25.0% down · 7.5% · 30yr · 1.5% tax · 5.0% vac · 8.0% maint · 8.0% mgmt
Financing live
Cash to close
- Down payment
- $23,000
- Closing costs
- $2,760
- Reserves months
- —
- Total cash needed
- —
Loan-product check · same deal, 3 products live
Conventional
25% down · 7.5% · 30yr
- Down + closing
- —
- Monthly P&I
- —
- Monthly cashflow
- —
- DSCR
- —
- Eligible?
- —
Personal DTI + credit; lowest rate.
DSCR
20% down · 8.5% · 30yr
- Down + closing
- —
- Monthly P&I
- —
- Monthly cashflow
- —
- DSCR
- —
- Eligible?
- —
No personal income docs; deal must DSCR.
Hard money
10% down · 12.0% · 12mo
- Down + closing
- —
- Monthly P&I
- —
- Monthly cashflow
- —
- DSCR
- —
- Eligible?
- —
Short-term bridge; refi at stabilization.
Listing history 17 events
-
2026-06-19days on market $92,000 Active 36 DOM
-
2026-06-18days on market $92,000 Active 35 DOM
-
2026-06-17days on market $92,000 Active 34 DOM
-
2026-06-16days on market $92,000 Active 33 DOM
-
2026-06-15days on market $92,000 Active 32 DOM
-
2026-06-14days on market $92,000 Active 30 DOM
-
2026-06-12days on market $92,000 Active 29 DOM
-
2026-06-09days on market $92,000 Active 26 DOM
-
2026-06-08days on market $92,000 Active 25 DOM
-
2026-06-07days on market $92,000 Active 24 DOM
-
2026-06-05days on market $92,000 Active 21 DOM
-
2026-06-03days on market $92,000 Active 20 DOM
-
2026-06-02days on market $92,000 Active 19 DOM
-
2026-06-01days on market $92,000 Active 18 DOM
-
2026-05-31days on market $92,000 Active 17 DOM
-
2026-05-30days on market $92,000 Active 16 DOM
-
2026-05-14$92,000 Active
ⓘ Source: listings_history table (triggers on properties + properties_extension) + one-shot
backfill from property_details.listing_events for pre-trigger history.
Climate risk First Street
- Flood 4/10 Moderate FEMA zone X (unshaded) · 20% chance over 30 yrs
- Wildfire 3/10 Moderate
- Heat 6/10 Major 7 d/yr ≥108°F today · 22 d/yr by 30 yrs out
- Wind 3/10 Moderate 7% chance of damaging wind over 30 yrs
- Air quality 2/10 Low 0 unhealthy d/yr today · 1 by 30 yrs out
Nearby sold comps map
Loading sold comps map…
Walkable amenities ~0.75 mi
Loading nearby amenities…
Taxation est. · year 1
- Rental income
- $13,779
- − Mortgage interest
- −$5,153
- − Property taxes
- −$1,380
- − Insurance
- −$460
- − Repairs & maintenance
- −$1,102
- − Management
- −$1,102
- − Depreciation
- −$2,676
- Taxable income
- $1,904
- Est. tax owed @ 24.0%
- −$457
- After-tax cash flow
- $2,799/yr
For passive investors: Depreciation is non-cash, so a rental often shows a tax loss while cash-flowing — sheltering income. Rental losses are passive: they offset passive income freely, and up to $25,000/yr can offset ordinary (W-2) income if you actively participate and your MAGI is under $100k (phasing out to $0 by $150k); unused losses carry forward. On sale, claimed depreciation is recaptured at up to 25%, and gains may owe capital-gains tax (a 1031 exchange can defer both). Figures are a year-1 estimate at your 24.0% rate — not tax advice; consult a CPA.
Schools (NCES district)
- District
- Carlisle County
- NCES district ID
- 2100960
- Math proficiency
- 34% ▼ -8.00%
- Reading proficiency
- 39% ▼ -14.00%
- Median HH income
- $37,978
- Composite
- 30.43/100
- National rank
- #6236
- State rank
- #59 of 165 in KY
Livability — Bardwell
- Score
- 64/100
- State rank
- #306
- US rank
- #14557
Category grades
Schools grade is shown separately in the Schools card above.
Census & demographics
- Census place
- Bardwell, KY
- Population (ZIP)
- 2,572
Population outlook (Carlisle County) Hauer SSP2
- Today (2025)
- 4,537 people
- By 2030
- 4,341 · -4.3%
- By 2040
- 4,003 · -11.8%
- By 2050
- 3,736 · -17.7%
- By 2075
- 3,405 · -25.0%
- By 2100
- 3,264 · -28.1%
Race, ethnicity, and origin ACS 2023
- Neighborhood character
- Predominantly White (92%)
- Race & ethnicity
- White 92% Two or more races 5% Black 1%
- Common ancestry
- Italian 2% Iranian 2% Lithuanian 2%
- Foreign-born
- 1%
- Languages at home
- 99% English-only · French/Haitian/Cajun 1%
Political lean MEDSL · Carlisle
- 2024 margin
- Solid R (+68.0) · D 15.6% · R 83.6%
- 2008→2024 swing
- -36.6pp toward R · 2008: -31.3pp · 2024: -68.0pp
- All cycles
- 2024: R+68.0 2020: R+64.3 2016: R+64.0 2012: R+41.4 2008: R+31.3
Not yet ingested
- Civics
- —
Market trends
- HPI YoY
- ▲ 8.58%
- Current HPI
- 216.2089
- Rent YoY
- —
- Metro
- —
- State GDP YoY
- ▲ 1.81%
- F500 in state
- 4
Industry mix (Fortune 500 HQ in KY)
| Industry | F500 HQs | Revenue |
|---|---|---|
| Healthcare | 1 | $118B |
|
||
| Food / Beverage | 1 | $7B |
|
||
Price history
1 event — show timeline
- 2026-05-14 Listed $92,000 WKRMLS
Property tax history
-21.3%/yrLatest (2024): $24 · -0.0% YoY. Source: county tax records.
Cash-flow waterfall
monthlySold comps — $/sqft
last 12 mo · ≤1 miLoading sold comps…