 Duplex
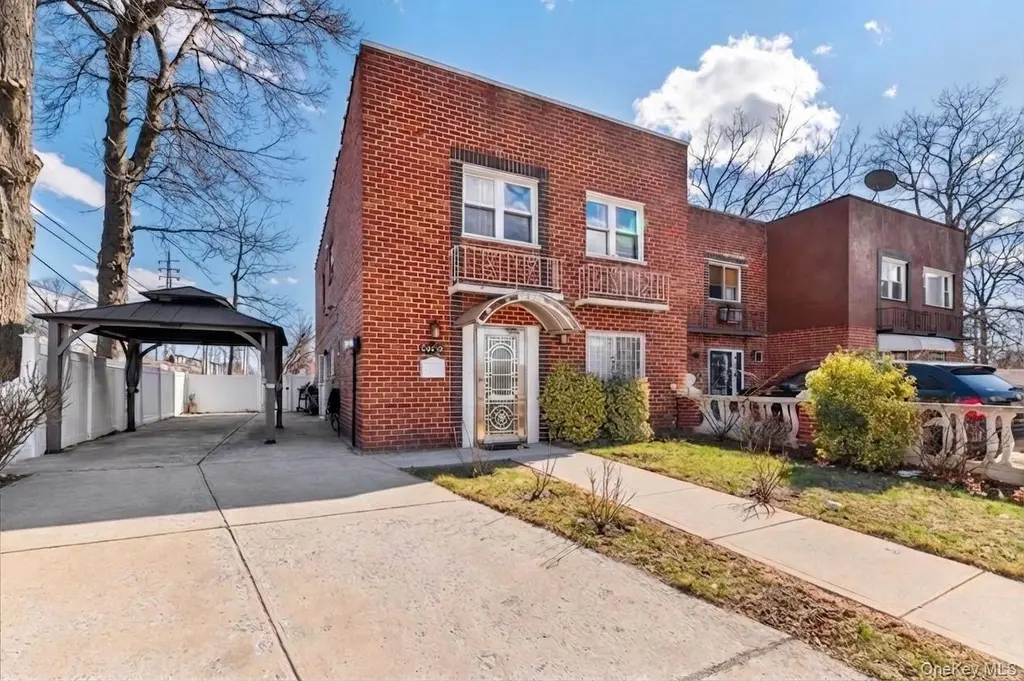
218-52 138th Rd · New York, NY
Flood risk 1/10 · Minimal
- FEMA flood zone
- X (unshaded)
- Chance of flooding over 30 yrs
- 0.0%
- Est. flood insurance / yr
- $507 – $1,088
Fire risk 1/10 · Minimal
- Est. fire insurance / yr
- $691 – $1,283
Heat risk 6/10 · Moderate
- Hot days now (above 97°F)
- 7 days/yr
- Hot days in 30 yrs
- 15 days/yr
Wind risk 6/10 · Moderate
- Chance of severe wind over 30 yrs
- 72.0%
Air-quality risk 4/10 · Minor
- Unhealthy air days now
- 6 days/yr
- Unhealthy air days in 30 yrs
- 6 days/yr
Risk factors via First Street. Map © Google.
Why this score? — see what drove the D+ grade
The composite is a weighted blend of 9 inputs, each scored 0–100. Each bar is that input's sub-score; the figure is the points it added to the 100-point composite (weight × sub-score).
- ARV discount +15.0/15.0
- Cash flow +13.2/30.0
- Schools +5.0/10.0
- DSCR +4.0/10.0
- Livability +3.8/5.0
- 1% rule +3.1/10.0
- Rent growth +2.5/5.0
- Condition / age +2.5/5.0
- Appreciation +0.0/10.0
$899,000
🖨 Deal sheet (PDF) 📄 Offer letter ✓ Due diligence
Multi-family units
County records classify this as Multi-Family (2-4 Unit). Listing-text estimate: 2 units. confirmed
Listing remarks
Spacious legal 2-family home situated on a desirable corner lot on a quiet dead-end street. This property features a private, fully fenced backyard along with a separate side yard, offering excellent outdoor space and added privacy. The first-floor unit offers 2 bedrooms, 2 full bathrooms, a living room, an eat-in kitchen, and an extra-large family room with two separate entrances for added convenience and flexibility. The second-floor unit features 3 bedrooms, 1 full bathroom, a living room, and a dining room. Additional highlights include two gas meters, a new roof, new boiler, and new water heater. Property is tenant-occupied—drive-by only, no interior access. Tenants are currently
Key facts
- Legal 2-family home
- Separate side yard
- Corner lot
Tags
Property features AI
Exterior
- Parking: Driveway
- Utilities: Public sewer; Trash collection (public)
- Home design: Duplex
- Construction: Brick construction
- Exterior features: Brick exterior; Not waterfront
Interior
- Bedrooms: Two 3-bedroom units
- Bathrooms: Three full bathrooms
- Heating & cooling: Hot water heating (natural gas); Wall/window air conditioning units
- Interior features: First-floor bedroom; First-floor full bathroom
Neighborhood map
What this means for you Summary
Snapshot
- This is a 2 × 3-bed/1.5-bath units multifamily listed at $899k.
Deal economics
- At list price, monthly cash flow is $-9 ($-102/yr) — negative. Per door: $-4/mo.
- To cash-flow at today's rent, offer at most $897k (0.2% below list).
- To meet the 1% rule (rent ≥ 1% of price), the offer needs to be $727k (19.2% below list).
- Recommended offer: $727k (19.2% below list) — sets the bar for 1% rule.
- Cap rate 6.3% vs local median 2.6% in New York — top-decile yield for the area; either an underpriced asset or a hidden risk that comps aren't pricing in. Stress-test before assuming the spread holds.
Location & tenants
- Location reads 75/100 on livability (#268 in NY, #4,188 nationally) — a middle-class / working-renter tenant base. Strengths: amenities A+, commute A+, health & safety A; Watch: crime F, cost of living F.
- Zoned schools: Elm Tree Elementary School (math 27% / reading 52%, grade F, #1,444 of 2,108 statewide, top 71%, 806 students, 94% FRL); Is 227 Louis Armstrong (math 52% / reading 69%, grade B+, #153 of 729 statewide, top 21%, 1,528 students, 68% FRL); Midwood High School (math 94% / reading 96%, grade A+, #83 of 1,100 statewide, top 8%, 4,062 students, 73% FRL).
- Market conditions: 197 active listings in the ZIP; 5,302 units permitted in Queens County in 2024 (4,918 in 5+ unit buildings).
Forward outlook
- Local home prices are declining (-3.0%/yr); year-one equity from $6k of loan paydown is wiped out by about $27k of value loss. Plan a longer hold.
- Queens County population projected at +16% by 2050 — long-run rental-demand tailwind backs the buy-and-hold thesis.
Negotiation context
- It's been on market 77 days — a 6% lower offer ($845k) is reasonable based on typical stale-listing flexibility.
- 4 sale attempts since 14y ago with the ask held roughly flat each time — persistent listings suggest the price (not the market) is what's stuck; bring a comps-based counter.
- Current owner paid $450k; list at $899k implies a 100% gain — meaningful room to come down on a strong offer.
Risks & watch-outs
- Climate carrying-cost: major wind risk, 72% chance of damaging wind over 30y; extreme-heat days projected 7→15/yr by 2055 (HVAC capex compounding) — expect insurance premiums to compound above CPI over the hold.
Questions for the listing agent
- What do current leases actually rent for vs. the listed asking? Can we see a recent rent roll and the last 12 months of T-12 income?
- It's been on market 77 days. Have you received any prior offers? Is the seller open to a 19% concession, seller financing, or rate buy-down credit?
- Can we see the unit-by-unit rent roll, current vacancy, and any below-market leases? What's the average tenancy length?
- What capital expenditures (roof, boiler, parking lot, exteriors) have been made in the last 5 years, and what's planned in the next 2?
- Built in 1965 — when were the roof, HVAC, electrical panel, plumbing, and water heater last replaced?
- Why hasn't it sold? Are there any deal-killer items the seller is aware of (foundation, flood, title, zoning, code violations)?
- Is there a deadline driving the sale (1031 exchange, divorce, estate, relocation)? That informs how much negotiation room exists.
- Schools are B-rated — typically a magnet for longer-tenancy family renters. What's the average tenant stay here, and is there a school-zone premium baked into asking?
- Crime grade is F in this area — have there been break-ins, vandalism, or insurance claims at this property in the last 3 years? What carrier currently insures it and at what premium?
- The area grade is low — what's the realistic commute time and amenity access for the typical tenant pool here? Any planned neighborhood developments (good or bad) we should know about?
- What's the average days-on-market for RENTAL listings here right now (not sales)? A rising rental-DOM trend means longer vacancies and softer asking-rent achievability than the comps imply.
- What's the recent tenant-quality profile in this submarket — average credit score on applications, eviction rate, late-payment / NSF rate, and stable-employment percentage? A property-management company in the area should have these aggregated.
- How much new apartment / multifamily construction is in the pipeline within 1–3 miles? Heavy new supply (>2% of stock underway) typically softens rents 12–24 months out; light construction supports rent growth.
Investment metrics
- 1% rule
- 0.81% ✗
- Cap rate
- 6.28%
- Cash-on-cash
- -0.04%
- DSCR
- 1.00
- GRM
- 10.3
CMA / ARV
- ARV (on-the-fly)
- $1,100,352
- Comps found
- 9
Show comp detail 9 sales within ~0.75 mi
| Address | Dist | Beds/Ba | Sqft | Sold | Price | $/sf | Match |
|---|---|---|---|---|---|---|---|
| 179-12 145 Ave | 0.38mi | 6/3.0 | 2,080 (-2%) | 2mo | $1,120,000 | $538 | 78 |
| 17808 137th Ave | 0.36mi | 6/5.0 | 2,124 (+1%) | 2mo | $970,000 | $457 | 73 |
| 14027 Coombs St | 0.21mi | 7/3.0 (+1) | 1,932 (-8%) | 2mo | $999,000 | $517 | 69 |
| 13526 219th St | 0.29mi | 6/— | 2,340 (+11%) | 2mo | $772,500 | $330 | 67 |
| 14411 223rd St | 0.59mi | 6/5.0 | 2,271 (+8%) | 0mo | $1,295,000 | $570 | 52 |
| 22820 Edgewood Ave | 0.64mi | 6/5.0 | 2,208 (+4%) | 7mo | $1,150,000 | $521 | 49 |
| 13012 178th St | 0.68mi | 6/4.0 | 2,352 (+11%) | 6mo | $1,250,000 | $531 | 40 |
| 181-36 144th Ave | 0.58mi | 6/2.0 | 2,328 (+10%) | 22mo | $842,650 | $362 | 34 |
| 130-16 178th St | 0.68mi | 6/5.0 | 2,400 (+14%) | 23mo | $1,330,000 | $554 | 19 |
Match score weights: distance 35% · size 25% · config 20% · recency 20%. Top-matched comps best support the ARV.
Projected returns pro-forma
-3.0% appreciation · 3.0% rent growth · sell at horizon
- IRR
- -16.4%
- Equity multiple
- 0.42×
- Total profit
- $-146,394
- Equity at exit
- $134,044
- IRR
- -8.2%
- Equity multiple
- 0.49×
- Total profit
- $-128,886
- Equity at exit
- $77,729
Cash invested: $251,720 (down + closing). Projections, not guarantees.
Landlord ↔ Tenant lean methodology
- Overall (CITY)
- 0 Strongly Tenant-Friendly
- State New York
- 15 Strongly Tenant-Friendly · D+10
- County
- — inherits STATE
- City New York
- 0 Strongly Tenant-Friendly · D+34
ZIP-level market 11413
- Active inventory
- 197
- Price-to-rent
- 20.6×
Monthly cashflow live
- Estimated rent
- $7,268 high interval (Pro) →
- Mortgage (P&I)
- −$4,714
- Tax from tax record
- −$661 /mo · $7,935/yr
- Insurance
- −$375
- HOA
- −$0
- Vacancy / Maint / Mgmt
- −$1,526
- Net cashflow
- $-9
Break-even live
Sensitivity live
| Price | -10% $500 | -5% $246 | +0% $-9 | +5% $-263 | +10% $-517 |
|---|---|---|---|---|---|
| Rent | -10% $-583 | -5% $-296 | +0% $-9 | +5% $279 | +10% $566 |
| Rate | -1.0pp $444 | -0.5pp $220 | base $-9 | +0.5pp $-241 | +1.0pp $-478 |
2-unit breakdown (identical units grouped — click to expand)
| Units | Beds | Baths | Est. rent |
|---|---|---|---|
| 2× units | 3 | 1.5 | $7,268 |
| #1 | 3 | 1.5 | $3,634 |
| #2 | 3 | 1.5 | $3,634 |
| Total (2 units) | $7,268 | ||
UW: 25.0% down · 7.5% · 30yr · 1.5% tax · 5.0% vac · 8.0% maint · 8.0% mgmt
Financing live
Cash to close
- Down payment
- $224,750
- Closing costs
- $26,970
- Reserves months
- —
- Total cash needed
- —
Loan-product check · same deal, 3 products live
Conventional
25% down · 7.5% · 30yr
- Down + closing
- —
- Monthly P&I
- —
- Monthly cashflow
- —
- DSCR
- —
- Eligible?
- —
Personal DTI + credit; lowest rate.
DSCR
20% down · 8.5% · 30yr
- Down + closing
- —
- Monthly P&I
- —
- Monthly cashflow
- —
- DSCR
- —
- Eligible?
- —
No personal income docs; deal must DSCR.
Hard money
10% down · 12.0% · 12mo
- Down + closing
- —
- Monthly P&I
- —
- Monthly cashflow
- —
- DSCR
- —
- Eligible?
- —
Short-term bridge; refi at stabilization.
Listing history 18 events
-
2026-06-15days on market $899,000 Active 77 DOM
-
2026-06-13days on market $899,000 Active 75 DOM
-
2026-06-10days on market $899,000 Active 71 DOM
-
2026-06-08days on market $899,000 Active 70 DOM
-
2026-06-08days on market $899,000 Active 69 DOM
-
2026-06-04days on market $899,000 Active 66 DOM
-
2026-06-03days on market $899,000 Active 65 DOM
-
2026-06-01days on market $899,000 Active 63 DOM
-
2026-05-31days on market $899,000 Active 62 DOM
-
2026-03-30$899,000 Active
-
2024-05-03price $880,000
-
2024-03-18$925,000 Active
-
2024-02-01historical $2,800
-
2024-01-08$2,800
-
2014-01-31historical
-
2012-11-20$350,000
-
2008-11-26soldstatus $450,000
-
1996-04-01soldstatus $179,000
ⓘ Source: listings_history table (triggers on properties + properties_extension) + one-shot
backfill from property_details.listing_events for pre-trigger history.
Tax reassessment forecast NY · Partial reset (capped growth)
- Current annual tax
- $7,935 · $661/mo
- Projected year-2 tax
- $11,564 · $964/mo
- Expected delta
- +$3,629/yr (+$302/mo · 45.7%)
ⓘ Screening estimate from a state-policy table — verify with the county assessor before closing.
Climate risk First Street
- Flood 1/10 Low FEMA zone X (unshaded) · 0% chance over 30 yrs
- Wildfire 1/10 Low
- Heat 6/10 Major 7 d/yr ≥97°F today · 15 d/yr by 30 yrs out
- Wind 6/10 Major 72% chance of damaging wind over 30 yrs
- Air quality 4/10 Moderate 6 unhealthy d/yr today · 6 by 30 yrs out
Nearby sold comps map
Loading sold comps map…
Walkable amenities ~0.75 mi
Loading nearby amenities…
Taxation est. · year 1
- Rental income
- $87,216
- − Mortgage interest
- −$50,358
- − Property taxes
- −$7,935
- − Insurance
- −$4,495
- − Repairs & maintenance
- −$6,977
- − Management
- −$6,977
- − Depreciation
- −$26,153
- Taxable loss
- −$15,679
- Est. tax savings @ 24.0%
- +$3,763
- After-tax cash flow
- $3,661/yr
For passive investors: Depreciation is non-cash, so a rental often shows a tax loss while cash-flowing — sheltering income. Rental losses are passive: they offset passive income freely, and up to $25,000/yr can offset ordinary (W-2) income if you actively participate and your MAGI is under $100k (phasing out to $0 by $150k); unused losses carry forward. On sale, claimed depreciation is recaptured at up to 25%, and gains may owe capital-gains tax (a 1031 exchange can defer both). Figures are a year-1 estimate at your 24.0% rate — not tax advice; consult a CPA.
Schools (NCES district)
No district data.
Livability — New York
- Score
- 75/100
- State rank
- #268
- US rank
- #4188
Category grades
Schools grade is shown separately in the Schools card above.
Census & demographics
- Census place
- New York, NY
- City population
- 7,731,280
- Population (ZIP)
- 45,072
Population outlook (Queens County) Hauer SSP2
- Today (2025)
- 2,546,320 people
- By 2030
- 2,643,059 · +3.8%
- By 2040
- 2,815,563 · +10.6%
- By 2050
- 2,944,423 · +15.6%
- By 2075
- 3,123,338 · +22.7%
- By 2100
- 3,098,688 · +21.7%
Race, ethnicity, and origin ACS 2023
- Neighborhood character
- Predominantly Black (84%)
- Race & ethnicity
- Black 84% Hispanic / Latino 9% Two or more races 4% Asian 2% White 1%
- Hispanic origin (detail)
- Puerto Rican 3% Dominican 3%
- Common ancestry
- Hispanic 6%
- Foreign-born
- 39% · Canada, Mexico
- Languages at home
- 84% English-only · French/Haitian/Cajun 7% Spanish 6% Other Indo-European 1%
Political lean MEDSL · Queens
- 2024 margin
- Strong D (+24.6) · D 62.3% · R 37.7%
- 2008→2024 swing
- -26.2pp toward R · 2008: 50.8pp · 2024: 24.6pp
- All cycles
- 2024: D+24.6 2020: D+45.2 2016: D+53.4 2012: D+58.5 2008: D+50.8
Not yet ingested
- Civics
- —
Market trends
- HPI YoY
- ▼ -390.89%
- Current HPI
- 311.5327
- Rent YoY
- —
- Metro
- —
- State GDP YoY
- ▲ 2.60%
- F500 in state
- 92
Industry mix (Fortune 500 HQ in NY)
| Industry | F500 HQs | Revenue |
|---|---|---|
| Financial Services | 10 | $950B |
|
||
| Consumer Goods | 9 | $162B |
|
||
| Insurance | 4 | $225B |
|
||
| Telecommunications | 2 | $144B |
|
||
| Pharmaceuticals | 2 | $112B |
|
||
| Media / Entertainment | 2 | $69B |
|
||
Price history
+402.2% since first listed9 events — show timeline
- 2026-03-30 Listed $899,000 OneKey® MLS as Distributed by MLS Grid
- 2024-05-03 Price Changed $880,000 OneKey® MLS as Distributed by MLS Grid
- 2024-03-18 Listed $925,000 OneKey® MLS as Distributed by MLS Grid
- 2024-02-01 Rental Removed $2,800 ONEKEY
- 2024-01-08 Listed for Rent $2,800 ONEKEY
- 2014-01-31 Listing Removed — OneKey® MLS as Distributed by MLS Grid
- 2012-11-20 Listed $350,000 OneKey® MLS as Distributed by MLS Grid
- 2008-11-26 Sold (Public Records) $450,000 Public Records
- 1996-04-01 Sold (Public Records) $179,000 Public Records
Property tax history
+4.8%/yrLatest (2025): $7,935 · +3.4% YoY. Source: county tax records.
Cash-flow waterfall
monthlySold comps — $/sqft
last 12 mo · ≤1 miLoading sold comps…