3815 Draper Pl · Lawrence Park, PA
Flood risk 1/10 · Minimal
- FEMA flood zone
- X (unshaded)
- Chance of flooding over 30 yrs
- 0.0%
- Est. flood insurance / yr
- $473 – $860
Fire risk 1/10 · Minimal
- Est. fire insurance / yr
- $511 – $949
Heat risk 3/10 · Minor
- Hot days now (above 91°F)
- 7 days/yr
- Hot days in 30 yrs
- 18 days/yr
Wind risk 1/10 · Minimal
- Chance of severe wind over 30 yrs
- —
Air-quality risk 3/10 · Minor
- Unhealthy air days now
- 4 days/yr
- Unhealthy air days in 30 yrs
- 4 days/yr
Risk factors via First Street. Map © Google.
Why this score? — see what drove the B- grade
The composite is a weighted blend of 9 inputs, each scored 0–100. Each bar is that input's sub-score; the figure is the points it added to the 100-point composite (weight × sub-score).
- Cash flow +22.6/30.0
- ARV discount +15.0/15.0
- 1% rule +7.8/10.0
- DSCR +7.2/10.0
- Livability +4.2/5.0
- Schools +4.0/10.0
- Rent growth +2.5/5.0
- Condition / age +2.5/5.0
- Appreciation +0.0/10.0
$87,999
🖨 Deal sheet 📄 Offer letter ✓ Due diligence
Listing remarks MLS
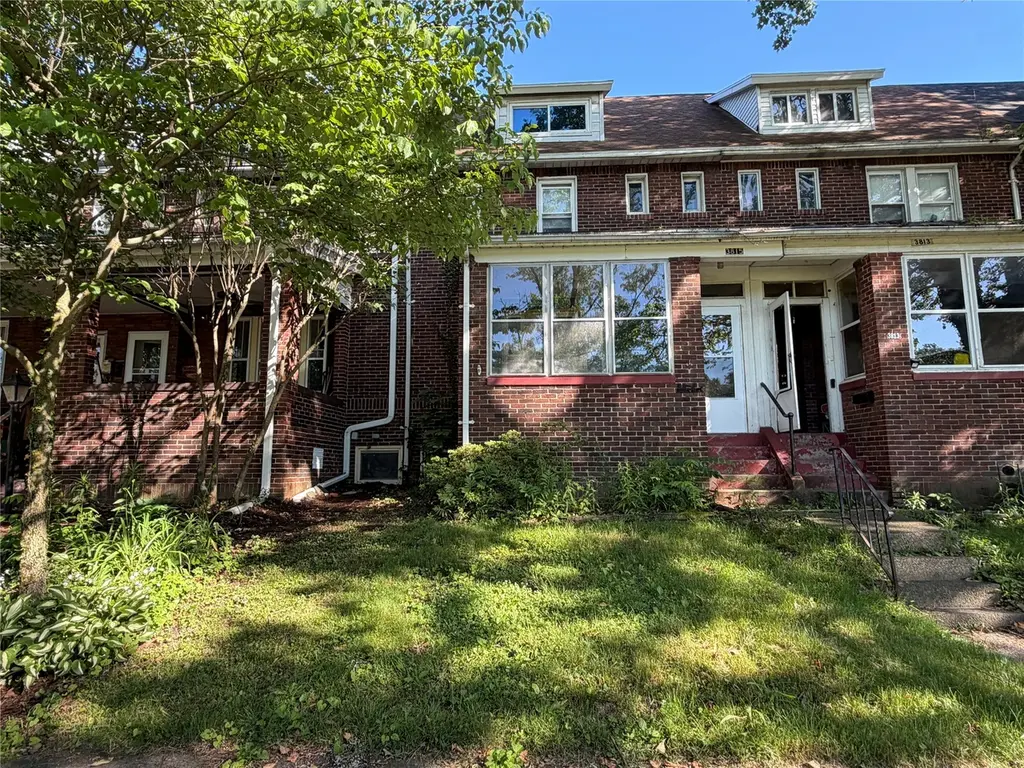
Brick row home offering 4 bedrooms and 1 full bath in a convenient location near Iroquois Schools. This property features an enclosed front porch filled with natural light, spacious living areas, and a fenced backyard perfect for gardening, pets, or outdoor entertaining. The classic brick exterior and mature shade trees provide timeless curb appeal. With a few updates, this home presents an excellent opportunity for affordable housing for buyers or investors looking to build equity and make it their own. Property is being sold AS-IS, however there is a one year HSA home warranty that comes with the home. Don’t miss the chance to bring your vision to this home that is full of potential!
Key facts
- Mature shade trees
- Fenced backyard
- Enclosed front porch
Tags
Property features AI
Finance
- Financial info: Annual property tax listed (financial details provided separately)
Exterior
- Utilities: Public water; Public sewer
- Home design: Single-family residence; Residential property
- Construction: Brick construction; Composition roof; Home warranty included; Built area 988 (listed)
- Exterior features: Enclosed porch; Porch; Level lot
Interior
- Kitchen: Gas oven; Gas range; Refrigerator
- Bedrooms: Total of 10 rooms (bedroom count not specified)
- Flooring: Carpet; Vinyl
- Bathrooms: 1 full bathroom
- Heating & cooling: Forced air heating; No central cooling
- Interior features: Gas oven, gas range, and refrigerator included; Full basement
Neighborhood map
What this means for you Summary
Snapshot
- This is a 2-bed/1.0-bath single-family listed at $88k.
Deal economics
- At list price, monthly cash flow is $150 ($2k/yr) — positive.
- The deal already cash-flows at list — no discount required.
- Meets the 1% rule at list price ($1k rent vs $88k).
Location & tenants
- Location reads 84/100 on livability (#85 in PA, #632 nationally) — a professional / high-income tenant draw. Strengths: commute A+, cost of living A+, housing A+.
- Iroquois SD (suburban): math 39% / reading 55% proficiency, ranked #236 of 539 in PA (top 44%) — families likely to look elsewhere, expect single-tenant / working-renter base with shorter leases.
- Market conditions: 48 active listings in the ZIP; 2 comparable units currently listed for rent nearby; 364 units permitted in Erie County in 2024 (188 in 5+ unit buildings).
Forward outlook
- Local home prices are declining (-3.0%/yr); year-one equity from $608 of loan paydown is wiped out by about $3k of value loss. Plan a longer hold.
- Erie County population projected at -14% by 2050 — secular population decline; favor cash flow + early exit over multi-decade hold.
Negotiation context
- Only 2 days on market — expect competitive offers; lowballing is unlikely to land.
- 2 sale attempts with the ask held roughly flat each time — persistent listings suggest the price (not the market) is what's stuck; bring a comps-based counter.
- Current owner paid $48k; list at $88k implies a 85% gain — meaningful room to come down on a strong offer.
Risks & watch-outs
- Watch-outs: property tax is 3.3% of price; built in 1930 — expect roof / HVAC / electrical / plumbing capex.
Questions for the listing agent
- Built in 1930 — when were the roof, HVAC, electrical panel, plumbing, and water heater last replaced?
- Property tax is high relative to price — has the assessment been appealed recently, and will the sale trigger a re-assessment?
- Is there a deadline driving the sale (1031 exchange, divorce, estate, relocation)? That informs how much negotiation room exists.
- What's the average days-on-market for RENTAL listings here right now (not sales)? A rising rental-DOM trend means longer vacancies and softer asking-rent achievability than the comps imply.
- What's the recent tenant-quality profile in this submarket — average credit score on applications, eviction rate, late-payment / NSF rate, and stable-employment percentage? A property-management company in the area should have these aggregated.
- How much new for-sale + rental construction is in the pipeline within 1–3 miles? Heavy new supply typically softens prices + rents 12–24 months out; constrained supply supports both.
Investment metrics
- 1% rule
- 1.28% ✓
- Cap rate
- 8.34%
- Cash-on-cash
- 7.30%
- DSCR
- 1.32
- GRM
- 6.5
CMA / ARV
- ARV (on-the-fly)
- $159,068
- Comps found
- 12
Show comp detail 12 sales within ~0.75 mi
| Address | Dist | Beds/Ba | Sqft | Sold | Price | $/sf | Match |
|---|---|---|---|---|---|---|---|
| 3721 Emmet Dr | 0.21mi | 2/1.0 | 986 (-0%) | 10mo | $212,000 | $215 | 82 |
| 3622 Main St | 0.14mi | 3/1.0 (+1) | 1,030 (+4%) | 6mo | $131,000 | $127 | 77 |
| 735 Napier Ave | 0.14mi | 2/1.0 | 1,092 (+10%) | 10mo | $90,000 | $82 | 67 |
| 1203 Smithson Ave | 0.36mi | 2/1.0 | 906 (-8%) | 12mo | $146,000 | $161 | 59 |
| 719 Smithson Ave | 0.21mi | 3/1.0 (+1) | 1,087 (+10%) | 12mo | $83,000 | $76 | 58 |
| 4434 Emmett Dr | 0.63mi | 3/1.0 (+1) | 1,008 (+2%) | 8mo | $195,000 | $193 | 55 |
| 640 Crotty Dr | 0.32mi | 3/1.0 (+1) | 1,094 (+11%) | 9mo | $203,000 | $186 | 55 |
| 4031 Bell St | 0.39mi | 2/1.0 | 864 (-13%) | 8mo | $94,000 | $109 | 54 |
| 1837 Kay Gie Way | 0.57mi | 3/1.0 (+1) | 924 (-6%) | 5mo | $10,200 | $11 | 53 |
| 415 Putnam Dr | 0.75mi | 3/1.0 (+1) | 1,040 (+5%) | 2mo | $192,500 | $185 | 50 |
| 843 Burkhart Ave | 0.47mi | 3/1.0 (+1) | 1,060 (+7%) | 14mo | $225,000 | $212 | 49 |
| 1668 Center St | 0.61mi | 2/1.0 | 864 (-13%) | 10mo | $76,000 | $88 | 42 |
Match score weights: distance 35% · size 25% · config 20% · recency 20%. Top-matched comps best support the ARV.
Projected returns pro-forma
-3.0% appreciation · 3.0% rent growth · sell at horizon
- IRR
- -5.0%
- Equity multiple
- 0.81×
- Total profit
- $-4,614
- Equity at exit
- $13,121
- IRR
- 4.8%
- Equity multiple
- 1.35×
- Total profit
- $8,670
- Equity at exit
- $7,609
Cash invested: $24,640 (down + closing). Projections, not guarantees.
Landlord ↔ Tenant lean methodology
- Overall (STATE)
- 62 Landlord-Friendly
- State Pennsylvania
- 62 Landlord-Friendly · EVEN
- County
- — inherits STATE
- City
- — inherits STATE
ZIP-level market 16511
- Home prices YoY
- -24.9%
- Active inventory
- 48
- Price-to-rent
- 6.5×
Monthly cashflow live
- Estimated rent
- $1,123 medium interval (Pro) →
- Mortgage (P&I)
- −$461
- Tax from tax record
- −$239 /mo · $2,869/yr
- Insurance
- −$37
- HOA
- −$0
- Vacancy / Maint / Mgmt
- −$236
- Net cashflow
- $150
Break-even live
UW: 25.0% down · 7.5% · 30yr · 1.5% tax · 5.0% vac · 8.0% maint · 8.0% mgmt
Financing live
Cash to close
- Down payment
- $22,000
- Closing costs
- $2,640
- Reserves months
- —
- Total cash needed
- —
Loan-product check · same deal, 3 products live
Conventional
25% down · 7.5% · 30yr
- Down + closing
- —
- Monthly P&I
- —
- Monthly cashflow
- —
- DSCR
- —
- Eligible?
- —
Personal DTI + credit; lowest rate.
DSCR
20% down · 8.5% · 30yr
- Down + closing
- —
- Monthly P&I
- —
- Monthly cashflow
- —
- DSCR
- —
- Eligible?
- —
No personal income docs; deal must DSCR.
Hard money
10% down · 12.0% · 12mo
- Down + closing
- —
- Monthly P&I
- —
- Monthly cashflow
- —
- DSCR
- —
- Eligible?
- —
Short-term bridge; refi at stabilization.
Rent comps 2 comps
| Address | Beds | Baths | Sqft | Rent | $/sqft | DOM | Units | Dist |
|---|---|---|---|---|---|---|---|---|
| 1205 Priestley Ave Erie, PA | 3.0 | 1.0 | 1000 | $950 | $0.95 | 43d | 1 | 0.28mi |
| 4400 E Lake Rd Erie, PA | 2.0 | 1.0 | 825 | $1,702 | $2.06 | 43d | 9 | 0.80mi |
Listing history 3 events
-
2026-06-18days on market $87,999 Active 2 DOM
-
2026-06-17remarks 693-char remark
-
2026-06-17$87,999 Active 1 DOM
ⓘ Source: listings_history table (triggers on properties + properties_extension) + one-shot
backfill from property_details.listing_events for pre-trigger history.
Tax reassessment forecast PA · Partial reset (capped growth)
- Current annual tax
- $2,869 · $239/mo
- Projected year-2 tax
- $2,869 · $239/mo
- Expected delta
- $0/yr ($0/mo · 0.0%)
ⓘ Screening estimate from a state-policy table — verify with the county assessor before closing.
Climate risk First Street
- Flood 1/10 Low FEMA zone X (unshaded) · 0% chance over 30 yrs
- Wildfire 1/10 Low
- Heat 3/10 Moderate 7 d/yr ≥91°F today · 18 d/yr by 30 yrs out
- Wind 1/10 Low
- Air quality 3/10 Moderate 4 unhealthy d/yr today · 4 by 30 yrs out
Nearby sold comps map
Loading sold comps map…
Walkable amenities ~0.75 mi
Loading nearby amenities…
Taxation est. · year 1
- Rental income
- $13,476
- − Mortgage interest
- −$4,929
- − Property taxes
- −$2,869
- − Insurance
- −$440
- − Repairs & maintenance
- −$1,078
- − Management
- −$1,078
- − Depreciation
- −$2,560
- Taxable income
- $521
- Est. tax owed @ 24.0%
- −$125
- After-tax cash flow
- $1,674/yr
For passive investors: Depreciation is non-cash, so a rental often shows a tax loss while cash-flowing — sheltering income. Rental losses are passive: they offset passive income freely, and up to $25,000/yr can offset ordinary (W-2) income if you actively participate and your MAGI is under $100k (phasing out to $0 by $150k); unused losses carry forward. On sale, claimed depreciation is recaptured at up to 25%, and gains may owe capital-gains tax (a 1031 exchange can defer both). Figures are a year-1 estimate at your 24.0% rate — not tax advice; consult a CPA.
Schools (NCES district)
- District
- Iroquois SD
- NCES district ID
- 4212210
- Math proficiency
- 39% ▼ -13.00%
- Reading proficiency
- 55% ▼ -12.00%
- Median HH income
- $50,338
- Composite
- 40.27/100
- National rank
- #3766
- State rank
- #236 of 539 in PA
Livability — Lawrence Park
- Score
- 84/100
- State rank
- #85
- US rank
- #632
Category grades
Schools grade is shown separately in the Schools card above.
Census & demographics
- Census place
- Lawrence Park, PA
- Population (ZIP)
- 11,709
Population outlook (Erie County) Hauer SSP2
- Today (2025)
- 272,159 people
- By 2030
- 266,299 · -2.2%
- By 2040
- 250,987 · -7.8%
- By 2050
- 234,925 · -13.7%
- By 2075
- 199,164 · -26.8%
- By 2100
- 162,985 · -40.1%
Race, ethnicity, and origin ACS 2023
- Neighborhood character
- Predominantly White (80%)
- Race & ethnicity
- White 80% Black 10% Hispanic / Latino 6% Two or more races 3% Asian 1%
- Hispanic origin (detail)
- Puerto Rican 5%
- Common ancestry
- Romanian 11% Lithuanian 3% Scotch-Irish 2%
- Foreign-born
- 4% · Canada
- Languages at home
- 94% English-only · Spanish 3% Russian/Polish/Slavic 2%
Political lean MEDSL · Erie
- 2024 margin
- Toss-up / Even · D 49.0% · R 50.0%
- 2008→2024 swing
- -20.9pp toward R · 2008: 19.9pp · 2024: -1.0pp
- All cycles
- 2024: R+1.0 2020: D+1.0 2016: R+2.0 2012: D+16.9 2008: D+19.9
Not yet ingested
- Civics
- —
Market trends
- HPI YoY
- ▼ -85.06%
- Current HPI
- 256.8088
- Rent YoY
- —
- Metro
- —
- State GDP YoY
- ▲ 1.68%
- F500 in state
- 34
Industry mix (Fortune 500 HQ in PA)
| Industry | F500 HQs | Revenue |
|---|---|---|
| Healthcare | 2 | $309B |
|
||
| Insurance | 2 | $27B |
|
||
| Telecommunications / Media | 1 | $124B |
|
||
| Industrial Distribution | 1 | $22B |
|
||
| Financial Services | 1 | $20B |
|
||
| Chemicals / Materials | 1 | $18B |
|
||
Price history
+158.8% since first listed4 events — show timeline
- 2026-06-16 Listed $87,999 GEBOR
- 2026-06-16 Listed $87,999 GEBOR
- 1999-08-20 Sold (Public Records) $47,500 Public Records
- 1994-02-25 Sold (Public Records) $34,000 Public Records
Property tax history
+4.2%/yrLatest (2026): $2,869 · +6.0% YoY. Source: county tax records.
Cash-flow waterfall
monthlySold comps — $/sqft
last 12 mo · ≤1 miLoading sold comps…