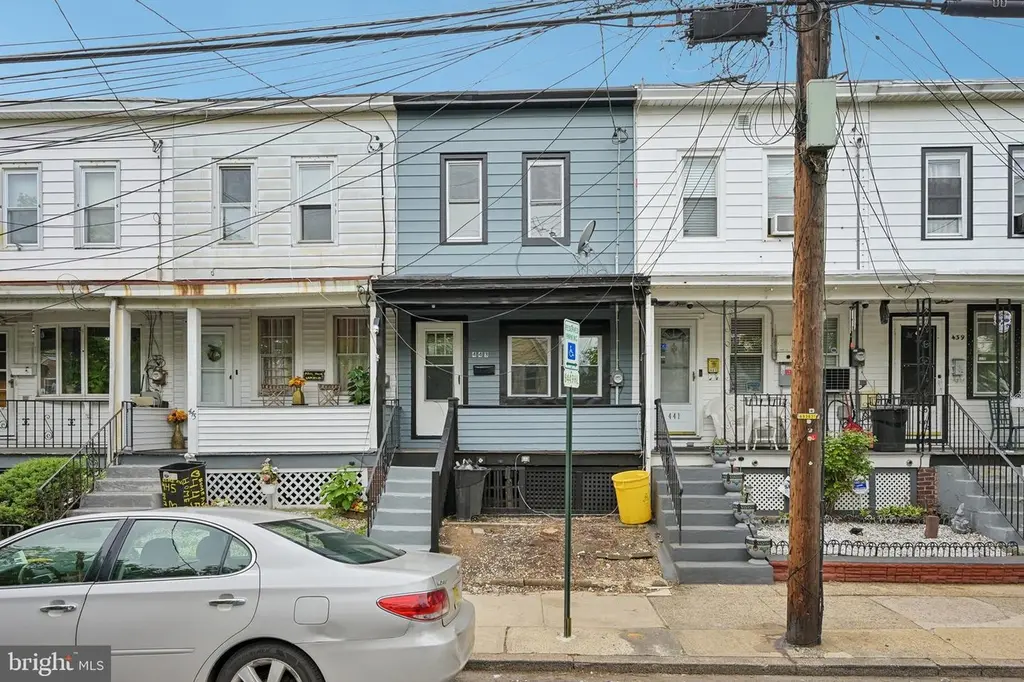
443 Home Ave · Trenton, NJ
Flood risk 1/10 · Minimal
- FEMA flood zone
- X (unshaded)
- Chance of flooding over 30 yrs
- 0.0%
- Est. flood insurance / yr
- $507 – $1,088
Fire risk 1/10 · Minimal
- Est. fire insurance / yr
- $526 – $976
Heat risk 6/10 · Moderate
- Hot days now (above 102°F)
- 7 days/yr
- Hot days in 30 yrs
- 15 days/yr
Wind risk 6/10 · Moderate
- Chance of severe wind over 30 yrs
- 27.0%
Air-quality risk 5/10 · Moderate
- Unhealthy air days now
- 6 days/yr
- Unhealthy air days in 30 yrs
- 8 days/yr
Risk factors via First Street. Map © Google.
Why this score? — see what drove the D- grade
The composite is a weighted blend of 9 inputs, each scored 0–100. Each bar is that input's sub-score; the figure is the points it added to the 100-point composite (weight × sub-score).
- Cash flow +15.8/30.0
- DSCR +4.9/10.0
- 1% rule +4.0/10.0
- Livability +3.8/5.0
- Rent growth +3.7/5.0
- Condition / age +2.5/5.0
- Schools +0.7/10.0
- ARV discount +0.0/15.0
- Appreciation +0.0/10.0
$240,995
🖨 Deal sheet (PDF) 📄 Offer letter ✓ Due diligence
Listing remarks MLS
Very well maintained home in desirable Chestnut Park. Extended kitchen gives ample preparation space, plus a dining area. Put your BBQ on the back deck, overlooking the enclosed grass yard. Relax out on the front porch and enjoy the fine sunny days. Narrow plank floors throughout. Hot Air Heat! Good sized bedrooms and closets. Go for it.
Key facts
- Built 1927
- Listed 55 days
Property features AI
Exterior
- Parking: On-street parking
- Utilities: 100 Amp electric service; Natural gas; Public water; Public sewer; Cable TV available
- Home design: Interior townhouse/rowhouse; Pitched shingle roof; Fee simple ownership
- Construction: Frame construction; Brick/mortar foundation; Building not winterized; Built (year per assessor)
- Exterior features: Deck(s); Porch(es)
Interior
- Kitchen: Eat-in kitchen
- Bedrooms: Three bedrooms on the upper level
- Flooring: Wood flooring
- Bathrooms: One full bathroom
- Heating & cooling: Forced air heating; Natural gas hot water
- Interior features: Eat-in kitchen; Full, unfinished basement
- Laundry & utility: Laundry in the basement
Neighborhood map
What this means for you Summary
Snapshot
- This is a 3-bed/1.0-bath townhouse listed at $241k.
Deal economics
- At list price, monthly cash flow is $110 ($1k/yr) — positive.
- The deal already cash-flows at list — no discount required.
- To meet the 1% rule (rent ≥ 1% of price), the offer needs to be $217k (9.9% below list).
- Recommended offer: $217k (9.9% below list) — sets the bar for 1% rule.
Location & tenants
- Location reads 76/100 on livability (#133 in NJ, #3,533 nationally) — a middle-class / working-renter tenant base. Strengths: amenities A+, commute A+, health & safety A+; Watch: crime F, employment F.
- Trenton Public School District (urban): math 2% / reading 16% proficiency, ranked #471 of 472 in NJ (top 100%) — low school quality limits family demand, transient renter base, plan for 1-2y turnover; 80% free/reduced lunch — lower-income household profile, screen leases tightly.
- Zoned schools: Columbus Elementary School (math 2% / reading 17%, grade F, #1,235 of 1,303 statewide, top 96%, 296 students, 74% FRL); Dunn Middle School (math 2% / reading 19%, grade F, #424 of 431 statewide, top 98%, 670 students, 60% FRL); Trenton Central High School - Main Campus (math 2% / reading 10%, grade F, #396 of 399 statewide, top 99%, 2,255 students, 56% FRL) — zoned schools average 63% FRL vs 80% district-wide (17 pts lower); this property's tenant base skews higher-income than the district average.
- Market conditions: Rents rising fast (+4.7%/yr); 84 active listings in the ZIP; 20 comparable units currently listed for rent nearby; rentals at typical pace (median 23d on market — plan ~3-4 weeks tenant-placement turnaround); 2,256 units permitted in Mercer County in 2024 (1,303 in 5+ unit buildings).
- At $2,172/mo this rent would consume 46% of the median local household income ($57k/yr) (locally 2147% of renters already pay >50% of income on rent) — very limited rent-growth headroom before tenants either downsize or default.
Forward outlook
- Local home prices are declining (-3.0%/yr); year-one equity from $2k of loan paydown is wiped out by about $7k of value loss. Plan a longer hold.
- Mercer County population projected at +4% by 2050 — modest demand growth; plan on rents tracking national, not racing it.
Negotiation context
- It's been on market 55 days — a 3% lower offer ($234k) is reasonable based on typical stale-listing flexibility.
- 4 sale attempts since 26y ago with the ask held roughly flat each time — persistent listings suggest the price (not the market) is what's stuck; bring a comps-based counter.
- Current owner paid $108k; list at $241k implies a 123% gain — meaningful room to come down on a strong offer.
Risks & watch-outs
- Watch-outs: built in 1927 — expect roof / HVAC / electrical / plumbing capex.
- Climate carrying-cost: major wind risk, 27% chance of damaging wind over 30y; extreme-heat days projected 7→15/yr by 2055 (HVAC capex compounding) — expect insurance premiums to compound above CPI over the hold.
Questions for the listing agent
- It's been on market 55 days. Have you received any prior offers? Is the seller open to a 10% concession, seller financing, or rate buy-down credit?
- Built in 1927 — when were the roof, HVAC, electrical panel, plumbing, and water heater last replaced?
- Is there a deadline driving the sale (1031 exchange, divorce, estate, relocation)? That informs how much negotiation room exists.
- Schools are F-rated, which usually means shorter tenancies and higher turnover. Who's the typical renter profile here, and what's been the actual vacancy rate?
- Crime grade is F in this area — have there been break-ins, vandalism, or insurance claims at this property in the last 3 years? What carrier currently insures it and at what premium?
- The area grade is low — what's the realistic commute time and amenity access for the typical tenant pool here? Any planned neighborhood developments (good or bad) we should know about?
- What's the average days-on-market for RENTAL listings here right now (not sales)? A rising rental-DOM trend means longer vacancies and softer asking-rent achievability than the comps imply.
- What's the recent tenant-quality profile in this submarket — average credit score on applications, eviction rate, late-payment / NSF rate, and stable-employment percentage? A property-management company in the area should have these aggregated.
- How much new for-sale + rental construction is in the pipeline within 1–3 miles? Heavy new supply typically softens prices + rents 12–24 months out; constrained supply supports both.
Investment metrics
- 1% rule
- 0.90% ✗
- Cap rate
- 6.84%
- Cash-on-cash
- 1.95%
- DSCR
- 1.09
- GRM
- 9.2
CMA / ARV
- ARV (on-the-fly)
- $199,824
- Comps found
- 12
Show comp detail 12 sales within ~0.75 mi
| Address | Dist | Beds/Ba | Sqft | Sold | Price | $/sf | Match |
|---|---|---|---|---|---|---|---|
| 632 Lalor St | 0.13mi | 3/1.0 | 1,120 (+1%) | 2mo | $215,000 | $192 | 89 |
| 987 Smith Ave | 0.26mi | 3/2.0 | 1,106 (+0%) | 5mo | $240,000 | $217 | 79 |
| 35 Jersey St | 0.30mi | 4/1.0 (+1) | 1,131 (+2%) | 0mo | $210,000 | $186 | 77 |
| 345 Genesee St | 0.43mi | 3/1.0 | 1,080 (-2%) | 1mo | $110,000 | $102 | 75 |
| 859 Centre St | 0.55mi | 3/1.0 | 1,100 (-0%) | 2mo | $261,000 | $237 | 72 |
| 1210 Chestnut Ave | 0.40mi | 3/1.0 | 1,047 (-5%) | 1mo | $170,000 | $162 | 72 |
| 108 Fitz Randolph | 0.38mi | 3/1.5 | 1,218 (+10%) | 3mo | $215,000 | $177 | 61 |
| 1447 S Clinton Ave | 0.47mi | 3/1.0 | 1,200 (+9%) | 5mo | $201,000 | $168 | 59 |
| 57 New Cedar Ln | 0.75mi | 3/1.0 | 1,120 (+1%) | 5mo | $141,000 | $126 | 59 |
| 327 Woodland St | 0.56mi | 3/1.0 | 1,007 (-9%) | 3mo | $182,000 | $181 | 57 |
| 203 3rd St | 0.51mi | 3/1.0 | 1,248 (+13%) | 1mo | $195,000 | $156 | 54 |
| 224 Gibbs Ave | 0.58mi | 3/1.0 | 976 (-12%) | 3mo | $193,250 | $198 | 51 |
Match score weights: distance 35% · size 25% · config 20% · recency 20%. Top-matched comps best support the ARV.
Projected returns pro-forma
-3.0% appreciation · 4.71% rent growth · sell at horizon
- IRR
- -11.4%
- Equity multiple
- 0.58×
- Total profit
- $-28,272
- Equity at exit
- $35,933
- IRR
- 0.1%
- Equity multiple
- 1.01×
- Total profit
- $507
- Equity at exit
- $20,837
Cash invested: $67,479 (down + closing). Projections, not guarantees.
Landlord ↔ Tenant lean methodology
- Overall (STATE)
- 21 Tenant-Leaning
- State New Jersey
- 21 Tenant-Leaning · D+6
- County
- — inherits STATE
- City
- — inherits STATE
ZIP-level market 08611
- Rents YoY
- 4.7%
- Active inventory
- 84
- Price-to-rent
- 9.2×
Monthly cashflow live
- Estimated rent
- $2,172 high interval (Pro) →
- Mortgage (P&I)
- −$1,264
- Tax from tax record
- −$242 /mo · $2,904/yr
- Insurance
- −$100
- HOA
- −$0
- Vacancy / Maint / Mgmt
- −$456
- Net cashflow
- $110
Break-even live
Sensitivity live
| Price | -10% $246 | -5% $178 | +0% $110 | +5% $41 | +10% $-27 |
|---|---|---|---|---|---|
| Rent | -10% $-62 | -5% $24 | +0% $110 | +5% $195 | +10% $281 |
| Rate | -1.0pp $231 | -0.5pp $171 | base $110 | +0.5pp $47 | +1.0pp $-16 |
UW: 25.0% down · 7.5% · 30yr · 1.5% tax · 5.0% vac · 8.0% maint · 8.0% mgmt
Financing live
Cash to close
- Down payment
- $60,249
- Closing costs
- $7,230
- Reserves months
- —
- Total cash needed
- —
Loan-product check · same deal, 3 products live
Conventional
25% down · 7.5% · 30yr
- Down + closing
- —
- Monthly P&I
- —
- Monthly cashflow
- —
- DSCR
- —
- Eligible?
- —
Personal DTI + credit; lowest rate.
DSCR
20% down · 8.5% · 30yr
- Down + closing
- —
- Monthly P&I
- —
- Monthly cashflow
- —
- DSCR
- —
- Eligible?
- —
No personal income docs; deal must DSCR.
Hard money
10% down · 12.0% · 12mo
- Down + closing
- —
- Monthly P&I
- —
- Monthly cashflow
- —
- DSCR
- —
- Eligible?
- —
Short-term bridge; refi at stabilization.
Rent comps 20 comps
| Address | Beds | Baths | Sqft | Rent | $/sqft | DOM | Units | Dist |
|---|---|---|---|---|---|---|---|---|
| 244 Jersey St Trenton, NJ | 3.0 | 1.5 | 1368 | $2,300 | $1.68 | 15d | 1 | 0.13mi |
| 313 Home Ave Trenton, NJ | 3.0 | 1.0 | 1112 | $2,100 | $1.89 | 15d | 1 | 0.14mi |
| 233 Virginia Ave Trenton, NJ | 3.0 | 1.0 | 1302 | $2,500 | $1.92 | 14d | 1 | 0.23mi |
| 225 Home Ave Trenton, NJ | 2.0 | 1.0 | 800 | $1,750 | $2.19 | 23d | 1 | 0.24mi |
| 1103 Division St Trenton, NJ | 4.0 | 1.0 | 1296 | $2,000 | $1.54 | 23d | 1 | 0.36mi |
| 837 Genesee St Trenton, NJ | 2.0 | 1.0 | 850 | $1,700 | $2.00 | 23d | 1 | 0.43mi |
| 1049 Genesee St Trenton, NJ | 3.0 | 1.0 | 1270 | $2,300 | $1.81 | 23d | 1 | 0.53mi |
| 203 Genesee St Unit 2 Trenton, NJ | 2.0 | 1.0 | 1452 | $1,700 | $1.17 | 23d | 1 | 0.53mi |
| 705 Anderson St Trenton, NJ | 3.0 | 1.0 | 1132 | $1,800 | $1.59 | 15d | 1 | 0.57mi |
| 547 Centre St Trenton, NJ | 3.0 | 1.0 | 1060 | $1,850 | $1.75 | 23d | 1 | 0.58mi |
| 1132 Genesee St Unit 1132 Trenton, NJ | 3.0 | 1.0 | 1198 | $2,500 | $2.09 | 23d | 1 | 0.59mi |
| 1078 Lalor St Unit 1 Trenton, NJ | 2.0 | 1.0 | 1488 | $1,895 | $1.27 | 23d | 1 | 0.61mi |
| 1078 Lalor St Unit 2 Trenton, NJ | 2.0 | 1.0 | 1488 | $1,785 | $1.20 | 23d | 1 | 0.61mi |
| 176 Division St Apt 106 Trenton, NJ | 2.0 | 1.0 | 975 | $1,700 | $1.74 | 23d | 1 | 0.80mi |
| 71 Clark St Trenton, NJ | 1.0–2.0 | 1.0–2.0 | 975 | $2,350 | $2.41 | 15d | 4 | 0.85mi |
| 635 Chambers St Trenton, NJ | 4.0 | 2.0 | 1312 | $2,500 | $1.91 | 15d | 1 | 1.09mi |
| 720 Monmouth St Unit 204 Trenton, NJ | 2.0 | 1.0 | 1011 | $1,750 | $1.73 | 23d | 1 | 1.13mi |
| 121 Columbus Ave Trenton, NJ | 3.0 | 1.0 | 1050 | $1,900 | $1.81 | 23d | 1 | 1.16mi |
| 105 Walnut Ave Unit 1 Trenton, NJ | 2.0 | 1.0 | 1200 | $2,000 | $1.67 | 23d | 1 | 1.36mi |
| 234 Walnut Ave Trenton, NJ | 4.0 | 1.0 | 1480 | $2,200 | $1.49 | 23d | 1 | 1.48mi |
Listing history 28 events
-
2026-06-22days on market $240,995 Active 55 DOM
-
2026-06-18days on market $240,995 Active 52 DOM
-
2026-06-17days on market $240,995 Active 51 DOM
-
2026-06-16days on market $240,995 Active 50 DOM
-
2026-06-15days on market $240,995 Active 49 DOM
-
2026-06-14days on market $240,995 Active 47 DOM
-
2026-06-10days on market $240,995 Active 44 DOM
-
2026-06-09days on market $240,995 Active 43 DOM
-
2026-06-08days on market $240,995 Active 42 DOM
-
2026-06-07pricedays on market $240,995 Active 41 DOM
-
2026-06-03days on market $245,995 Active 37 DOM
-
2026-06-02days on market $245,995 Active 36 DOM
-
2026-06-01days on market $245,995 Active 35 DOM
-
2026-05-31days on market $245,995 Active 34 DOM
-
2026-05-30days on market $245,995 Active 33 DOM
-
2026-04-28$245,995 Active
-
2026-04-27historical $245,995
-
2006-05-23soldstatus $108,000
-
2006-04-24soldstatus $108,000 339-char remark
Show marketing remark (339 chars)
Very well maintained home in desirable Chestnut Park. Extended kitchen gives ample preparation space, plus a dining area. Put your BBQ on the back deck, overlooking the enclosed grass yard. Relax out on the front porch and enjoy the fine sunny days. Narrow plank floors throughout. Hot Air Heat! Good sized bedrooms and closets. Go for it.
-
2006-03-10historical 339-char remark
Show marketing remark (339 chars)
Very well maintained home in desirable Chestnut Park. Extended kitchen gives ample preparation space, plus a dining area. Put your BBQ on the back deck, overlooking the enclosed grass yard. Relax out on the front porch and enjoy the fine sunny days. Narrow plank floors throughout. Hot Air Heat! Good sized bedrooms and closets. Go for it.
-
2005-11-23$108,000 339-char remark
Show marketing remark (339 chars)
Very well maintained home in desirable Chestnut Park. Extended kitchen gives ample preparation space, plus a dining area. Put your BBQ on the back deck, overlooking the enclosed grass yard. Relax out on the front porch and enjoy the fine sunny days. Narrow plank floors throughout. Hot Air Heat! Good sized bedrooms and closets. Go for it.
-
2004-08-26soldstatus $92,000
-
2004-05-14soldstatus $92,000 251-char remark
Show marketing remark (251 chars)
Beautiful 3 Bedroom Home Featuring Hardwood Floors, Enlarged Kitchen And Back Deck. Some Newer Windows, Upgraded Bathroom And Many Upgrades Thru-Out House. This Is An Absolute Move-In Condition! * Note: Contingency For Seller To Find Suitable Home. *
-
2004-03-31historical 251-char remark
Show marketing remark (251 chars)
Beautiful 3 Bedroom Home Featuring Hardwood Floors, Enlarged Kitchen And Back Deck. Some Newer Windows, Upgraded Bathroom And Many Upgrades Thru-Out House. This Is An Absolute Move-In Condition! * Note: Contingency For Seller To Find Suitable Home. *
-
2004-03-22$92,000 251-char remark
Show marketing remark (251 chars)
Beautiful 3 Bedroom Home Featuring Hardwood Floors, Enlarged Kitchen And Back Deck. Some Newer Windows, Upgraded Bathroom And Many Upgrades Thru-Out House. This Is An Absolute Move-In Condition! * Note: Contingency For Seller To Find Suitable Home. *
-
2001-01-15historical
-
2000-07-16$63,700
-
1991-01-16soldstatus $64,900
ⓘ Source: listings_history table (triggers on properties + properties_extension) + one-shot
backfill from property_details.listing_events for pre-trigger history.
Tax reassessment forecast NJ · Partial reset (capped growth)
- Current annual tax
- $2,904 · $242/mo
- Projected year-2 tax
- $4,452 · $371/mo
- Expected delta
- +$1,549/yr (+$129/mo · 53.3%)
ⓘ Screening estimate from a state-policy table — verify with the county assessor before closing.
Climate risk First Street
- Flood 1/10 Low FEMA zone X (unshaded) · 0% chance over 30 yrs
- Wildfire 1/10 Low
- Heat 6/10 Major 7 d/yr ≥102°F today · 15 d/yr by 30 yrs out
- Wind 6/10 Major 27% chance of damaging wind over 30 yrs
- Air quality 5/10 Major 6 unhealthy d/yr today · 8 by 30 yrs out
Nearby sold comps map
Loading sold comps map…
Walkable amenities ~0.75 mi
Loading nearby amenities…
Taxation est. · year 1
- Rental income
- $26,063
- − Mortgage interest
- −$13,499
- − Property taxes
- −$2,904
- − Insurance
- −$1,205
- − Repairs & maintenance
- −$2,085
- − Management
- −$2,085
- − Depreciation
- −$7,011
- Taxable loss
- −$2,726
- Est. tax savings @ 24.0%
- +$654
- After-tax cash flow
- $1,970/yr
For passive investors: Depreciation is non-cash, so a rental often shows a tax loss while cash-flowing — sheltering income. Rental losses are passive: they offset passive income freely, and up to $25,000/yr can offset ordinary (W-2) income if you actively participate and your MAGI is under $100k (phasing out to $0 by $150k); unused losses carry forward. On sale, claimed depreciation is recaptured at up to 25%, and gains may owe capital-gains tax (a 1031 exchange can defer both). Figures are a year-1 estimate at your 24.0% rate — not tax advice; consult a CPA.
Schools (NCES district)
- District
- Trenton Public School District
- NCES district ID
- 3416290
- Math proficiency
- 2% ▼ -8.00%
- Reading proficiency
- 16% ▼ -4.00%
- Median HH income
- $35,078
- Composite
- 7.31/100
- National rank
- #9956
- State rank
- #471 of 472 in NJ
Livability — Trenton
- Score
- 76/100
- State rank
- #133
- US rank
- #3533
Category grades
Schools grade is shown separately in the Schools card above.
Census & demographics
- Census place
- Trenton, NJ
- County
- Mercer County · 327,655 people
- City population
- 177,819
- Metro
- Trenton-Princeton, NJ
- Population (ZIP)
- 31,995
- Household income
- $56,788
- Rent vs Own
- Severe rent burden
- 2147.0
Population outlook (Mercer County) Hauer SSP2
- Today (2025)
- 381,395 people
- By 2030
- 384,640 · +0.9%
- By 2040
- 391,431 · +2.6%
- By 2050
- 397,845 · +4.3%
- By 2075
- 417,281 · +9.4%
- By 2100
- 420,327 · +10.2%
Race, ethnicity, and origin ACS 2023
- Neighborhood character
- Diverse neighborhood (Simpson 0.56)
- Race & ethnicity
- Hispanic / Latino 62% Black 20% Two or more races 18% White 14% Native American 4%
- Hispanic origin (detail)
- Mexican 2% Puerto Rican 12% Dominican 8%
- Common ancestry
- Romanian 2% Swiss 1% Hispanic 1%
- Foreign-born
- 37% · Canada, Jamaica, Guatemala
- Languages at home
- 41% English-only · Spanish 57% French/Haitian/Cajun 2%
Political lean MEDSL · Mercer
- 2024 margin
- Solid D (+33.9) · D 65.9% · R 32.0% · Other 2.1%
- 2008→2024 swing
- -2.2pp toward R · 2008: 36.1pp · 2024: 33.9pp
- All cycles
- 2024: D+33.9 2020: D+40.0 2016: D+36.2 2012: D+36.8 2008: D+36.1
Not yet ingested
- Civics
- —
Market trends
- HPI YoY
- ▼ -267.62%
- Current HPI
- 276.5427
- Rent YoY
- ▲ 4.71%
- Metro
- Trenton-Princeton, NJ
- State GDP YoY
- ▲ 2.05%
- F500 in state
- 34
Industry mix (Fortune 500 HQ in NJ)
| Industry | F500 HQs | Revenue |
|---|---|---|
| Consumer Goods | 3 | $31B |
|
||
| Pharmaceuticals | 2 | $153B |
|
||
| Technology | 2 | $21B |
|
||
| Insurance | 2 | $20B |
|
||
| Healthcare | 2 | $19B |
|
||
| Financial Services | 1 | $70B |
|
||
Price history
+279.0% since first listed13 events — show timeline
- 2026-04-28 Listed $245,995 BRIGHT MLS
- 2026-04-27 Coming Soon $245,995 BRIGHT MLS
- 2006-05-23 Sold (Public Records) $108,000 Public Records
- 2006-04-24 Sold (MLS) $108,000 BRIGHT MLS
- 2006-03-10 Listing Removed — BRIGHT MLS
- 2005-11-23 Listed $108,000 BRIGHT MLS
- 2004-08-26 Sold (Public Records) $92,000 Public Records
- 2004-05-14 Sold (MLS) $92,000 BRIGHT MLS
- 2004-03-31 Listing Removed — BRIGHT MLS
- 2004-03-22 Listed $92,000 BRIGHT MLS
- 2001-01-15 Listing Removed — BRIGHT MLS
- 2000-07-16 Listed $63,700 BRIGHT MLS
- 1991-01-16 Sold (Public Records) $64,900 Public Records
Property tax history
-0.3%/yrLatest (2025): $2,904 · +1.5% YoY. Source: county tax records.
Cash-flow waterfall
monthlySold comps — $/sqft
last 12 mo · ≤1 miLoading sold comps…