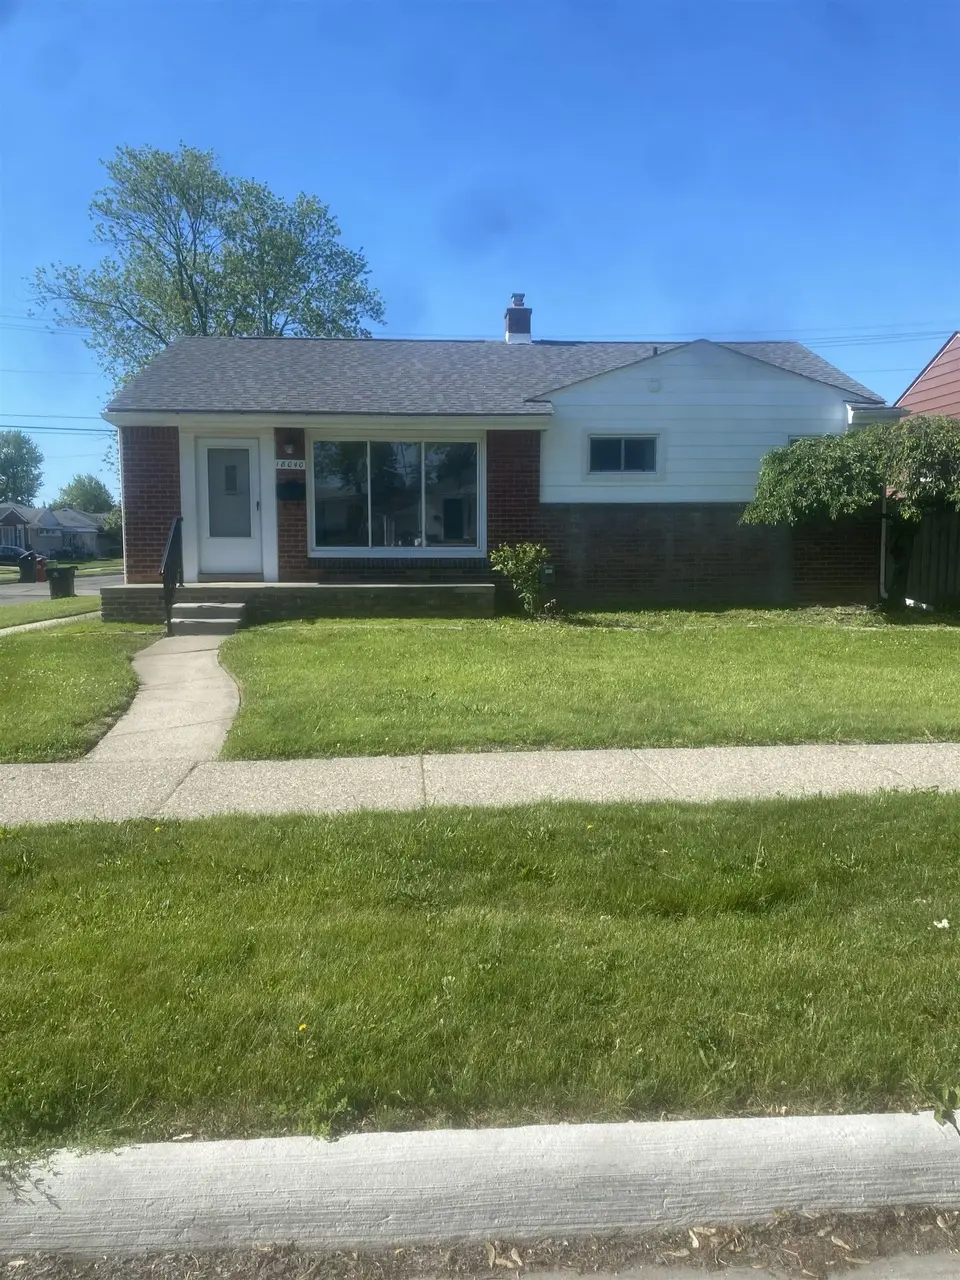
18040 Marquette St · Roseville, MI
Flood risk 1/10 · Minimal
- FEMA flood zone
- X (unshaded)
- Chance of flooding over 30 yrs
- 0.0%
- Est. flood insurance / yr
- $473 – $860
Fire risk 1/10 · Minimal
- Est. fire insurance / yr
- $784 – $1,456
Heat risk 3/10 · Minor
- Hot days now (above 96°F)
- 7 days/yr
- Hot days in 30 yrs
- 15 days/yr
Wind risk 1/10 · Minimal
- Chance of severe wind over 30 yrs
- —
Air-quality risk 4/10 · Minor
- Unhealthy air days now
- 4 days/yr
- Unhealthy air days in 30 yrs
- 5 days/yr
Risk factors via First Street. Map © Google.
Why this score? — see what drove the C- grade
The composite is a weighted blend of 9 inputs, each scored 0–100. Each bar is that input's sub-score; the figure is the points it added to the 100-point composite (weight × sub-score).
- Cash flow +22.9/30.0
- DSCR +7.3/10.0
- 1% rule +6.0/10.0
- ARV discount +4.4/15.0
- Livability +3.6/5.0
- Rent growth +2.6/5.0
- Condition / age +2.2/5.0
- Schools +1.5/10.0
- Appreciation +0.0/10.0
$215,000
🖨 Deal sheet 📄 Offer letter ✓ Due diligence
Listing remarks MLS
Want a home that have your big ticket items taken care of? This is the place for you. Upgraded kitchen with stainless appliances and fresh paint job throughout. Beautiful hardwood floors, redone bathroom, kitchen with quartz, AC and furnace 2025. Newer roof should last you a long time as well, full fenced back yard. Basement is complete with flooring, can lighting, and painted walls/ceiling.
Key facts
- Kitchen with quartz
- Redone bathroom
- Stainless appliances
Tags
Property features AI
Finance
- Other: Residential property
- HOA & community: Homeowners association present
Exterior
- Parking: Detached garage; Approximately 1.5 garage spaces
- Utilities: Public water; Public sewer
- Home design: Single-family residence; One level
- Construction: Aluminum siding and brick exterior
- Exterior features: Paved road access; Lot dimensions approximately 50 x 101; Subdivision: HUNTINGTON MANOR # 01; Cross streets: N Frazho and E Gratiot
Interior
- Kitchen: Dishwasher; Microwave; Oven; Range; Refrigerator
- Bathrooms: One full bathroom
- Heating & cooling: Forced air heating (natural gas); Central air conditioning
- Interior features: Concrete, partially finished basement; Six total rooms
- Laundry & utility: Washer; Dryer; Gas water heater
Neighborhood map
What this means for you Summary
Snapshot
- This is a 3-bed/1.0-bath single-family listed at $215k. Condition is rated fair.
Deal economics
- At list price, monthly cash flow is $377 ($5k/yr) — positive.
- The deal already cash-flows at list — no discount required.
- Meets the 1% rule at list price ($2k rent vs $215k).
- Cap rate 8.4% vs local median 6.0% in Roseville — top-decile yield for the area; either an underpriced asset or a hidden risk that comps aren't pricing in. Stress-test before assuming the spread holds.
Location & tenants
- Location reads 72/100 on livability (#258 in MI) — a middle-class / working-renter tenant base. Strengths: commute A+, cost of living A+, housing A+; Watch: health & safety D+, employment D, schools F.
- Roseville Community Schools (suburban): math 11% / reading 24% proficiency, ranked #483 of 540 in MI (top 89%) — low school quality limits family demand, transient renter base, plan for 1-2y turnover; 60% free/reduced lunch — lower-income household profile, screen leases tightly.
- Market conditions: Rents flat; 265 active listings in the ZIP; 2 comparable units currently listed for rent nearby; 1,321 units permitted in Macomb County in 2024 (86 in 5+ unit buildings).
- At $2,358/mo this rent would consume 46% of the median local household income ($62k/yr) (locally 1712% of renters already pay >50% of income on rent) — very limited rent-growth headroom before tenants either downsize or default.
Forward outlook
- Local home prices are declining (-3.0%/yr); year-one equity from $1k of loan paydown is wiped out by about $6k of value loss. Plan a longer hold.
- Macomb County population projected at +9% by 2050 — modest demand growth; plan on rents tracking national, not racing it.
Negotiation context
- Only 7 days on market — expect competitive offers; lowballing is unlikely to land.
- 5 sale attempts since 31y ago with the ask held roughly flat each time — persistent listings suggest the price (not the market) is what's stuck; bring a comps-based counter.
- Current owner paid $89k; list at $215k implies a 142% gain — meaningful room to come down on a strong offer.
Risks & watch-outs
- Watch-outs: built in 1951 — expect roof / HVAC / electrical / plumbing capex.
Questions for the listing agent
- Have any recent inspections been done? Can we get a copy of the seller's disclosures and any deferred-maintenance estimates?
- Built in 1951 — when were the roof, HVAC, electrical panel, plumbing, and water heater last replaced?
- Is there a deadline driving the sale (1031 exchange, divorce, estate, relocation)? That informs how much negotiation room exists.
- Schools are F-rated, which usually means shorter tenancies and higher turnover. Who's the typical renter profile here, and what's been the actual vacancy rate?
- Crime grade is F in this area — have there been break-ins, vandalism, or insurance claims at this property in the last 3 years? What carrier currently insures it and at what premium?
- What's the average days-on-market for RENTAL listings here right now (not sales)? A rising rental-DOM trend means longer vacancies and softer asking-rent achievability than the comps imply.
- What's the recent tenant-quality profile in this submarket — average credit score on applications, eviction rate, late-payment / NSF rate, and stable-employment percentage? A property-management company in the area should have these aggregated.
- How much new for-sale + rental construction is in the pipeline within 1–3 miles? Heavy new supply typically softens prices + rents 12–24 months out; constrained supply supports both.
Investment metrics
- 1% rule
- 1.10% ✓
- Cap rate
- 8.40%
- Cash-on-cash
- 7.52%
- DSCR
- 1.33
- GRM
- 7.6
CMA / ARV
- ARV (on-the-fly)
- $201,096
- Comps found
- 12
Show comp detail 12 sales within ~0.75 mi
| Address | Dist | Beds/Ba | Sqft | Sold | Price | $/sf | Match |
|---|---|---|---|---|---|---|---|
| 18140 Marquette St | 0.08mi | 3/2.0 | 1,976 (-4%) | 2mo | $193,000 | $98 | 84 |
| 26049 Fernwood St | 0.16mi | 3/2.0 | 2,050 (-0%) | 6mo | $258,000 | $126 | 84 |
| 26211 Linwood St | 0.13mi | 3/1.0 | 2,200 (+7%) | 1mo | $182,600 | $83 | 81 |
| 25625 Barbara St | 0.44mi | 3/1.0 | 1,944 (-5%) | 2mo | $131,000 | $67 | 69 |
| 25585 Ronald St | 0.51mi | 3/1.5 | 2,000 (-2%) | 3mo | $182,000 | $91 | 67 |
| 25866 Huron St | 0.46mi | 3/1.5 | 1,924 (-6%) | 0mo | $156,500 | $81 | 66 |
| 25705 Ronald St | 0.44mi | 3/1.5 | 2,218 (+8%) | 1mo | $224,000 | $101 | 63 |
| 26574 Collingwood St | 0.50mi | 3/1.5 | 1,825 (-11%) | 2mo | $235,000 | $129 | 54 |
| 27624 Edward St | 0.74mi | 2/1.0 (-1) | 1,952 (-5%) | 2mo | $185,000 | $95 | 51 |
| 25070 Barbara St | 0.72mi | 3/2.0 | 1,944 (-5%) | 3mo | $230,000 | $118 | 51 |
| 18383 Hazelwood St | 0.59mi | 3/2.0 | 2,236 (+9%) | 4mo | $165,000 | $74 | 50 |
| 25664 Ronald St | 0.50mi | 3/2.0 | 1,800 (-12%) | 6mo | $220,000 | $122 | 47 |
Match score weights: distance 35% · size 25% · config 20% · recency 20%. Top-matched comps best support the ARV.
Projected returns pro-forma
-3.0% appreciation · 0.39% rent growth · sell at horizon
- IRR
- -7.8%
- Equity multiple
- 0.72×
- Total profit
- $-16,814
- Equity at exit
- $32,057
- IRR
- -2.0%
- Equity multiple
- 0.88×
- Total profit
- $-7,066
- Equity at exit
- $18,589
Cash invested: $60,200 (down + closing). Projections, not guarantees.
Landlord ↔ Tenant lean methodology
- Overall (STATE)
- 62 Landlord-Friendly
- State Michigan
- 62 Landlord-Friendly · EVEN
- County
- — inherits STATE
- City
- — inherits STATE
ZIP-level market 48066
- Rents YoY
- 0.4%
- Active inventory
- 265
- Price-to-rent
- 7.6×
Monthly cashflow live
- Estimated rent
- $2,358 medium interval (Pro) →
- Mortgage (P&I)
- −$1,127
- Tax est. 1.5%
- −$269 /mo · $3,225/yr
- Insurance
- −$90
- HOA
- −$0
- Vacancy / Maint / Mgmt
- −$495
- Net cashflow
- $377
Break-even live
UW: 25.0% down · 7.5% · 30yr · 1.5% tax · 5.0% vac · 8.0% maint · 8.0% mgmt
Financing live
Cash to close
- Down payment
- $53,750
- Closing costs
- $6,450
- Reserves months
- —
- Total cash needed
- —
Loan-product check · same deal, 3 products live
Conventional
25% down · 7.5% · 30yr
- Down + closing
- —
- Monthly P&I
- —
- Monthly cashflow
- —
- DSCR
- —
- Eligible?
- —
Personal DTI + credit; lowest rate.
DSCR
20% down · 8.5% · 30yr
- Down + closing
- —
- Monthly P&I
- —
- Monthly cashflow
- —
- DSCR
- —
- Eligible?
- —
No personal income docs; deal must DSCR.
Hard money
10% down · 12.0% · 12mo
- Down + closing
- —
- Monthly P&I
- —
- Monthly cashflow
- —
- DSCR
- —
- Eligible?
- —
Short-term bridge; refi at stabilization.
Rent comps 2 comps
| Address | Beds | Baths | Sqft | Rent | $/sqft | DOM | Units | Dist |
|---|---|---|---|---|---|---|---|---|
| 25530 Huron St Roseville, MI | 3.0 | 2.0 | 2024 | $1,600 | $0.79 | 3d | 1 | 0.60mi |
| 28232 Floral St Unit 1032343P Roseville, MI | 3.0 | 1.0 | 1496 | $6,605 | $4.42 | 12d | 1 | 1.10mi |
Listing history 6 events
-
2026-06-09days on market $215,000 Active 7 DOM
-
2026-06-08days on market $215,000 Active 6 DOM
-
2026-06-07days on market $215,000 Active 5 DOM
-
2026-06-04days on market $215,000 Active 2 DOM
-
2026-06-02remarks 394-char remark
Show marketing remark (394 chars)
Want a home that have your big ticket items taken care of? This is the place for you. Upgraded kitchen with stainless appliances and fresh paint job throughout. Beautiful hardwood floors, redone bathroom, kitchen with quartz, AC and furnace 2025. Newer roof should last you a long time as well, full fenced back yard. Basement is complete with flooring, can lighting, and painted walls/ceiling.
-
2026-06-02$215,000 Active 1 DOM
Show marketing remark (394 chars)
Want a home that have your big ticket items taken care of? This is the place for you. Upgraded kitchen with stainless appliances and fresh paint job throughout. Beautiful hardwood floors, redone bathroom, kitchen with quartz, AC and furnace 2025. Newer roof should last you a long time as well, full fenced back yard. Basement is complete with flooring, can lighting, and painted walls/ceiling.
ⓘ Source: listings_history table (triggers on properties + properties_extension) + one-shot
backfill from property_details.listing_events for pre-trigger history.
Climate risk First Street
- Flood 1/10 Low FEMA zone X (unshaded) · 0% chance over 30 yrs
- Wildfire 1/10 Low
- Heat 3/10 Moderate 7 d/yr ≥96°F today · 15 d/yr by 30 yrs out
- Wind 1/10 Low
- Air quality 4/10 Moderate 4 unhealthy d/yr today · 5 by 30 yrs out
Nearby sold comps map
Loading sold comps map…
Walkable amenities ~0.75 mi
Loading nearby amenities…
Taxation est. · year 1
- Rental income
- $28,299
- − Mortgage interest
- −$12,043
- − Property taxes
- −$3,225
- − Insurance
- −$1,075
- − Repairs & maintenance
- −$2,264
- − Management
- −$2,264
- − Depreciation
- −$6,255
- Taxable income
- $1,174
- Est. tax owed @ 24.0%
- −$282
- After-tax cash flow
- $4,245/yr
For passive investors: Depreciation is non-cash, so a rental often shows a tax loss while cash-flowing — sheltering income. Rental losses are passive: they offset passive income freely, and up to $25,000/yr can offset ordinary (W-2) income if you actively participate and your MAGI is under $100k (phasing out to $0 by $150k); unused losses carry forward. On sale, claimed depreciation is recaptured at up to 25%, and gains may owe capital-gains tax (a 1031 exchange can defer both). Figures are a year-1 estimate at your 24.0% rate — not tax advice; consult a CPA.
Condition & rehab AI · 1 photo
This home requires significant updates to its interior and exterior, including painting, flooring, and kitchen/bathroom renovations. It has a good roof and a fenced yard, but the overall condition is fair and would benefit from moderate renovations to increase its value.
Repairs flagged
- Major Kitchen — No photos of kitchen
- Major Bathroom — No photos of bathroom
- Major Exterior — No photos of exterior
- Major Flooring — No photos of flooring
- Major Interior walls/paint — No photos of interior walls/paint
- Major Systems — No photos of systems
Value-add opportunities
- Both Paint interior walls and ceiling — Fresh paint enhances curb appeal and interior aesthetics
- Both Replace flooring — New flooring improves comfort and value
- Both Update kitchen and bathroom — Modern kitchens and bathrooms attract more buyers and renters
Renovation cost estimate screening
| Repair item | Severity | Est. cost |
|---|---|---|
| Kitchen · No photos of kitchen | Major | $15,000–50,000 |
| Bathroom · No photos of bathroom | Major | $15,000–50,000 |
| Exterior · No photos of exterior | Major | $15,000–50,000 |
| Flooring · No photos of flooring | Major | $15,000–50,000 |
| Interior walls/paint · No photos of interior walls/paint | Major | $15,000–50,000 |
| Systems · No photos of systems | Major | $15,000–50,000 |
| Total estimated repair cost · 6 items | $90,000–300,000 |
Value-add ROI direction
- Both Paint interior walls and ceiling — Fresh paint enhances curb appeal and interior aesthetics ↑
- Both Replace flooring — New flooring improves comfort and value ↑
- Both Update kitchen and bathroom — Modern kitchens and bathrooms attract more buyers and renters ↑
ⓘ Cost ranges are severity-bucket heuristics (US national rule-of-thumb). Get contractor quotes + a written scope before underwriting a rehab budget.
Schools (NCES district)
- District
- Roseville Community Schools
- NCES district ID
- 2630210
- Math proficiency
- 11% ▼ -8.00%
- Reading proficiency
- 24% ▼ -7.00%
- Median HH income
- $41,590
- Composite
- 14.98/100
- National rank
- #9363
- State rank
- #483 of 540 in MI
Livability — Roseville
- Score
- 72/100
- State rank
- #258
- US rank
- #6400
Category grades
Schools grade is shown separately in the Schools card above.
Census & demographics
- Census place
- Roseville, MI
- County
- Macomb County · 638,552 people
- City population
- 47,123
- Metro
- Detroit-Warren-Dearborn, MI
- Population (ZIP)
- 47,123
- Household income
- $62,182
- Rent vs Own
- Severe rent burden
- 1712.0
Population outlook (Macomb County) Hauer SSP2
- Today (2025)
- 925,296 people
- By 2030
- 948,226 · +2.5%
- By 2040
- 983,961 · +6.3%
- By 2050
- 1,010,200 · +9.2%
- By 2075
- 1,076,222 · +16.3%
- By 2100
- 1,077,065 · +16.4%
Race, ethnicity, and origin ACS 2023
- Neighborhood character
- Predominantly White (65%)
- Race & ethnicity
- White 65% Black 23% Two or more races 7% Hispanic / Latino 4% Asian 2%
- Common ancestry
- Romanian 12% Lithuanian 4% Slovak 2%
- Foreign-born
- 5% · Canada
- Languages at home
- 93% English-only · Spanish 2% Russian/Polish/Slavic 1% Other Indo-European 1%
Political lean MEDSL · Macomb
- 2024 margin
- R (+13.7) · D 42.2% · R 55.9% · Other 1.9%
- 2008→2024 swing
- -22.3pp toward R · 2008: 8.6pp · 2024: -13.7pp
- All cycles
- 2024: R+13.7 2020: R+8.1 2016: R+11.6 2012: D+4.0 2008: D+8.6
Not yet ingested
- Civics
- —
Market trends
- HPI YoY
- ▼ -232.95%
- Current HPI
- 217.4171
- Rent YoY
- ▲ 0.39%
- Metro
- Detroit-Warren-Dearborn, MI
- State GDP YoY
- ▲ 1.37%
- F500 in state
- 28
Industry mix (Fortune 500 HQ in MI)
| Industry | F500 HQs | Revenue |
|---|---|---|
| Automotive Parts | 3 | $48B |
|
||
| Automotive | 2 | $372B |
|
||
| Chemicals | 1 | $45B |
|
||
| Automotive Retail | 1 | $29B |
|
||
| Healthcare / Medical Devices | 1 | $23B |
|
||
| Automotive Technology | 1 | $20B |
|
||
Price history
+194.5% since first listed10 events — show timeline
- 2026-06-02 Listed $215,000 REALCOMP
- 2026-06-02 Listed $215,000 MiRealSource-MiMLS
- 2019-02-22 Sold (MLS) $89,000 REALCOMP
- 2019-02-22 Sold (MLS) $89,000 MiRealSource-MiMLS
- 2019-01-30 Pending — MiRealSource-MiMLS
- 2019-01-09 Listed $94,900 REALCOMP
- 2019-01-09 Listed $94,900 MiRealSource-MiMLS
- 1995-05-09 Sold (MLS) $73,000 MiRealSource-MiMLS
- 1995-03-24 Listing Removed — MiRealSource-MiMLS
- 1995-03-09 Listed $73,000 MiRealSource-MiMLS
Cash-flow waterfall
monthlySold comps — $/sqft
last 12 mo · ≤1 miLoading sold comps…