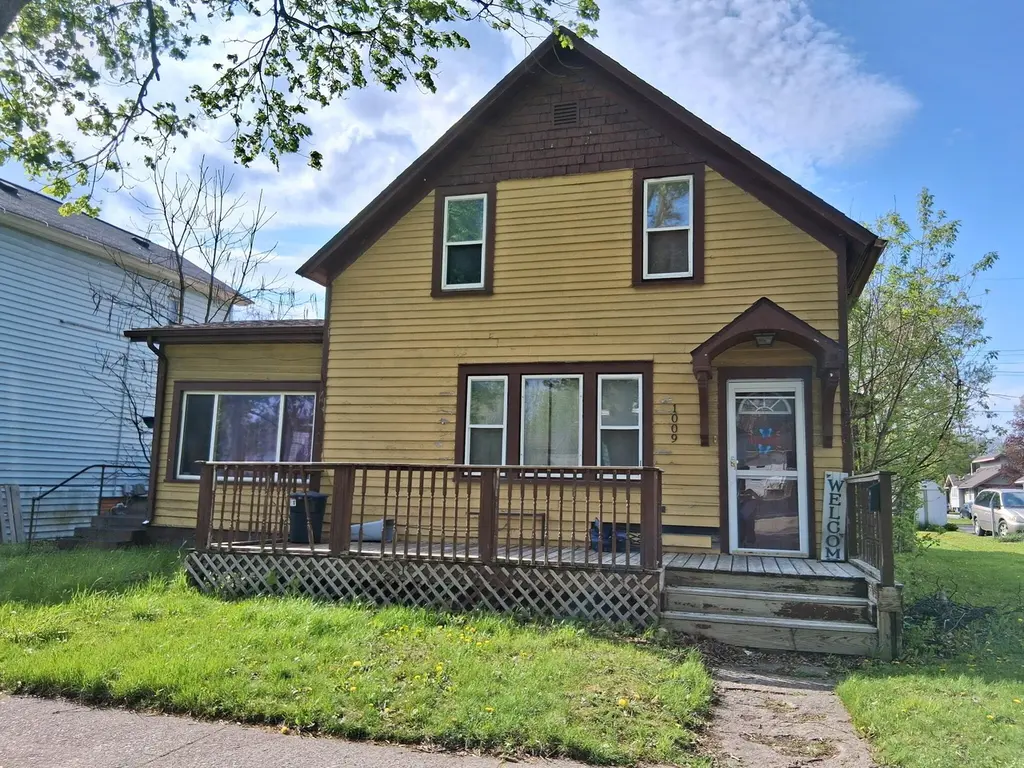
1009 N Bond St · Saginaw, MI
Flood risk 1/10 · Minimal
- FEMA flood zone
- X (unshaded)
- Chance of flooding over 30 yrs
- 0.0%
- Est. flood insurance / yr
- $507 – $1,088
Fire risk 1/10 · Minimal
- Est. fire insurance / yr
- $784 – $1,456
Heat risk 2/10 · Minimal
- Hot days now (above 100°F)
- 7 days/yr
- Hot days in 30 yrs
- 14 days/yr
Wind risk 1/10 · Minimal
- Chance of severe wind over 30 yrs
- —
Air-quality risk 2/10 · Minimal
- Unhealthy air days now
- 1 days/yr
- Unhealthy air days in 30 yrs
- 2 days/yr
Risk factors via First Street. Map © Google.
Why this score? — see what drove the C+ grade
The composite is a weighted blend of 9 inputs, each scored 0–100. Each bar is that input's sub-score; the figure is the points it added to the 100-point composite (weight × sub-score).
- Cash flow +27.4/30.0
- DSCR +9.6/10.0
- 1% rule +8.7/10.0
- ARV discount +7.0/15.0
- Rent growth +3.5/5.0
- Livability +3.2/5.0
- Condition / age +2.5/5.0
- Schools +2.0/10.0
- Appreciation +0.0/10.0
$84,900
🖨 Deal sheet (PDF) 📄 Offer letter ✓ Due diligence
Listing remarks MLS
Great rental investment opportunity with strong ROI potential! This spacious 3-bedroom, 2-bath home offers over 1,500 square feet of living space with a functional layout that appeals to both tenants and owner-occupants alike. Features include generous room sizes, abundant natural light, and a main-floor primary bedroom for added convenience. Located close to schools, shopping, parks, and downtown Saginaw, this property is positioned in an area with consistent rental demand. Whether you're looking to expand your investment portfolio or secure a value-packed property with income potential, this is an opportunity worth seeing!
Key facts
- 5,489 sq ft lot
- Built 1892
- Listed 44 days
Property features AI
Exterior
- Utilities: Public water
- Home design: Traditional-style single-family home; One building with 1,527 square feet living area; Built in 1892
- Construction: Wood siding exterior
- Exterior features: Lot is approximately 0.13 acres; Public water
Interior
- Bathrooms: Two full bathrooms
- Heating & cooling: Forced air heating
- Interior features: Six total rooms; Crawl space basement
Neighborhood map
What this means for you Summary
Snapshot
- This is a 3-bed/2.0-bath single-family listed at $85k.
Deal economics
- At list price, monthly cash flow is $248 ($3k/yr) — positive.
- The deal already cash-flows at list — no discount required.
- Meets the 1% rule at list price ($1k rent vs $85k).
- Recommended offer: $82k (3.0% below list) — sets the bar for market timing.
- Cap rate 9.8% vs local median 7.8% in Saginaw — meaningfully above typical; check what's discounted (condition, days-on-market, listing class) to confirm the premium yield is real.
Location & tenants
- Location reads 63/100 on livability (#521 in MI) — a middle-class / working-renter tenant base. Strengths: cost of living A+, housing A+, health & safety A+; Watch: crime F, amenities F, commute F.
- Saginaw School District (urban): math 20% / reading 29% proficiency, ranked #444 of 540 in MI (top 82%) — low school quality limits family demand, transient renter base, plan for 1-2y turnover; 76% free/reduced lunch — lower-income household profile, screen leases tightly.
- Zoned schools: Thompson Middle School (math 6% / reading 13%, grade F, #479 of 493 statewide, top 97%, 397 students, 93% FRL) — zoned schools average 93% FRL vs 76% district-wide (17 pts higher); higher-poverty schools than district average — tighter screening recommended.
- Zoned-school proficiency averages 10% at this address vs 24% district-wide (-15 pts) — the specific schools serving this property underperform the Saginaw School District average; the district grade overstates school quality for this exact location.
- Market conditions: Rents rising (+4.0%/yr); 250 active listings in the ZIP; 154 units permitted in Saginaw County in 2024 (0 in 5+ unit buildings).
Forward outlook
- Local home prices are declining (-3.0%/yr); year-one equity from $587 of loan paydown is wiped out by about $3k of value loss. Plan a longer hold.
- Saginaw County population projected at -25% by 2050 — secular population decline; favor cash flow + early exit over multi-decade hold.
- At projected returns (-3.0% appreciation + 4.0% rent growth), your $24k cash investment doubles in ~9 years — after that, you're playing with house money.
Negotiation context
- It's been on market 45 days — a 3% lower offer ($82k) is reasonable based on typical stale-listing flexibility.
- 9 sale attempts since 27y ago; this cycle's ask has dropped $5k (6%) from the opening price — seller is motivated, your offer sets the floor, not the list.
- Current owner paid $63k; 35% above their basis — modest negotiation headroom, anchor on the comps not their cost.
Risks & watch-outs
- Watch-outs: property tax is 2.7% of price; built in 1892 — expect roof / HVAC / electrical / plumbing capex.
Questions for the listing agent
- It's been on market 45 days. Have you received any prior offers? Is the seller open to a 3% concession, seller financing, or rate buy-down credit?
- Built in 1892 — when were the roof, HVAC, electrical panel, plumbing, and water heater last replaced?
- Property tax is high relative to price — has the assessment been appealed recently, and will the sale trigger a re-assessment?
- Is there a deadline driving the sale (1031 exchange, divorce, estate, relocation)? That informs how much negotiation room exists.
- Schools are F-rated, which usually means shorter tenancies and higher turnover. Who's the typical renter profile here, and what's been the actual vacancy rate?
- Crime grade is F in this area — have there been break-ins, vandalism, or insurance claims at this property in the last 3 years? What carrier currently insures it and at what premium?
- What's the average days-on-market for RENTAL listings here right now (not sales)? A rising rental-DOM trend means longer vacancies and softer asking-rent achievability than the comps imply.
- What's the recent tenant-quality profile in this submarket — average credit score on applications, eviction rate, late-payment / NSF rate, and stable-employment percentage? A property-management company in the area should have these aggregated.
- How much new for-sale + rental construction is in the pipeline within 1–3 miles? Heavy new supply typically softens prices + rents 12–24 months out; constrained supply supports both.
Investment metrics
- 1% rule
- 1.37% ✓
- Cap rate
- 9.80%
- Cash-on-cash
- 12.52%
- DSCR
- 1.56
- GRM
- 6.1
CMA / ARV
- ARV (on-the-fly)
- $83,985
- Comps found
- 12
Show comp detail 12 sales within ~0.75 mi
| Address | Dist | Beds/Ba | Sqft | Sold | Price | $/sf | Match |
|---|---|---|---|---|---|---|---|
| 1933 Delaware St | 0.55mi | 3/1.0 | 1,539 (+1%) | 3mo | $51,000 | $33 | 66 |
| 203 N Webster St | 0.57mi | 3/2.0 | 1,607 (+5%) | 4mo | $115,000 | $72 | 61 |
| 1614 Barnard St | 0.35mi | 4/2.0 (+1) | 1,677 (+10%) | 4mo | $160,000 | $95 | 59 |
| 2403 Stobbe St | 0.61mi | 4/1.5 (+1) | 1,510 (-1%) | 6mo | $90,000 | $60 | 58 |
| 1923 N Oakley St | 0.51mi | 3/2.0 | 1,343 (-12%) | 4mo | $20,000 | $15 | 53 |
| 1500 N Charles St | 0.41mi | 2/1.0 (-1) | 1,392 (-9%) | 5mo | $47,000 | $34 | 53 |
| 2206 N Bond St | 0.71mi | 4/2.0 (+1) | 1,575 (+3%) | 7mo | $85,000 | $54 | 51 |
| 1920 W Genesee St | 0.64mi | 4/2.0 (+1) | 1,391 (-9%) | 3mo | $53,500 | $38 | 48 |
| 1819 Delaware St | 0.45mi | 4/1.0 (+1) | 1,334 (-13%) | 3mo | $93,000 | $70 | 46 |
| 2023 Schaefer St | 0.75mi | 4/1.5 (+1) | 1,430 (-6%) | 4mo | $126,000 | $88 | 44 |
| 1710 State St | 0.66mi | 4/2.0 (+1) | 1,358 (-11%) | 6mo | $75,000 | $55 | 41 |
| 815 W Genesee Ave | 0.62mi | 3/1.0 | 1,305 (-14%) | 5mo | $72,000 | $55 | 38 |
Match score weights: distance 35% · size 25% · config 20% · recency 20%. Top-matched comps best support the ARV.
Projected returns pro-forma
-3.0% appreciation · 3.98% rent growth · sell at horizon
- IRR
- 3.5%
- Equity multiple
- 1.14×
- Total profit
- $3,268
- Equity at exit
- $12,659
- IRR
- 14.1%
- Equity multiple
- 2.19×
- Total profit
- $28,327
- Equity at exit
- $7,341
Cash invested: $23,772 (down + closing). Projections, not guarantees.
Landlord ↔ Tenant lean methodology
- Overall (STATE)
- 62 Landlord-Friendly
- State Michigan
- 62 Landlord-Friendly · EVEN
- County
- — inherits STATE
- City
- — inherits STATE
ZIP-level market 48602
- Home prices YoY
- -19.7%
- Rents YoY
- 4.0%
- Active inventory
- 250
- Price-to-rent
- 6.1×
Monthly cashflow live
- Estimated rent
- $1,165 medium interval (Pro) →
- Mortgage (P&I)
- −$445
- Tax from tax record
- −$192 /mo · $2,305/yr
- Insurance
- −$35
- HOA
- −$0
- Vacancy / Maint / Mgmt
- −$245
- Net cashflow
- $248
Break-even live
Sensitivity live
| Price | -10% $296 | -5% $272 | +0% $248 | +5% $224 | +10% $200 |
|---|---|---|---|---|---|
| Rent | -10% $156 | -5% $202 | +0% $248 | +5% $294 | +10% $340 |
| Rate | -1.0pp $291 | -0.5pp $270 | base $248 | +0.5pp $226 | +1.0pp $204 |
UW: 25.0% down · 7.5% · 30yr · 1.5% tax · 5.0% vac · 8.0% maint · 8.0% mgmt
Financing live
Cash to close
- Down payment
- $21,225
- Closing costs
- $2,547
- Reserves months
- —
- Total cash needed
- —
Loan-product check · same deal, 3 products live
Conventional
25% down · 7.5% · 30yr
- Down + closing
- —
- Monthly P&I
- —
- Monthly cashflow
- —
- DSCR
- —
- Eligible?
- —
Personal DTI + credit; lowest rate.
DSCR
20% down · 8.5% · 30yr
- Down + closing
- —
- Monthly P&I
- —
- Monthly cashflow
- —
- DSCR
- —
- Eligible?
- —
No personal income docs; deal must DSCR.
Hard money
10% down · 12.0% · 12mo
- Down + closing
- —
- Monthly P&I
- —
- Monthly cashflow
- —
- DSCR
- —
- Eligible?
- —
Short-term bridge; refi at stabilization.
Listing history 34 events
-
2026-06-19days on market $84,900 Active 45 DOM
-
2026-06-18days on market $84,900 Active 44 DOM
-
2026-06-17days on market $84,900 Active 43 DOM
-
2026-06-16days on market $84,900 Active 42 DOM
-
2026-06-15days on market $84,900 Active 41 DOM
-
2026-06-14days on market $84,900 Active 39 DOM
-
2026-06-12days on market $84,900 Active 38 DOM
-
2026-06-09days on market $84,900 Active 35 DOM
-
2026-06-08days on market $84,900 Active 34 DOM
-
2026-06-07days on market $84,900 Active 33 DOM
-
2026-06-05days on market $84,900 Active 30 DOM
-
2026-06-03days on market $84,900 Active 29 DOM
-
2026-06-02days on market $84,900 Active 28 DOM
-
2026-06-01days on market $84,900 Active 27 DOM
-
2026-05-31days on market $84,900 Active 26 DOM
-
2026-05-30days on market $84,900 Active 25 DOM
-
2026-05-06$89,900 Active
Show marketing remark (632 chars)
Great rental investment opportunity with strong ROI potential! This spacious 3-bedroom, 2-bath home offers over 1,500 square feet of living space with a functional layout that appeals to both tenants and owner-occupants alike. Features include generous room sizes, abundant natural light, and a main-floor primary bedroom for added convenience. Located close to schools, shopping, parks, and downtown Saginaw, this property is positioned in an area with consistent rental demand. Whether you're looking to expand your investment portfolio or secure a value-packed property with income potential, this is an opportunity worth seeing!
-
2026-05-06$89,900 Active 632-char remark
Show marketing remark (632 chars)
Great rental investment opportunity with strong ROI potential! This spacious 3-bedroom, 2-bath home offers over 1,500 square feet of living space with a functional layout that appeals to both tenants and owner-occupants alike. Features include generous room sizes, abundant natural light, and a main-floor primary bedroom for added convenience. Located close to schools, shopping, parks, and downtown Saginaw, this property is positioned in an area with consistent rental demand. Whether you're looking to expand your investment portfolio or secure a value-packed property with income potential, this is an opportunity worth seeing!
-
2005-11-18soldstatus $62,700
-
2004-11-12historical
-
2004-11-12historical
-
2004-05-12$59,900
-
2004-05-12$59,900
-
2004-02-25historical
-
2004-02-23soldstatus $25,000
-
2004-02-23soldstatus $25,000
-
2003-11-07$27,000
-
2003-11-07$27,000
-
2000-02-09soldstatus $50,900
-
2000-02-04soldstatus $50,900
-
2000-02-04soldstatus $50,900
-
1999-09-23$47,900
-
1999-09-23$47,900
ⓘ Source: listings_history table (triggers on properties + properties_extension) + one-shot
backfill from property_details.listing_events for pre-trigger history.
Tax reassessment forecast MI · Partial reset (capped growth)
- Current annual tax
- $2,305 · $192/mo
- Projected year-2 tax
- $2,305 · $192/mo
- Expected delta
- $0/yr ($0/mo · 0.0%)
ⓘ Screening estimate from a state-policy table — verify with the county assessor before closing.
Climate risk First Street
- Flood 1/10 Low FEMA zone X (unshaded) · 0% chance over 30 yrs
- Wildfire 1/10 Low
- Heat 2/10 Low 7 d/yr ≥100°F today · 14 d/yr by 30 yrs out
- Wind 1/10 Low
- Air quality 2/10 Low 1 unhealthy d/yr today · 2 by 30 yrs out
Nearby sold comps map
Loading sold comps map…
Walkable amenities ~0.75 mi
Loading nearby amenities…
Taxation est. · year 1
- Rental income
- $13,985
- − Mortgage interest
- −$4,756
- − Property taxes
- −$2,305
- − Insurance
- −$424
- − Repairs & maintenance
- −$1,119
- − Management
- −$1,119
- − Depreciation
- −$2,470
- Taxable income
- $1,792
- Est. tax owed @ 24.0%
- −$430
- After-tax cash flow
- $2,546/yr
For passive investors: Depreciation is non-cash, so a rental often shows a tax loss while cash-flowing — sheltering income. Rental losses are passive: they offset passive income freely, and up to $25,000/yr can offset ordinary (W-2) income if you actively participate and your MAGI is under $100k (phasing out to $0 by $150k); unused losses carry forward. On sale, claimed depreciation is recaptured at up to 25%, and gains may owe capital-gains tax (a 1031 exchange can defer both). Figures are a year-1 estimate at your 24.0% rate — not tax advice; consult a CPA.
Schools (NCES district)
- District
- Saginaw School District
- NCES district ID
- 2630390
- Math proficiency
- 20% ▼ -5.00%
- Reading proficiency
- 29% ▼ -3.00%
- Median HH income
- $28,940
- Composite
- 19.6/100
- National rank
- #8755
- State rank
- #444 of 540 in MI
Livability — Saginaw
- Score
- 63/100
- State rank
- #521
- US rank
- #15424
Category grades
Schools grade is shown separately in the Schools card above.
Census & demographics
- Census place
- Saginaw, MI
- County
- Saginaw County · 54,884 people
- City population
- 54,884
- Metro
- Saginaw, MI
- Population (ZIP)
- 27,127
- Household income
- $46,984
- Rent vs Own
- Severe rent burden
- 1416.0
Population outlook (Saginaw County) Hauer SSP2
- Today (2025)
- 180,568 people
- By 2030
- 172,302 · -4.6%
- By 2040
- 153,919 · -14.8%
- By 2050
- 135,519 · -24.9%
- By 2075
- 97,199 · -46.2%
- By 2100
- 65,037 · -64.0%
Race, ethnicity, and origin ACS 2023
- Neighborhood character
- Diverse neighborhood (Simpson 0.64)
- Race & ethnicity
- White 50% Black 27% Hispanic / Latino 17% Two or more races 12%
- Hispanic origin (detail)
- Mexican 14% Puerto Rican 1%
- Common ancestry
- Romanian 4% Lithuanian 3% Italian 2%
- Foreign-born
- 1% · Canada
- Languages at home
- 96% English-only · Spanish 3%
Political lean MEDSL · Saginaw
- 2024 margin
- Toss-up / Even · D 47.7% · R 51.0% · Other 1.4%
- 2008→2024 swing
- -20.6pp toward R · 2008: 17.3pp · 2024: -3.3pp
- All cycles
- 2024: R+3.3 2020: D+0.3 2016: R+1.1 2012: D+11.9 2008: D+17.3
Not yet ingested
- Civics
- —
Market trends
- HPI YoY
- ▼ -39.15%
- Current HPI
- 159.8807
- Rent YoY
- ▲ 3.98%
- Metro
- Saginaw, MI
- State GDP YoY
- ▲ 1.37%
- F500 in state
- 28
Industry mix (Fortune 500 HQ in MI)
| Industry | F500 HQs | Revenue |
|---|---|---|
| Automotive Parts | 3 | $48B |
|
||
| Automotive | 2 | $372B |
|
||
| Chemicals | 1 | $45B |
|
||
| Automotive Retail | 1 | $29B |
|
||
| Healthcare / Medical Devices | 1 | $23B |
|
||
| Automotive Technology | 1 | $20B |
|
||
Price history
+87.7% since first listed18 events — show timeline
- 2026-05-06 Listed $89,900 MiRealSource-MiMLS
- 2026-05-06 Listed $89,900 SW Michigan MLS
- 2026-05-06 Listed $89,900 REALCOMP
- 2005-11-18 Sold (Public Records) $62,700 Public Records
- 2004-11-12 Listing Removed — MiRealSource-MiMLS
- 2004-11-12 Listing Removed — REALCOMP
- 2004-05-12 Listed $59,900 MiRealSource-MiMLS
- 2004-05-12 Listed $59,900 REALCOMP
- 2004-02-25 Listing Removed — MiRealSource-MiMLS
- 2004-02-23 Sold (MLS) $25,000 REALCOMP
- 2004-02-23 Sold (MLS) $25,000 MiRealSource-MiMLS
- 2003-11-07 Listed $27,000 REALCOMP
- 2003-11-07 Listed $27,000 MiRealSource-MiMLS
- 2000-02-09 Sold (Public Records) $50,900 Public Records
- 2000-02-04 Sold (MLS) $50,900 MiRealSource-MiMLS
- 2000-02-04 Sold (MLS) $50,900 REALCOMP
- 1999-09-23 Listed $47,900 MiRealSource-MiMLS
- 1999-09-23 Listed $47,900 REALCOMP
Property tax history
+7.5%/yrLatest (2025): $2,305 · +50.5% YoY. Source: county tax records.
Cash-flow waterfall
monthlySold comps — $/sqft
last 12 mo · ≤1 miLoading sold comps…