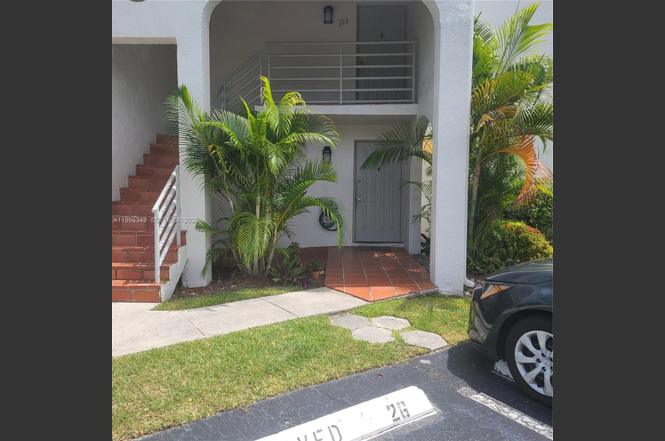
3564 Magellan Cir Unit 211-1 · Aventura, FL
Flood risk 7/10 · Major
- FEMA flood zone
- AE
- Chance of flooding over 30 yrs
- 0.94%
- Est. flood insurance / yr
- $1,737 – $8,500
Fire risk 1/10 · Minimal
- Est. fire insurance / yr
- $947 – $1,759
Heat risk 10/10 · Severe
- Hot days now (above 103°F)
- 7 days/yr
- Hot days in 30 yrs
- 28 days/yr
Wind risk 10/10 · Severe
- Chance of severe wind over 30 yrs
- 99.0%
Air-quality risk 2/10 · Minimal
- Unhealthy air days now
- 1 days/yr
- Unhealthy air days in 30 yrs
- 2 days/yr
Risk factors via First Street. Map © Google.
Why this score? — see what drove the B- grade
The composite is a weighted blend of 9 inputs, each scored 0–100. Each bar is that input's sub-score; the figure is the points it added to the 100-point composite (weight × sub-score).
- Cash flow +27.3/30.0
- 1% rule +10.0/10.0
- DSCR +9.5/10.0
- ARV discount +7.5/15.0
- Schools +5.0/10.0
- Livability +4.0/5.0
- Condition / age +2.5/5.0
- Rent growth +2.1/5.0
- Appreciation +0.0/10.0
$224,000
🖨 Deal sheet (PDF) 📄 Offer letter ✓ Due diligence
Listing remarks
LOWEST PRICE FOR A GROUND FLOOR UNIT COMPARE, #213 closed for $220K WE ARE AT BELOW MARKET VALUE TO SELL in highly sought-after Mariner Village Very large 1/2 open floor plan with separate built in den/Office, large enough for a twin bed. Open kitchen with bright breakfast nook. Large Master bedroom with dual sinks and shower/tub combination, walk-in closet with plenty of space. Community pool by the Waterways marina, best location in Aventura, just steps from the Aventura Circle and next to the Waterways shops and 5 minutes to the Aventura Mall. Walking distance to house of worship, shopping and charter schools. Gated and pet friendly community with beautiful landscaping and plenty of ope
Key facts
- Breakfast nook
- Dual sinks
- Ground floor unit
Tags
Property features AI
Finance
- Other: Association heated pool
- Financial info: Pets allowed with size limit (maximum 20 lbs)
- HOA & community: Monthly association fee; Association amenities include a pool; Association covers management, common areas, internet, structure maintenance, parking, sewer, security, trash and water
Exterior
- Parking: Assigned parking; Guest parking; One assigned space
- Security: Complex fenced; Security guard
- Utilities: Cable available
- Home design: Property faces north; Entry at level 1; Has property attached; 1 story entry level, 2 stories total
- Construction: Block construction; Resale property
- Exterior features: Open porch; Porch
Interior
- Kitchen: Dishwasher; Electric range; Disposal; Icemaker; Refrigerator; Eat-in kitchen
- Bedrooms: Bedroom on main level; Den
- Flooring: Ceramic tile; Laminate
- Bathrooms: 2 full bathrooms
- Heating & cooling: Central heating (electric); Central air conditioning (electric); Ceiling fans
- Interior features: Blinds and sliding windows; Breakfast area and eat-in kitchen; Closet cabinetry and walk-in closets; Dual sinks and tub/shower; Custom mirrors; Main living area on entry level; First-floor entry; Convertible bedroom
- Laundry & utility: Washer and dryer; Electric water heater
Neighborhood map
What this means for you Summary
Snapshot
- This is a 1-bed/2.0-bath condo listed at $224k.
Deal economics
- At list price, monthly cash flow is $219 ($3k/yr) — positive.
- The deal already cash-flows at list — no discount required.
- Meets the 1% rule at list price ($4k rent vs $224k).
- Recommended offer: $204k (9.0% below list) — sets the bar for market timing.
- Cap rate 9.8% vs local median 2.6% in Aventura — top-decile yield for the area; either an underpriced asset or a hidden risk that comps aren't pricing in. Stress-test before assuming the spread holds.
Location & tenants
- Location reads 80/100 on livability (#127 in FL, #1,834 nationally) — a professional / high-income tenant draw. Strengths: health & safety A+, amenities A, commute A; Watch: crime D+, cost of living F.
- Zoned schools: Aventura Waterways K-8 Center (math 56% / reading 65%, grade B-, #664 of 2,144 statewide, top 32%, 2,168 students, 32% FRL); Highland Oaks Middle School (math 28% / reading 51%, grade F, #373 of 571 statewide, top 66%, 774 students, 50% FRL); Dr. Michael M. Krop Senior High (math 21% / reading 46%, grade F, #400 of 667 statewide, top 61%, 2,235 students, 49% FRL).
- Market conditions: Rents soft (-1.5%/yr); 993 active listings in the ZIP; 40 comparable units currently listed for rent nearby; rentals at typical pace (median 26d on market — plan ~3-4 weeks tenant-placement turnaround); solid renter incomes; 10,051 units permitted in Miami-Dade County in 2024 (7,758 in 5+ unit buildings).
- At $3,750/mo this rent would consume 49% of the median local household income ($91k/yr) (locally 1838% of renters already pay >50% of income on rent) — very limited rent-growth headroom before tenants either downsize or default.
Forward outlook
- Local home prices are declining (-3.0%/yr); year-one equity from $2k of loan paydown is wiped out by about $7k of value loss. Plan a longer hold.
- Miami-Dade County population projected at +28% by 2050 — long-run rental-demand tailwind backs the buy-and-hold thesis.
Negotiation context
- It's been on market 102 days — a 9% lower offer ($204k) is reasonable based on typical stale-listing flexibility.
- 3 sale attempts since 2y ago with the ask held roughly flat each time — persistent listings suggest the price (not the market) is what's stuck; bring a comps-based counter.
Risks & watch-outs
- Watch-outs: flood insurance adds $427/mo; HOA is 21% of rent.
- Climate carrying-cost: in FEMA flood zone AE (mandatory federal flood insurance); severe wind risk, 99% chance of damaging wind over 30y; extreme-heat days projected 7→28/yr by 2055 (HVAC capex compounding) — expect insurance premiums to compound above CPI over the hold.
Questions for the listing agent
- It's been on market 102 days. Have you received any prior offers? Is the seller open to a 9% concession, seller financing, or rate buy-down credit?
- What's the actual annual flood-insurance premium (NFIP or private), and is the property in a SFHA with mandatory coverage?
- What does the HOA fee cover, when was the last increase, and are there any pending special assessments or reserve-fund shortfalls?
- Any open or pending special assessments — roof, HVAC, plumbing, elevator, façade? What's the per-unit balance and payoff schedule, and is the seller paying it off at close or rolling it to the buyer?
- Why hasn't it sold? Are there any deal-killer items the seller is aware of (foundation, flood, title, zoning, code violations)?
- Is there a deadline driving the sale (1031 exchange, divorce, estate, relocation)? That informs how much negotiation room exists.
- Schools are A-rated — typically a magnet for longer-tenancy family renters. What's the average tenant stay here, and is there a school-zone premium baked into asking?
- Crime grade is D in this area — have there been break-ins, vandalism, or insurance claims at this property in the last 3 years? What carrier currently insures it and at what premium?
- What's the average days-on-market for RENTAL listings here right now (not sales)? A rising rental-DOM trend means longer vacancies and softer asking-rent achievability than the comps imply.
- What's the recent tenant-quality profile in this submarket — average credit score on applications, eviction rate, late-payment / NSF rate, and stable-employment percentage? A property-management company in the area should have these aggregated.
- How much new apartment / multifamily construction is in the pipeline within 1–3 miles? Heavy new supply (>2% of stock underway) typically softens rents 12–24 months out; light construction supports rent growth.
Investment metrics
- 1% rule
- 1.67% ✓
- Cap rate
- 9.75%
- Cash-on-cash
- 12.36%
- DSCR
- 1.55
- GRM
- 5.0
CMA / ARV
No comps found within radius.
Projected returns pro-forma
-3.0% appreciation · 0.0% rent growth · sell at horizon
- IRR
- -15.3%
- Equity multiple
- 0.48×
- Total profit
- $-32,530
- Equity at exit
- $33,399
- IRR
- -19.5%
- Equity multiple
- 0.21×
- Total profit
- $-49,603
- Equity at exit
- $19,367
Cash invested: $62,720 (down + closing). Projections, not guarantees.
Landlord ↔ Tenant lean methodology
- Overall (STATE)
- 87 Strongly Landlord-Friendly
- State Florida
- 87 Strongly Landlord-Friendly · R+3
- County
- — inherits STATE
- City
- — inherits STATE
ZIP-level market 33180
- Rents YoY
- -1.5%
- Active inventory
- 993
- Price-to-rent
- 5.0×
Monthly cashflow live
- Estimated rent
- $3,750 high interval (Pro) →
- Mortgage (P&I)
- −$1,175
- Tax est. 1.5%
- −$280 /mo · $3,360/yr
- Insurance
- −$93
- Flood insurance flood zone
- −$427 /mo · $5,118/yr
- HOA
- −$769
- Vacancy / Maint / Mgmt
- −$788
- Net cashflow
- $219
Break-even live
Sensitivity live
| Price | -10% $374 | -5% $297 | +0% $219 | +5% $142 | +10% $64 |
|---|---|---|---|---|---|
| Rent | -10% $-77 | -5% $71 | +0% $219 | +5% $367 | +10% $516 |
| Rate | -1.0pp $332 | -0.5pp $276 | base $219 | +0.5pp $161 | +1.0pp $102 |
UW: 25.0% down · 7.5% · 30yr · 1.5% tax · 5.0% vac · 8.0% maint · 8.0% mgmt
Financing live
Cash to close
- Down payment
- $56,000
- Closing costs
- $6,720
- Reserves months
- —
- Total cash needed
- —
Loan-product check · same deal, 3 products live
Conventional
25% down · 7.5% · 30yr
- Down + closing
- —
- Monthly P&I
- —
- Monthly cashflow
- —
- DSCR
- —
- Eligible?
- —
Personal DTI + credit; lowest rate.
DSCR
20% down · 8.5% · 30yr
- Down + closing
- —
- Monthly P&I
- —
- Monthly cashflow
- —
- DSCR
- —
- Eligible?
- —
No personal income docs; deal must DSCR.
Hard money
10% down · 12.0% · 12mo
- Down + closing
- —
- Monthly P&I
- —
- Monthly cashflow
- —
- DSCR
- —
- Eligible?
- —
Short-term bridge; refi at stabilization.
Rent comps 40 comps
| Address | Beds | Baths | Sqft | Rent | $/sqft | DOM | Units | Dist |
|---|---|---|---|---|---|---|---|---|
| 3180 S Ocean Dr #1709 Hallandale Beach, FL | 2.0 | 2.0 | 1105 | $4,000 | $3.62 | 9d | 1 | 0.84mi |
| 3180 S Ocean Dr Hallandale Beach, FL | 2.0–3.0 | 2.0 | 1263 | $3,750 | $2.97 | 22d | 2 | 0.84mi |
| 3180 S Ocean Dr Hallandale Beach, FL | 2.0–3.0 | 2.0 | 1285 | $3,650 | $2.84 | 26d | 3 | 0.84mi |
| 3140 S Ocean Dr Hallandale Beach, FL | 2.0 | 2.0 | 1100 | $4,250 | $3.86 | 0d | 3 | 0.86mi |
| 2065 S Ocean Dr Unit 1049793P Hallandale Beach, FL | 2.0 | 2.0 | 871 | $4,971 | $5.71 | 9d | 1 | 0.87mi |
| 2080 S Ocean Dr Hallandale Beach, FL | 2.0–3.0 | 2.0–2.5 | 1270 | $3,900 | $3.07 | 26d | 7 | 0.89mi |
| 2080 S Ocean Dr Hallandale Beach, FL | 2.0–3.0 | 2.0–2.5 | 1270 | $3,800 | $2.99 | 5d | 11 | 0.89mi |
| 2080 S Ocean Dr #8 Hallandale Beach, FL | 2.0 | 2.0 | 1100 | $4,000 | $3.64 | 26d | 1 | 0.90mi |
| 1180 E Hallandale Beach Blvd Unit 1241877P Hallandale Beach, FL | 1.0–2.0 | 1.0–2.0 | 844 | $2,465 | $2.92 | 5d | 2 | 1.04mi |
| 1950 S Ocean Dr Unit 12M Hallandale Beach, FL | 1.0 | 1.5 | 870 | $3,800 | $4.37 | 4d | 1 | 1.04mi |
| 1950 S Ocean Dr Unit 12M Hallandale Beach, FL | 1.0 | 1.5 | 870 | $3,800 | $4.37 | 19d | 1 | 1.04mi |
| 1950 S Ocean Dr Unit 3D Hallandale Beach, FL | 1.0 | 1.5 | 870 | $3,950 | $4.54 | 14d | 1 | 1.04mi |
| 1950 S Ocean Dr Unit 3D Hallandale Beach, FL | 1.0 | 1.5 | 870 | $3,950 | $4.54 | 7d | 1 | 1.04mi |
| 215 SE 5th St Hallandale Beach, FL | 2.0–3.0 | 2.0 | 1133 | $2,700 | $2.38 | 26d | 5 | 1.15mi |
| 2602 E Hallandale Beach Blvd Unit 1227270P Hallandale Beach, FL | 2.0 | 1.0–2.0 | 640 | $3,224 | $5.04 | 0d | 3 | 1.19mi |
| 2602 E Hallandale Beach Blvd Hallandale Beach, FL | 1.0–2.0 | 1.0–2.0 | 1092 | $4,750 | $4.35 | 26d | 3 | 1.21mi |
| 2602 E Hallandale Beach Blvd Hallandale Beach, FL | 1.0–2.0 | 1.0–2.0 | 1070 | $4,219 | $3.94 | 22d | 4 | 1.21mi |
| 2600 E Hallandale Beach Blvd Unit T3110 Hallandale Beach, FL | 2.0 | 2.0 | 1028 | $3,650 | $3.55 | 26d | 1 | 1.21mi |
| 2600 E Hallandale Beach Blvd Unit T3307 Hallandale Beach, FL | 2.0 | 2.0 | 1030 | $4,500 | $4.37 | 26d | 1 | 1.21mi |
| 2600 E Hallandale Beach Blvd Unit T3208 Hallandale Beach, FL | 2.0 | 2.0 | 1030 | $6,950 | $6.75 | 26d | 1 | 1.21mi |
| 2601 E Hallandale Beach Blvd Unit 1227344P Hallandale Beach, FL | 1.0–2.0 | 1.0–2.0 | 844 | $2,465 | $2.92 | 3d | 2 | 1.21mi |
| 101 Diplomat Pkwy Hallandale Beach, FL | 1.0 | 1.0 | 859 | $3,740 | $4.35 | 26d | 1 | 1.22mi |
| 1850 S Ocean Dr #4009 Hallandale Beach, FL | 2.0 | 1.0 | 1086 | $3,900 | $3.59 | 26d | 1 | 1.26mi |
| 1850 S Ocean Dr #3509 Hallandale Beach, FL | 2.0 | 1.0 | 1086 | $4,000 | $3.68 | 5d | 1 | 1.26mi |
| 1850 S Ocean Dr #2909 Hallandale Beach, FL | 2.0 | 1.0 | 1086 | $4,050 | $3.73 | 26d | 1 | 1.26mi |
| 1850 S Ocean Dr #3509 Hallandale Beach, FL | 2.0 | 1.0 | 1086 | $4,300 | $3.96 | 26d | 1 | 1.26mi |
| 1830 S Ocean Dr #4212 Hallandale Beach, FL | 1.0 | 1.0 | 844 | $3,800 | $4.50 | 26d | 1 | 1.29mi |
| 1830 S Ocean Dr #3909 Hallandale Beach, FL | 1.0 | 1.0 | 844 | $5,000 | $5.92 | 26d | 1 | 1.29mi |
| 1830 S Ocean Dr #4612 Hallandale Beach, FL | 1.0 | 1.0 | 844 | $4,950 | $5.86 | 26d | 1 | 1.29mi |
| 1830 S Ocean Dr #4005 Hallandale Beach, FL | 1.0 | 1.0 | 811 | $4,600 | $5.67 | 26d | 1 | 1.29mi |
| 1830 S Ocean Dr #1709 Hallandale Beach, FL | 1.0 | 1.0 | 844 | $4,500 | $5.33 | 26d | 1 | 1.29mi |
| 1830 S Ocean Dr #4307 Hallandale Beach, FL | 1.0 | 1.0 | 871 | $4,100 | $4.71 | 26d | 1 | 1.29mi |
| 1830 S Ocean Dr #3407 Hallandale Beach, FL | 1.0 | 1.0 | 871 | $4,000 | $4.59 | 26d | 1 | 1.29mi |
| 1830 S Ocean Dr #4712 Hallandale Beach, FL | 1.0 | 1.0 | 844 | $3,950 | $4.68 | 26d | 1 | 1.29mi |
| 1830 S Ocean Dr #4309 Hallandale Beach, FL | 1.0 | 1.0 | 844 | $3,900 | $4.62 | 26d | 1 | 1.29mi |
| 1830 S Ocean Dr #1107 Hallandale Beach, FL | 1.0 | 1.0 | 871 | $3,750 | $4.31 | 26d | 1 | 1.29mi |
| 1830 S Ocean Dr #1812 Hallandale Beach, FL | 1.0 | 1.0 | 844 | $4,999 | $5.92 | 22d | 1 | 1.29mi |
| 1830 S Ocean Dr #2409 Hallandale Beach, FL | 1.0 | 1.0 | 844 | $4,300 | $5.09 | 16d | 1 | 1.29mi |
| 1830 S Ocean Dr #2412 Hallandale Beach, FL | 1.0 | 1.0 | 844 | $3,600 | $4.27 | 12d | 1 | 1.29mi |
| 1830 S Ocean Dr #4412 Hallandale Beach, FL | 1.0 | 1.0 | 844 | $4,500 | $5.33 | 9d | 1 | 1.29mi |
HOA detail condo
- Monthly dues
- $769 · $9,228/yr
- Likely covers
- waterlandscapingpoolsecurity
- Assessments
- None detected in remarks — confirm with the listing agent.
Listing history 44 events
-
2026-05-16status Pending
-
2026-05-13historical Active Under Contract
-
2026-04-12price $224,000
-
2026-02-03price $225,000
-
2026-02-03$220,000 Active
-
2026-01-31historical
-
2026-01-02price $220,000
-
2025-12-17price $225,000
-
2025-11-22price $230,000
-
2025-11-11price $235,000
-
2025-11-03price $240,000
-
2025-10-28price $242,500
-
2025-10-20price $245,000
-
2025-10-03price $247,500
-
2025-09-25price $250,000
-
2025-09-15price $254,000
-
2025-09-12price $257,000
-
2025-08-25price $260,000
-
2025-08-18price $262,000
-
2025-08-05price $265,000
-
2025-07-28price $268,000
-
2025-07-21price $270,000
-
2025-07-08price $275,000
-
2025-06-10price $280,000
-
2025-05-19price $285,000
-
2025-05-03price $290,000
-
2025-04-10price $295,000
-
2025-04-01price $305,000
-
2025-02-25price $310,000
-
2025-02-04price $315,000
-
2025-01-02price $319,000
-
2024-11-18$320,000 Active
-
2024-11-06historical
-
2024-10-21price $319,500
-
2024-09-24price $320,000
-
2024-09-18price $325,000
-
2024-09-09price $330,000
-
2024-09-04price $335,000
-
2024-08-26price $340,000
-
2024-08-20price $345,000
-
2024-08-16price $348,000
-
2024-08-05price $350,000
-
2024-07-31price $357,000
-
2024-07-10$360,000 Active
ⓘ Source: listings_history table (triggers on properties + properties_extension) + one-shot
backfill from property_details.listing_events for pre-trigger history.
Climate risk First Street
- Flood 7/10 Severe FEMA zone AE · 94% chance over 30 yrs
- Wildfire 1/10 Low
- Heat 10/10 Extreme 7 d/yr ≥103°F today · 28 d/yr by 30 yrs out
- Wind 10/10 Extreme 99% chance of damaging wind over 30 yrs
- Air quality 2/10 Low 1 unhealthy d/yr today · 2 by 30 yrs out
Nearby sold comps map
Loading sold comps map…
Walkable amenities ~0.75 mi
Loading nearby amenities…
Taxation est. · year 1
- Rental income
- $45,005
- − Mortgage interest
- −$12,547
- − Property taxes
- −$3,360
- − Insurance
- −$6,238
- − Repairs & maintenance
- −$3,600
- − Management
- −$3,600
- − HOA
- −$9,228
- − Depreciation
- −$6,516
- Taxable loss
- −$86
- Est. tax savings @ 24.0%
- +$21
- After-tax cash flow
- $2,652/yr
For passive investors: Depreciation is non-cash, so a rental often shows a tax loss while cash-flowing — sheltering income. Rental losses are passive: they offset passive income freely, and up to $25,000/yr can offset ordinary (W-2) income if you actively participate and your MAGI is under $100k (phasing out to $0 by $150k); unused losses carry forward. On sale, claimed depreciation is recaptured at up to 25%, and gains may owe capital-gains tax (a 1031 exchange can defer both). Figures are a year-1 estimate at your 24.0% rate — not tax advice; consult a CPA.
Schools (NCES district)
No district data.
Livability — Aventura
- Score
- 80/100
- State rank
- #127
- US rank
- #1834
Category grades
Schools grade is shown separately in the Schools card above.
Census & demographics
- Census place
- Aventura, FL
- County
- Miami-Dade County · 2,697,751 people
- City population
- 34,147
- Metro
- Miami-Fort Lauderdale-Pompano Beach, FL
- Population (ZIP)
- 34,147
- Household income
- $91,055
- Rent vs Own
- Severe rent burden
- 1838.0
Population outlook (Miami-Dade County) Hauer SSP2
- Today (2025)
- 3,126,439 people
- By 2030
- 3,325,765 · +6.4%
- By 2040
- 3,697,561 · +18.3%
- By 2050
- 4,012,134 · +28.3%
- By 2075
- 4,605,612 · +47.3%
- By 2100
- 4,866,598 · +55.7%
Race, ethnicity, and origin ACS 2023
- Neighborhood character
- Diverse neighborhood (Simpson 0.59)
- Race & ethnicity
- White 46% Hispanic / Latino 45% Two or more races 28% Black 2% Asian 2%
- Hispanic origin (detail)
- Mexican 2% Puerto Rican 2% Cuban 7% Dominican 1% Salvadoran 6%
- Common ancestry
- Scotch-Irish 5% Romanian 5% Italian 3%
- Foreign-born
- 52% · Canada, Jamaica, Dominican Republic
- Languages at home
- 30% English-only · Spanish 49% Other Indo-European 6% Russian/Polish/Slavic 4%
Political lean MEDSL · Miami-Dade
- 2024 margin
- R (+11.4) · D 43.9% · R 55.4%
- 2008→2024 swing
- -27.6pp toward R · 2008: 16.1pp · 2024: -11.4pp
- All cycles
- 2024: R+11.4 2020: D+7.3 2016: D+29.6 2012: D+23.7 2008: D+16.1
Not yet ingested
- Civics
- —
Market trends
- HPI YoY
- ▼ -343.81%
- Current HPI
- 234.7715
- Rent YoY
- ▼ -1.51%
- Metro
- Miami-Fort Lauderdale-Pompano Beach, FL
- State GDP YoY
- ▲ 3.28%
- F500 in state
- 36
Industry mix (Fortune 500 HQ in FL)
| Industry | F500 HQs | Revenue |
|---|---|---|
| Industrial Technology | 2 | $29B |
|
||
| Insurance | 2 | $17B |
|
||
| Retail | 1 | $60B |
|
||
| Technology Distribution | 1 | $58B |
|
||
| Homebuilding | 1 | $35B |
|
||
| Technology Manufacturing | 1 | $35B |
|
||
Price history
-37.8% since first listed44 events — show timeline
- 2026-05-16 Pending — MARMLS
- 2026-05-13 Contingent — MARMLS
- 2026-04-12 Price Changed $224,000 MARMLS
- 2026-02-03 Price Changed $225,000 MARMLS
- 2026-02-03 Listed $220,000 MARMLS
- 2026-01-31 Listing Removed — MARMLS
- 2026-01-02 Price Changed $220,000 MARMLS
- 2025-12-17 Price Changed $225,000 MARMLS
- 2025-11-22 Price Changed $230,000 MARMLS
- 2025-11-11 Price Changed $235,000 MARMLS
- 2025-11-03 Price Changed $240,000 MARMLS
- 2025-10-28 Price Changed $242,500 MARMLS
- 2025-10-20 Price Changed $245,000 MARMLS
- 2025-10-03 Price Changed $247,500 MARMLS
- 2025-09-25 Price Changed $250,000 MARMLS
- 2025-09-15 Price Changed $254,000 MARMLS
- 2025-09-12 Price Changed $257,000 MARMLS
- 2025-08-25 Price Changed $260,000 MARMLS
- 2025-08-18 Price Changed $262,000 MARMLS
- 2025-08-05 Price Changed $265,000 MARMLS
- 2025-07-28 Price Changed $268,000 MARMLS
- 2025-07-21 Price Changed $270,000 MARMLS
- 2025-07-08 Price Changed $275,000 MARMLS
- 2025-06-10 Price Changed $280,000 MARMLS
- 2025-05-19 Price Changed $285,000 MARMLS
- 2025-05-03 Price Changed $290,000 MARMLS
- 2025-04-10 Price Changed $295,000 MARMLS
- 2025-04-01 Price Changed $305,000 MARMLS
- 2025-02-25 Price Changed $310,000 MARMLS
- 2025-02-04 Price Changed $315,000 MARMLS
- 2025-01-02 Price Changed $319,000 MARMLS
- 2024-11-18 Listed $320,000 MARMLS
- 2024-11-06 Listing Removed — MARMLS
- 2024-10-21 Price Changed $319,500 MARMLS
- 2024-09-24 Price Changed $320,000 MARMLS
- 2024-09-18 Price Changed $325,000 MARMLS
- 2024-09-09 Price Changed $330,000 MARMLS
- 2024-09-04 Price Changed $335,000 MARMLS
- 2024-08-26 Price Changed $340,000 MARMLS
- 2024-08-20 Price Changed $345,000 MARMLS
- 2024-08-16 Price Changed $348,000 MARMLS
- 2024-08-05 Price Changed $350,000 MARMLS
- 2024-07-31 Price Changed $357,000 MARMLS
- 2024-07-10 Listed $360,000 MARMLS
Cash-flow waterfall
monthlySold comps — $/sqft
last 12 mo · ≤1 miLoading sold comps…