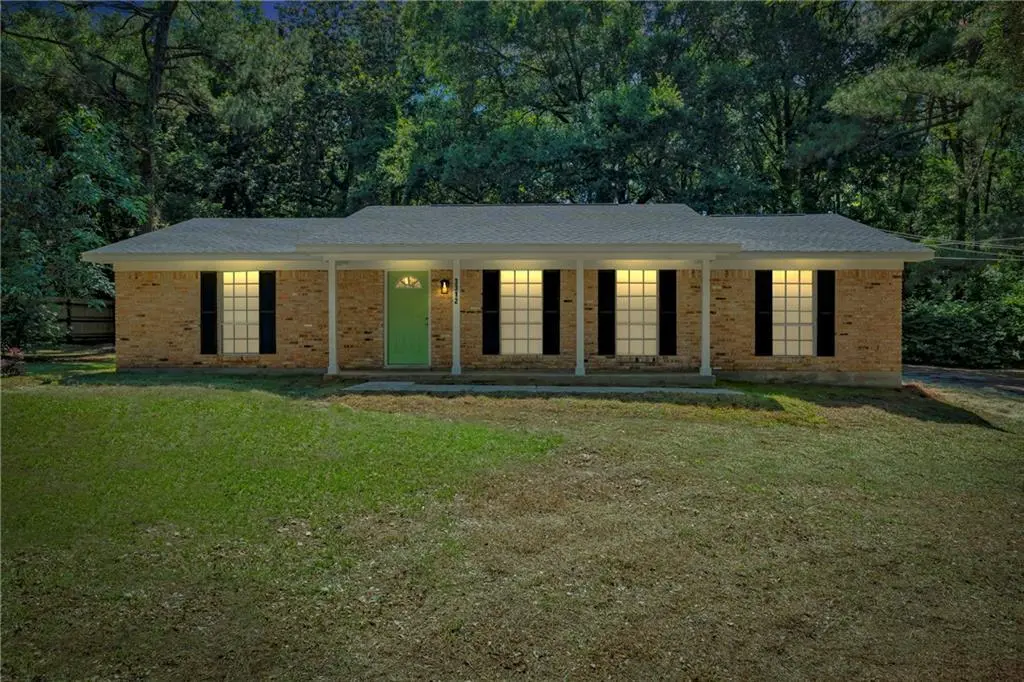
3312 Armond Dr · Mobile, AL
Flood risk 5/10 · Moderate
- FEMA flood zone
- X (unshaded)
- Chance of flooding over 30 yrs
- 0.47%
- Est. flood insurance / yr
- $507 – $1,088
Fire risk 1/10 · Minimal
- Est. fire insurance / yr
- $916 – $1,700
Heat risk 9/10 · Severe
- Hot days now (above 105°F)
- 7 days/yr
- Hot days in 30 yrs
- 20 days/yr
Wind risk 9/10 · Severe
- Chance of severe wind over 30 yrs
- 99.0%
Air-quality risk 2/10 · Minimal
- Unhealthy air days now
- 1 days/yr
- Unhealthy air days in 30 yrs
- 1 days/yr
Risk factors via First Street. Map © Google.
Why this score? — see what drove the C+ grade
The composite is a weighted blend of 9 inputs, each scored 0–100. Each bar is that input's sub-score; the figure is the points it added to the 100-point composite (weight × sub-score).
- Cash flow +27.3/30.0
- DSCR +9.5/10.0
- 1% rule +6.6/10.0
- ARV discount +5.8/15.0
- Rent growth +4.6/5.0
- Livability +3.8/5.0
- Condition / age +2.5/5.0
- Schools +2.3/10.0
- Appreciation +0.0/10.0
$179,900
🖨 Deal sheet 📄 Offer letter ✓ Due diligence
Listing remarks MLS
Investor Special! This property is perfect for an investor and has tons of potential! The property has had a new roof, new HVAC, and new flooring installed in 2024 per seller. This property sits on a large wooded lot on a non-through street. Conveniently located near interstate with easy access to Downtown Mobile and Mississippi and to Dog River. This home just needs right investor to come in to complete all renovations! Do not miss out on this opportunity!
Key facts
- Kitchen island
- Granite countertops
- Breakfast bar
Tags
Property features AI
Exterior
- Parking: Driveway
- Utilities: Cable available; Electricity available (220 volts); Natural gas available; Phone available; Public sewer; Public water
- Home design: Single family residence; Residential property
- Construction: Brick on all sides; Built in 1963; Slab foundation; Shingle roof
- Exterior features: Private yard; Exterior lighting; View
Interior
- Kitchen: Dishwasher; Electric range
- Bedrooms: 3 bedrooms
- Flooring: Ceramic tile
- Bathrooms: 2 full bathrooms
- Heating & cooling: Central heating (electric); Central air; Ceiling fan(s)
- Interior features: Double vanity; Open floorplan; Separate dining room; Breakfast bar; Additional kitchen cabinets; Eat-in kitchen; Solid surface countertops; Kitchen open to family room; No fireplace; No basement
- Laundry & utility: Gas water heater
Neighborhood map
What this means for you Summary
Snapshot
- This is a 3-bed/1.5-bath single-family listed at $180k.
Deal economics
- At list price, monthly cash flow is $522 ($6k/yr) — positive.
- The deal already cash-flows at list — no discount required.
- Meets the 1% rule at list price ($2k rent vs $180k).
- Recommended offer: $177k (1.5% below list) — sets the bar for market timing.
- Cap rate 9.8% vs local median 4.9% in Mobile — top-decile yield for the area; either an underpriced asset or a hidden risk that comps aren't pricing in. Stress-test before assuming the spread holds.
Location & tenants
- Location reads 75/100 on livability (#20 in AL, #4,262 nationally) — a middle-class / working-renter tenant base. Strengths: commute A+, cost of living A+, housing A+; Watch: crime F, employment D-.
- Mobile County (urban): math 15% / reading 39% proficiency, ranked #81 of 129 in AL (top 63%) — low school quality limits family demand, transient renter base, plan for 1-2y turnover; 67% free/reduced lunch — lower-income household profile, screen leases tightly.
- Zoned schools: Dr Robert W Gilliard Elementary (math 8% / reading 23%, grade F, #503 of 627 statewide, top 80%, 780 students, 94% FRL); Ben C Rain High School (math 2% / reading 2%, grade F, #291 of 305 statewide, top 100%, 589 students, 90% FRL) — zoned schools average 92% FRL vs 67% district-wide (25 pts higher); higher-poverty schools than district average — tighter screening recommended.
- Zoned-school proficiency averages 9% at this address vs 27% district-wide (-18 pts) — the specific schools serving this property underperform the Mobile County average; the district grade overstates school quality for this exact location.
- Market conditions: Rents rising fast (+8.3%/yr); 139 active listings in the ZIP; 4 comparable units currently listed for rent nearby; rentals at typical pace (median 21d on market — plan ~3-4 weeks tenant-placement turnaround); lower-income renter base — watch delinquency; 1,678 units permitted in Mobile County in 2024 (264 in 5+ unit buildings).
Forward outlook
- Local home prices are declining (-3.0%/yr); year-one equity from $1k of loan paydown is wiped out by about $5k of value loss. Plan a longer hold.
- Mobile County population projected to shrink 8% by 2050 — rents likely to lag national; underwrite the cash flow, not the appreciation.
- At projected returns (-3.0% appreciation + 8.0% rent growth), your $50k cash investment doubles in ~7 years — after that, you're playing with house money.
Negotiation context
- It's been on market 26 days — a 2% lower offer ($177k) is reasonable based on typical stale-listing flexibility.
- 3 sale attempts since 3y ago; this cycle's ask has dropped $20k (10%) from the opening price — seller is motivated, your offer sets the floor, not the list.
- Current owner paid $79k; list at $180k implies a 128% gain — meaningful room to come down on a strong offer.
Risks & watch-outs
- Climate carrying-cost: moderate flood risk; severe wind risk, 99% chance of damaging wind over 30y; extreme-heat days projected 7→20/yr by 2055 (HVAC capex compounding) — expect insurance premiums to compound above CPI over the hold.
Questions for the listing agent
- Built in 1963 — when were the roof, HVAC, electrical panel, plumbing, and water heater last replaced?
- Is there a deadline driving the sale (1031 exchange, divorce, estate, relocation)? That informs how much negotiation room exists.
- Schools are D-rated, which usually means shorter tenancies and higher turnover. Who's the typical renter profile here, and what's been the actual vacancy rate?
- Crime grade is F in this area — have there been break-ins, vandalism, or insurance claims at this property in the last 3 years? What carrier currently insures it and at what premium?
- What's the average days-on-market for RENTAL listings here right now (not sales)? A rising rental-DOM trend means longer vacancies and softer asking-rent achievability than the comps imply.
- What's the recent tenant-quality profile in this submarket — average credit score on applications, eviction rate, late-payment / NSF rate, and stable-employment percentage? A property-management company in the area should have these aggregated.
- How much new for-sale + rental construction is in the pipeline within 1–3 miles? Heavy new supply typically softens prices + rents 12–24 months out; constrained supply supports both.
Investment metrics
- 1% rule
- 1.16% ✓
- Cap rate
- 9.77%
- Cash-on-cash
- 12.43%
- DSCR
- 1.55
- GRM
- 7.2
CMA / ARV
- ARV (on-the-fly)
- $173,185
- Comps found
- 12
Show comp detail 12 sales within ~0.75 mi
| Address | Dist | Beds/Ba | Sqft | Sold | Price | $/sf | Match |
|---|---|---|---|---|---|---|---|
| 3312 Armond Dr | 0.00mi | 4/2.0 (+1) | 1,823 (0%) | 4mo | $79,000 | $43 | 90 |
| 3304 Armond St | 0.06mi | 3/2.0 | 1,750 (-4%) | 10mo | $166,000 | $95 | 80 |
| 2760 Gonzales Rd | 0.06mi | 3/2.0 | 1,612 (-12%) | 13mo | $197,000 | $122 | 65 |
| 3361 Riverside Dr W | 0.45mi | 3/2.0 | 1,769 (-3%) | 9mo | $166,500 | $94 | 65 |
| 3163 Morgan Rd | 0.29mi | 3/2.0 | 2,023 (+11%) | 2mo | $160,000 | $79 | 64 |
| 2713 Riverside Dr | 0.28mi | 3/2.0 | 2,000 (+10%) | 8mo | $222,000 | $111 | 62 |
| 3212 Ward Rd | 0.25mi | 2/2.5 (-1) | 1,974 (+8%) | 10mo | $275,000 | $139 | 57 |
| 3216 Morgan Rd | 0.21mi | 4/2.0 (+1) | 1,631 (-10%) | 14mo | $162,000 | $99 | 54 |
| 2700 Club House Rd | 0.18mi | 3/2.0 | 1,600 (-12%) | 19mo | $180,000 | $113 | 53 |
| 3416 FAIRFIELD Rd | 0.18mi | 3/1.0 | 1,560 (-14%) | 16mo | $45,000 | $29 | 52 |
| 2316 Reneke Ave | 0.55mi | 3/2.0 | 2,037 (+12%) | 7mo | $170,000 | $83 | 47 |
| 2732 Lost River Rd | 0.67mi | 3/2.0 | 1,669 (-8%) | 15mo | $55,000 | $33 | 40 |
Match score weights: distance 35% · size 25% · config 20% · recency 20%. Top-matched comps best support the ARV.
Projected returns pro-forma
-3.0% appreciation · 8.0% rent growth · sell at horizon
- IRR
- 7.3%
- Equity multiple
- 1.30×
- Total profit
- $15,094
- Equity at exit
- $26,824
- IRR
- 20.4%
- Equity multiple
- 3.11×
- Total profit
- $106,083
- Equity at exit
- $15,554
Cash invested: $50,372 (down + closing). Projections, not guarantees.
Landlord ↔ Tenant lean methodology
- Overall (STATE)
- 90 Strongly Landlord-Friendly
- State Alabama
- 90 Strongly Landlord-Friendly · R+15
- County
- — inherits STATE
- City
- — inherits STATE
ZIP-level market 36605
- Rents YoY
- 8.3%
- Active inventory
- 139
- Price-to-rent
- 7.2×
Monthly cashflow live
- Estimated rent
- $2,091 medium interval (Pro) →
- Mortgage (P&I)
- −$943
- Tax from tax record
- −$112 /mo · $1,344/yr
- Insurance
- −$75
- HOA
- −$0
- Vacancy / Maint / Mgmt
- −$439
- Net cashflow
- $522
Break-even live
UW: 25.0% down · 7.5% · 30yr · 1.5% tax · 5.0% vac · 8.0% maint · 8.0% mgmt
Financing live
Cash to close
- Down payment
- $44,975
- Closing costs
- $5,397
- Reserves months
- —
- Total cash needed
- —
Loan-product check · same deal, 3 products live
Conventional
25% down · 7.5% · 30yr
- Down + closing
- —
- Monthly P&I
- —
- Monthly cashflow
- —
- DSCR
- —
- Eligible?
- —
Personal DTI + credit; lowest rate.
DSCR
20% down · 8.5% · 30yr
- Down + closing
- —
- Monthly P&I
- —
- Monthly cashflow
- —
- DSCR
- —
- Eligible?
- —
No personal income docs; deal must DSCR.
Hard money
10% down · 12.0% · 12mo
- Down + closing
- —
- Monthly P&I
- —
- Monthly cashflow
- —
- DSCR
- —
- Eligible?
- —
Short-term bridge; refi at stabilization.
Rent comps 4 comps
| Address | Beds | Baths | Sqft | Rent | $/sqft | DOM | Units | Dist |
|---|---|---|---|---|---|---|---|---|
| 3210 Ward Rd Unit 1043617P Mobile, AL | 3.0 | 2.0 | 1593 | $2,395 | $1.50 | 13d | 1 | 0.27mi |
| 3512 Shadowwood Ct Mobile, AL | 4.0 | 3.5 | 2514 | $3,295 | $1.31 | 21d | 1 | 1.17mi |
| 1806 Gill Rd Mobile, AL | 3.0 | 2.0 | 1360 | $1,250 | $0.92 | 21d | 1 | 1.21mi |
| 1854 Jacob Dr Unit Jacob Dr unit Mobile, AL | 4.0 | 2.0 | 1700 | $1,950 | $1.15 | 43d | 1 | 1.37mi |
Listing history 22 events
-
2026-06-15status $179,900 Pending 26 DOM
-
2026-06-15days on market $179,900 Active 26 DOM
-
2026-06-14days on market $179,900 Active 24 DOM
-
2026-06-13pricedays on market $179,900 Active 23 DOM
-
2026-06-10days on market $184,900 Active 21 DOM
-
2026-06-09pricedays on market $184,900 Active 20 DOM
-
2026-06-08days on market $189,900 Active 19 DOM
-
2026-06-07days on market $189,900 Active 18 DOM
-
2026-06-05days on market $189,900 Active 15 DOM
-
2026-06-03days on market $189,900 Active 14 DOM
-
2026-06-02days on market $189,900 Active 13 DOM
-
2026-06-01days on market $189,900 Active 12 DOM
-
2026-05-31days on market $189,900 Active 11 DOM
-
2026-05-30pricedays on market $189,900 Active 10 DOM
-
2026-05-24status Active
-
2026-05-21status Pending
-
2026-05-17$199,900 Active
-
2026-03-03soldstatus $79,000
-
2026-02-27soldstatus $79,000 Closed 461-char remark
Show marketing remark (461 chars)
Investor Special! This property is perfect for an investor and has tons of potential! The property has had a new roof, new HVAC, and new flooring installed in 2024 per seller. This property sits on a large wooded lot on a non-through street. Conveniently located near interstate with easy access to Downtown Mobile and Mississippi and to Dog River. This home just needs right investor to come in to complete all renovations! Do not miss out on this opportunity!
-
2023-12-18soldstatus $99,000 Closed 365-char remark
Show marketing remark (365 chars)
This 4 bedroom 2 bath home on a large lot with lots of privacy can be yours today. Over 1800 square feet with kitchen, laundry, living and dining rooms. 2 small storage sheds are out back and the yard was once landscaped and beautiful. Bring your dreams, some TLC love, diy skills, and build some sweat equity in a solid brick home. Call for your appointment today.
-
2023-10-26status Pending 365-char remark
Show marketing remark (365 chars)
This 4 bedroom 2 bath home on a large lot with lots of privacy can be yours today. Over 1800 square feet with kitchen, laundry, living and dining rooms. 2 small storage sheds are out back and the yard was once landscaped and beautiful. Bring your dreams, some TLC love, diy skills, and build some sweat equity in a solid brick home. Call for your appointment today.
-
2023-09-29$104,000 Active 365-char remark
Show marketing remark (365 chars)
This 4 bedroom 2 bath home on a large lot with lots of privacy can be yours today. Over 1800 square feet with kitchen, laundry, living and dining rooms. 2 small storage sheds are out back and the yard was once landscaped and beautiful. Bring your dreams, some TLC love, diy skills, and build some sweat equity in a solid brick home. Call for your appointment today.
ⓘ Source: listings_history table (triggers on properties + properties_extension) + one-shot
backfill from property_details.listing_events for pre-trigger history.
Tax reassessment forecast AL · Resets to sale price
- Current annual tax
- $1,344 · $112/mo
- Projected year-2 tax
- $1,344 · $112/mo
- Expected delta
- $0/yr ($0/mo · 0.0%)
ⓘ Screening estimate from a state-policy table — verify with the county assessor before closing.
Climate risk First Street
- Flood 5/10 Major FEMA zone X (unshaded) · 47% chance over 30 yrs
- Wildfire 1/10 Low
- Heat 9/10 Extreme 7 d/yr ≥105°F today · 20 d/yr by 30 yrs out
- Wind 9/10 Extreme 99% chance of damaging wind over 30 yrs
- Air quality 2/10 Low 1 unhealthy d/yr today · 1 by 30 yrs out
Nearby sold comps map
Loading sold comps map…
Walkable amenities ~0.75 mi
Loading nearby amenities…
Taxation est. · year 1
- Rental income
- $25,095
- − Mortgage interest
- −$10,077
- − Property taxes
- −$1,344
- − Insurance
- −$900
- − Repairs & maintenance
- −$2,008
- − Management
- −$2,008
- − Depreciation
- −$5,233
- Taxable income
- $3,526
- Est. tax owed @ 24.0%
- −$846
- After-tax cash flow
- $5,415/yr
For passive investors: Depreciation is non-cash, so a rental often shows a tax loss while cash-flowing — sheltering income. Rental losses are passive: they offset passive income freely, and up to $25,000/yr can offset ordinary (W-2) income if you actively participate and your MAGI is under $100k (phasing out to $0 by $150k); unused losses carry forward. On sale, claimed depreciation is recaptured at up to 25%, and gains may owe capital-gains tax (a 1031 exchange can defer both). Figures are a year-1 estimate at your 24.0% rate — not tax advice; consult a CPA.
Schools (NCES district)
- District
- Mobile County
- NCES district ID
- 0102370
- Math proficiency
- 15% ▼ -28.00%
- Reading proficiency
- 39% ▬ 0.00%
- Median HH income
- $42,455
- Composite
- 22.9/100
- National rank
- #8002
- State rank
- #81 of 129 in AL
Livability — Mobile
- Score
- 75/100
- State rank
- #20
- US rank
- #4262
Category grades
Schools grade is shown separately in the Schools card above.
Census & demographics
- Census place
- Mobile, AL
- County
- Mobile County · 246,577 people
- City population
- 205,729
- Metro
- Mobile, AL
- Population (ZIP)
- 25,104
- Household income
- $43,538
- Rent vs Own
- Severe rent burden
- 1521.0
Population outlook (Mobile County) Hauer SSP2
- Today (2025)
- 415,303 people
- By 2030
- 411,755 · -0.9%
- By 2040
- 399,670 · -3.8%
- By 2050
- 382,616 · -7.9%
- By 2075
- 337,353 · -18.8%
- By 2100
- 283,391 · -31.8%
Race, ethnicity, and origin ACS 2023
- Neighborhood character
- Predominantly Black (67%)
- Race & ethnicity
- Black 67% White 27% Two or more races 4% Hispanic / Latino 3%
- Common ancestry
- Lithuanian 3% Slovak 2% Iranian 1%
- Foreign-born
- 3% · Canada
- Languages at home
- 97% English-only · Spanish 2%
Political lean MEDSL · Mobile
- 2024 margin
- R (+16.4) · D 41.3% · R 57.7%
- 2008→2024 swing
- -7.7pp toward R · 2008: -8.7pp · 2024: -16.4pp
- All cycles
- 2024: R+16.4 2020: R+11.9 2016: R+13.9 2012: R+9.3 2008: R+8.7
Not yet ingested
- Civics
- —
Market trends
- HPI YoY
- ▼ -96.46%
- Current HPI
- 125.9526
- Rent YoY
- ▲ 8.26%
- Metro
- Mobile, AL
- State GDP YoY
- ▲ 2.94%
- F500 in state
- 4
Industry mix (Fortune 500 HQ in AL)
| Industry | F500 HQs | Revenue |
|---|---|---|
| Financial Services | 1 | $8B |
|
||
| Healthcare | 1 | $5B |
|
||
Price history
+92.2% since first listed8 events — show timeline
- 2026-05-24 Relisted — GCMLS AL
- 2026-05-21 Pending — GCMLS AL
- 2026-05-17 Listed $199,900 GCMLS AL
- 2026-03-03 Sold (Public Records) $79,000 Public Records
- 2026-02-27 Sold (MLS) $79,000 GCMLS AL
- 2023-12-18 Sold (MLS) $99,000 GCMLS AL
- 2023-10-26 Pending — GCMLS AL
- 2023-09-29 Listed $104,000 GCMLS AL
Property tax history
+8.8%/yrLatest (2025): $1,344 · +5.2% YoY. Source: county tax records.
Cash-flow waterfall
monthlySold comps — $/sqft
last 12 mo · ≤1 miLoading sold comps…