 Triplex
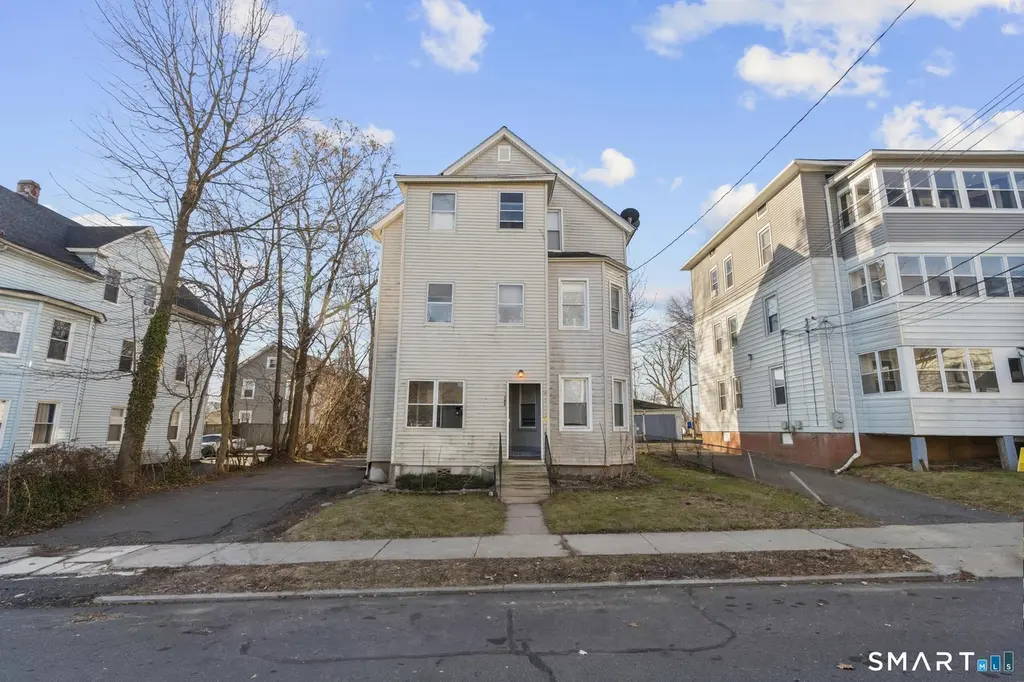
105 Rhodes St · New Britain, CT
Flood risk No data
- FEMA flood zone
- —
- Chance of flooding over 30 yrs
- —
- Est. flood insurance / yr
- —
Fire risk No data
- Est. fire insurance / yr
- —
Heat risk No data
- Hot days now (above threshold)
- —
- Hot days in 30 yrs
- —
Wind risk No data
- Chance of severe wind over 30 yrs
- —
Air-quality risk No data
- Unhealthy air days now
- —
- Unhealthy air days in 30 yrs
- —
Risk factors via First Street. Map © Google.
Why this score? — see what drove the C grade
The composite is a weighted blend of 9 inputs, each scored 0–100. Each bar is that input's sub-score; the figure is the points it added to the 100-point composite (weight × sub-score).
- Cash flow +21.4/30.0
- Appreciation +10.0/10.0
- DSCR +6.8/10.0
- 1% rule +5.7/10.0
- ARV discount +4.3/15.0
- Livability +3.7/5.0
- Condition / age +2.5/5.0
- Rent growth +2.4/5.0
- Schools +1.0/10.0
$425,000
🖨 Deal sheet (PDF) 📄 Offer letter ✓ Due diligence
Multi-family units
County records classify this as Multi-Family (2-4 Unit). Listing-text estimate: 3 units. confirmed
Listing remarks MLS
Turnkey three-family investment opportunity in New Britain. This well-maintained property features three updated units, each offering 2 bedrooms and 1 full bathroom, with separate utilities for each unit paid by the tenants. The building has been consistently maintained and offers a strong, reliable rental setup ideal for investors or owner-occupants alike. Conveniently located near shopping, dining, major highways, and public transportation, this multifamily provides solid cash flow potential with opportunity for future growth. A great option for both seasoned investors looking to add to their portfolio and buyers seeking an owner-occupied investment property.
Key facts
- 5,227 sq ft lot
- Built 1904
- Listed 47 days
Neighborhood map
What this means for you Summary
Snapshot
- This is a 3 × 2-bed/1.0-bath units multifamily listed at $425k.
Deal economics
- At list price, monthly cash flow is $628 ($8k/yr) — positive. Per door: $209/mo.
- The deal already cash-flows at list — no discount required.
- Meets the 1% rule at list price ($5k rent vs $425k).
- Recommended offer: $412k (3.0% below list) — sets the bar for market timing.
- Cap rate 8.1% vs local median 4.4% in New Britain — top-decile yield for the area; either an underpriced asset or a hidden risk that comps aren't pricing in. Stress-test before assuming the spread holds.
Location & tenants
- Location reads 74/100 on livability (#67 in CT, #4,936 nationally) — a middle-class / working-renter tenant base. Strengths: health & safety A+, cost of living A, housing A; Watch: crime D, employment D, schools F.
- New Britain School District (suburban): math 6% / reading 17% proficiency, ranked #153 of 153 in CT (top 100%) — low school quality limits family demand, transient renter base, plan for 1-2y turnover; 71% free/reduced lunch — lower-income household profile, screen leases tightly.
- Market conditions: Rents soft (-0.6%/yr); 63 active listings in the ZIP; 1 comparable units currently listed for rent nearby; 1,867 units permitted in Capitol Planning Region in 2024 (1,399 in 5+ unit buildings).
- At $4,550/mo this rent would consume 107% of the median local household income ($51k/yr) (locally 2100% of renters already pay >50% of income on rent) — very limited rent-growth headroom before tenants either downsize or default.
Forward outlook
- In year one you build about $45k of equity ($3k loan paydown + $42k appreciation (10.0% local appreciation)).
- At projected returns (10.0% appreciation + 0.0% rent growth), your $119k cash investment doubles in ~3 years — after that, you're playing with house money.
- By year 2, paydown + projected appreciation supports a ~$73k cash-out refi (75% LTV) — recoverable capital for the next deal without selling this one.
Negotiation context
- It's been on market 47 days — a 3% lower offer ($412k) is reasonable based on typical stale-listing flexibility.
- 2 sale attempts since 20y ago with the ask held roughly flat each time — persistent listings suggest the price (not the market) is what's stuck; bring a comps-based counter.
- Current owner paid $310k; 37% above their basis — modest negotiation headroom, anchor on the comps not their cost.
Risks & watch-outs
- Watch-outs: built in 1904 — expect roof / HVAC / electrical / plumbing capex.
Questions for the listing agent
- It's been on market 47 days. Have you received any prior offers? Is the seller open to a 3% concession, seller financing, or rate buy-down credit?
- Can we see the unit-by-unit rent roll, current vacancy, and any below-market leases? What's the average tenancy length?
- What capital expenditures (roof, boiler, parking lot, exteriors) have been made in the last 5 years, and what's planned in the next 2?
- Built in 1904 — when were the roof, HVAC, electrical panel, plumbing, and water heater last replaced?
- Is there a deadline driving the sale (1031 exchange, divorce, estate, relocation)? That informs how much negotiation room exists.
- Schools are F-rated, which usually means shorter tenancies and higher turnover. Who's the typical renter profile here, and what's been the actual vacancy rate?
- Crime grade is D in this area — have there been break-ins, vandalism, or insurance claims at this property in the last 3 years? What carrier currently insures it and at what premium?
- What's the average days-on-market for RENTAL listings here right now (not sales)? A rising rental-DOM trend means longer vacancies and softer asking-rent achievability than the comps imply.
- What's the recent tenant-quality profile in this submarket — average credit score on applications, eviction rate, late-payment / NSF rate, and stable-employment percentage? A property-management company in the area should have these aggregated.
- How much new apartment / multifamily construction is in the pipeline within 1–3 miles? Heavy new supply (>2% of stock underway) typically softens rents 12–24 months out; light construction supports rent growth.
Investment metrics
- 1% rule
- 1.07% ✓
- Cap rate
- 8.07%
- Cash-on-cash
- 6.33%
- DSCR
- 1.28
- GRM
- 7.8
CMA / ARV
- ARV (median comp)
- $396,376
- List price
- $425,000
- Delta
- 7.22%
- Verdict
- FAIR
- Comps
- 20 within 1.0 mi
Show comp detail 12 sales within ~0.75 mi
| Address | Dist | Beds/Ba | Sqft | Sold | Price | $/sf | Match |
|---|---|---|---|---|---|---|---|
| 267 Chapman St | 0.05mi | 5/3.0 (-1) | 2,318 (+8%) | 8mo | $360,000 | $155 | 73 |
| 144 Dwight St | 0.30mi | 6/3.0 | 2,033 (-5%) | 5mo | $340,000 | $167 | 73 |
| 11 Dwight Ct | 0.45mi | 6/3.0 | 2,210 (+3%) | 3mo | $290,000 | $131 | 72 |
| 62 Belden St | 0.22mi | 6/2.0 | 2,124 (-1%) | 15mo | $395,000 | $186 | 72 |
| 408 East St | 0.45mi | 6/4.0 | 2,231 (+4%) | 9mo | $440,000 | $197 | 62 |
| 106 Judd Ave | 0.45mi | 6/2.0 | 2,184 (+2%) | 14mo | $225,000 | $103 | 61 |
| 115 Belden St | 0.21mi | 6/2.0 | 2,326 (+8%) | 15mo | $700,000 | $301 | 60 |
| 241 Belden St | 0.30mi | 6/2.0 | 2,332 (+9%) | 13mo | $436,000 | $187 | 57 |
| 237 Belden St | 0.29mi | 6/2.0 | 2,332 (+9%) | 18mo | $400,000 | $172 | 53 |
| 119 Thorniley St | 0.58mi | 6/2.0 | 2,052 (-4%) | 18mo | $318,000 | $155 | 47 |
| 18 Fairview St | 0.62mi | 5/2.0 (-1) | 1,878 (-12%) | 19mo | $410,000 | $218 | 25 |
| 498 Stanley St | 0.69mi | 5/3.0 (-1) | 2,466 (+15%) | 18mo | $290,000 | $118 | 23 |
Match score weights: distance 35% · size 25% · config 20% · recency 20%. Top-matched comps best support the ARV.
Projected returns pro-forma
10.0% appreciation · 0.0% rent growth · sell at horizon
- IRR
- 27.7%
- Equity multiple
- 3.17×
- Total profit
- $258,217
- Equity at exit
- $382,874
- IRR
- 23.3%
- Equity multiple
- 6.93×
- Total profit
- $705,248
- Equity at exit
- $825,682
Cash invested: $119,000 (down + closing). Projections, not guarantees.
Landlord ↔ Tenant lean methodology
- Overall (STATE)
- 27 Tenant-Leaning
- State Connecticut
- 27 Tenant-Leaning · D+7
- County
- — inherits STATE
- City
- — inherits STATE
ZIP-level market 06051
- Home prices YoY
- 9.0%
- Rents YoY
- -0.6%
- Active inventory
- 63
- Price-to-rent
- 23.4×
Monthly cashflow live
- Estimated rent
- $4,550 high interval (Pro) →
- Mortgage (P&I)
- −$2,229
- Tax from tax record
- −$561 /mo · $6,728/yr
- Insurance
- −$177
- HOA
- −$0
- Vacancy / Maint / Mgmt
- −$956
- Net cashflow
- $628
Break-even live
Sensitivity live
| Price | -10% $869 | -5% $748 | +0% $628 | +5% $508 | +10% $387 |
|---|---|---|---|---|---|
| Rent | -10% $269 | -5% $448 | +0% $628 | +5% $808 | +10% $987 |
| Rate | -1.0pp $842 | -0.5pp $736 | base $628 | +0.5pp $518 | +1.0pp $406 |
3-unit breakdown (identical units grouped — click to expand)
| Units | Beds | Baths | Est. rent |
|---|---|---|---|
| 3× units | 2 | 1 | $4,551 |
| #1 | 2 | 1 | $1,517 |
| #2 | 2 | 1 | $1,517 |
| #3 | 2 | 1 | $1,517 |
| Total (3 units) | $4,550 | ||
UW: 25.0% down · 7.5% · 30yr · 1.5% tax · 5.0% vac · 8.0% maint · 8.0% mgmt
Financing live
Cash to close
- Down payment
- $106,250
- Closing costs
- $12,750
- Reserves months
- —
- Total cash needed
- —
Loan-product check · same deal, 3 products live
Conventional
25% down · 7.5% · 30yr
- Down + closing
- —
- Monthly P&I
- —
- Monthly cashflow
- —
- DSCR
- —
- Eligible?
- —
Personal DTI + credit; lowest rate.
DSCR
20% down · 8.5% · 30yr
- Down + closing
- —
- Monthly P&I
- —
- Monthly cashflow
- —
- DSCR
- —
- Eligible?
- —
No personal income docs; deal must DSCR.
Hard money
10% down · 12.0% · 12mo
- Down + closing
- —
- Monthly P&I
- —
- Monthly cashflow
- —
- DSCR
- —
- Eligible?
- —
Short-term bridge; refi at stabilization.
Rent comps 1 comps
| Address | Beds | Baths | Sqft | Rent | $/sqft | DOM | Units | Dist |
|---|---|---|---|---|---|---|---|---|
| 45 Union St New Britain, CT | 5.0 | 2.0 | 2060 | $2,800 | $1.36 | 24d | 1 | 0.89mi |
Listing history 9 events
-
2026-05-06status Under Contract 669-char remark
Show marketing remark (669 chars)
Turnkey three-family investment opportunity in New Britain. This well-maintained property features three updated units, each offering 2 bedrooms and 1 full bathroom, with separate utilities for each unit paid by the tenants. The building has been consistently maintained and offers a strong, reliable rental setup ideal for investors or owner-occupants alike. Conveniently located near shopping, dining, major highways, and public transportation, this multifamily provides solid cash flow potential with opportunity for future growth. A great option for both seasoned investors looking to add to their portfolio and buyers seeking an owner-occupied investment property.
-
2026-03-21$425,000 Active 669-char remark
Show marketing remark (669 chars)
Turnkey three-family investment opportunity in New Britain. This well-maintained property features three updated units, each offering 2 bedrooms and 1 full bathroom, with separate utilities for each unit paid by the tenants. The building has been consistently maintained and offers a strong, reliable rental setup ideal for investors or owner-occupants alike. Conveniently located near shopping, dining, major highways, and public transportation, this multifamily provides solid cash flow potential with opportunity for future growth. A great option for both seasoned investors looking to add to their portfolio and buyers seeking an owner-occupied investment property.
-
2026-03-18historical $425,000 669-char remark
Show marketing remark (669 chars)
Turnkey three-family investment opportunity in New Britain. This well-maintained property features three updated units, each offering 2 bedrooms and 1 full bathroom, with separate utilities for each unit paid by the tenants. The building has been consistently maintained and offers a strong, reliable rental setup ideal for investors or owner-occupants alike. Conveniently located near shopping, dining, major highways, and public transportation, this multifamily provides solid cash flow potential with opportunity for future growth. A great option for both seasoned investors looking to add to their portfolio and buyers seeking an owner-occupied investment property.
-
2023-03-23soldstatus $310,000
-
2022-07-25soldstatus $240,000
-
2006-08-31soldstatus $217,000
-
2006-08-31soldstatus $217,000
-
2006-08-25$225,888
-
2005-05-10soldstatus $75,000
ⓘ Source: listings_history table (triggers on properties + properties_extension) + one-shot
backfill from property_details.listing_events for pre-trigger history.
Tax reassessment forecast CT · Partial reset (capped growth)
- Current annual tax
- $6,728 · $561/mo
- Projected year-2 tax
- $7,912 · $659/mo
- Expected delta
- +$1,184/yr (+$99/mo · 17.6%)
ⓘ Screening estimate from a state-policy table — verify with the county assessor before closing.
Nearby sold comps map
Loading sold comps map…
Walkable amenities ~0.75 mi
Loading nearby amenities…
Taxation est. · year 1
- Rental income
- $54,600
- − Mortgage interest
- −$23,807
- − Property taxes
- −$6,728
- − Insurance
- −$2,125
- − Repairs & maintenance
- −$4,368
- − Management
- −$4,368
- − Depreciation
- −$12,364
- Taxable income
- $841
- Est. tax owed @ 24.0%
- −$202
- After-tax cash flow
- $7,334/yr
For passive investors: Depreciation is non-cash, so a rental often shows a tax loss while cash-flowing — sheltering income. Rental losses are passive: they offset passive income freely, and up to $25,000/yr can offset ordinary (W-2) income if you actively participate and your MAGI is under $100k (phasing out to $0 by $150k); unused losses carry forward. On sale, claimed depreciation is recaptured at up to 25%, and gains may owe capital-gains tax (a 1031 exchange can defer both). Figures are a year-1 estimate at your 24.0% rate — not tax advice; consult a CPA.
Schools (NCES district)
- District
- New Britain School District
- NCES district ID
- 0902670
- Math proficiency
- 6% ▼ -6.00%
- Reading proficiency
- 17% ▼ -5.00%
- Median HH income
- $40,827
- Composite
- 9.95/100
- National rank
- #9816
- State rank
- #153 of 153 in CT
Livability — New Britain
- Score
- 74/100
- State rank
- #67
- US rank
- #4936
Category grades
Schools grade is shown separately in the Schools card above.
Census & demographics
- Census place
- New Britain, CT
- County
- Hartford County · 754,208 people
- City population
- 66,322
- Metro
- Hartford-East Hartford-Middletown, CT
- Population (ZIP)
- 29,548
- Household income
- $51,022
- Rent vs Own
- Severe rent burden
- 2100.0
Population outlook (Capitol County) Hauer SSP2
- By 2040
- 1,063,519
Race, ethnicity, and origin ACS 2023
- Neighborhood character
- Diverse neighborhood (Simpson 0.63)
- Race & ethnicity
- Hispanic / Latino 52% White 30% Two or more races 17% Black 11% Asian 2%
- Hispanic origin (detail)
- Mexican 2% Puerto Rican 40% Dominican 4%
- Common ancestry
- Romanian 7% Lithuanian 6% Slovak 1%
- Foreign-born
- 15% · Canada, Jamaica
- Languages at home
- 51% English-only · Spanish 39% Russian/Polish/Slavic 6% Arabic 3%
Political lean MEDSL · Capitol
- 2024 margin
- Strong D (+21.9) · D 60.1% · R 38.2% · Other 1.7%
- All cycles
- 2024: D+21.9
Not yet ingested
- Civics
- —
Market trends
- HPI YoY
- ▲ 31.52%
- Current HPI
- 382.7816
- Rent YoY
- ▼ -0.58%
- Metro
- Hartford-East Hartford-Middletown, CT
- State GDP YoY
- ▲ 1.06%
- F500 in state
- 38
Industry mix (Fortune 500 HQ in CT)
| Industry | F500 HQs | Revenue |
|---|---|---|
| Industrial Machinery | 4 | $38B |
|
||
| Insurance | 3 | $71B |
|
||
| Financial Services | 2 | $25B |
|
||
| Transportation / Logistics | 2 | $18B |
|
||
| Healthcare | 1 | $247B |
|
||
| Telecommunications | 1 | $55B |
|
||
Price history
+466.7% since first listed9 events — show timeline
- 2026-05-06 Pending — Smart MLS
- 2026-03-21 Listed $425,000 Smart MLS
- 2026-03-18 Coming Soon $425,000 Smart MLS
- 2023-03-23 Sold (Public Records) $310,000 Public Records
- 2022-07-25 Sold (Public Records) $240,000 Public Records
- 2006-08-31 Sold (Public Records) $217,000 Public Records
- 2006-08-31 Sold (MLS) $217,000 Smart MLS
- 2006-08-25 Listed $225,888 Smart MLS
- 2005-05-10 Sold (Public Records) $75,000 Public Records
Property tax history
+3.7%/yrLatest (2025): $6,728 · +2.4% YoY. Source: county tax records.
Cash-flow waterfall
monthlySold comps — $/sqft
last 12 mo · ≤1 miLoading sold comps…