 Duplex
5621/5623 Fourth Ave · Pine Manor, FL
Flood risk 7/10 · Major
- FEMA flood zone
- X (shaded)
- Chance of flooding over 30 yrs
- 0.73%
- Est. flood insurance / yr
- $507 – $1,088
Fire risk 1/10 · Minimal
- Est. fire insurance / yr
- $947 – $1,759
Heat risk 10/10 · Severe
- Hot days now (above 107°F)
- 7 days/yr
- Hot days in 30 yrs
- 31 days/yr
Wind risk 10/10 · Severe
- Chance of severe wind over 30 yrs
- 99.0%
Air-quality risk 2/10 · Minimal
- Unhealthy air days now
- 1 days/yr
- Unhealthy air days in 30 yrs
- 1 days/yr
Risk factors via First Street. Map © Google.
Why this score? — see what drove the D+ grade
The composite is a weighted blend of 9 inputs, each scored 0–100. Each bar is that input's sub-score; the figure is the points it added to the 100-point composite (weight × sub-score).
- Cash flow +16.4/30.0
- ARV discount +12.0/15.0
- DSCR +5.1/10.0
- 1% rule +4.5/10.0
- Schools +4.1/10.0
- Condition / age +3.8/5.0
- Livability +3.2/5.0
- Rent growth +0.1/5.0
- Appreciation +0.0/10.0
$264,000
🖨 Deal sheet 📄 Offer letter ✓ Due diligence
Multi-family units
County records classify this as Multi-Family (2-4 Unit). Listing-text estimate: 2 units. confirmed
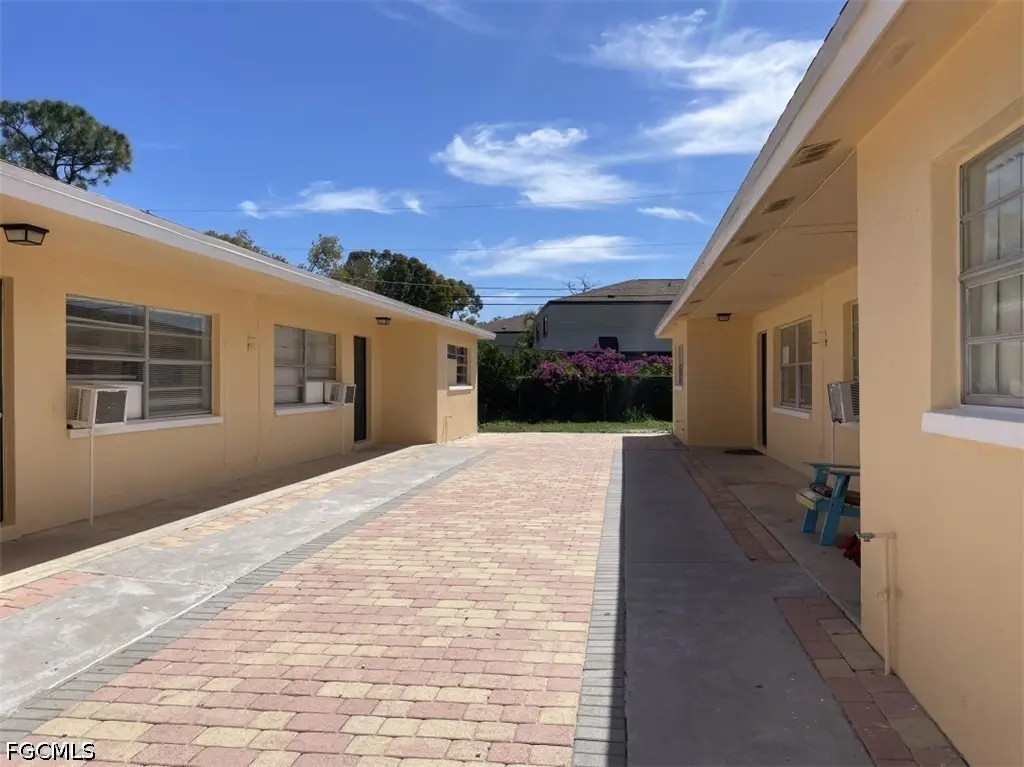
Listing remarks
Well maintained Duplex 2 bedrooms1 bath each side. The property features a Beautiful new kitchen, Central AC and window AC all good working condition and newer water heater, all floor ceramic tiles throughout and. freshly painted interior and exterior.
Key facts
- 6,011 sq ft lot
- Built 1973
- Listed 10 days
Property features AI
Finance
- Other: Lot dimensions approximately 148 x 50 x 50 x 148
- Financial info: Each unit currently rents for $1,300 (actual and pro forma); Units appear unfurnished; Tenant pays cable and water; Pets allowed
- HOA & community: No association fee
Exterior
- Parking: Parking details not provided
- Security: No security features listed
- Utilities: Public water; Public sewer; Cable available
- Home design: Single-story multifamily building (2 units); Resale property; Zoned TFC-2
- Construction: Block, concrete and stucco construction; Shingle roof
- Exterior features: Patio; Paved road access; Rectangular lot
Interior
- Kitchen: Range; Refrigerator
- Bedrooms: Two 2-bedroom units (each unit described with a great room)
- Flooring: Tile
- Bathrooms: Each unit has 1 full bathroom (2 full bathrooms total)
- Heating & cooling: Central heating (electric); Central air (electric); Window air unit(s)
- Interior features: Single-hung windows; Tile flooring
- Laundry & utility: Tenant pays water
Neighborhood map
What this means for you Summary
Snapshot
- This is a 2 × 2-bed/1.0-bath units multifamily listed at $264k. Condition is rated good.
Deal economics
- At list price, monthly cash flow is $82 ($981/yr) — positive. Per door: $41/mo.
- The deal already cash-flows at list — no discount required.
- To meet the 1% rule (rent ≥ 1% of price), the offer needs to be $250k (5.4% below list).
- Recommended offer: $250k (5.4% below list) — sets the bar for 1% rule.
Location & tenants
- Location reads 64/100 on livability (#695 in FL) — a middle-class / working-renter tenant base. Strengths: cost of living A+, health & safety A+, housing A-; Watch: schools F, amenities F, commute F.
- Lee (suburban): math 47% / reading 50% proficiency, ranked #42 of 73 in FL (top 58%) — families likely to look elsewhere, expect single-tenant / working-renter base with shorter leases.
- Market conditions: Rents falling (-9.7%/yr); 346 active listings in the ZIP; 19 comparable units currently listed for rent nearby; rentals at typical pace (median 24d on market — plan ~3-4 weeks tenant-placement turnaround); 15,411 units permitted in Lee County in 2024 (4,686 in 5+ unit buildings).
- At $2,497/mo this rent would consume 57% of the median local household income ($52k/yr) (locally 1960% of renters already pay >50% of income on rent) — very limited rent-growth headroom before tenants either downsize or default.
Forward outlook
- Local home prices are declining (-3.0%/yr); year-one equity from $2k of loan paydown is wiped out by about $8k of value loss. Plan a longer hold.
- Lee County population projected at +44% by 2050 — long-run rental-demand tailwind backs the buy-and-hold thesis.
Negotiation context
- Only 10 days on market — expect competitive offers; lowballing is unlikely to land.
Risks & watch-outs
- Watch-outs: flood insurance adds $66/mo.
- Climate carrying-cost: major flood risk; severe wind risk, 99% chance of damaging wind over 30y; extreme-heat days projected 7→31/yr by 2055 (HVAC capex compounding) — expect insurance premiums to compound above CPI over the hold.
Questions for the listing agent
- Can we see the unit-by-unit rent roll, current vacancy, and any below-market leases? What's the average tenancy length?
- What capital expenditures (roof, boiler, parking lot, exteriors) have been made in the last 5 years, and what's planned in the next 2?
- Built in 1973 — when were the roof, HVAC, electrical panel, plumbing, and water heater last replaced?
- What's the actual annual flood-insurance premium (NFIP or private), and is the property in a SFHA with mandatory coverage?
- Is there a deadline driving the sale (1031 exchange, divorce, estate, relocation)? That informs how much negotiation room exists.
- Schools are F-rated, which usually means shorter tenancies and higher turnover. Who's the typical renter profile here, and what's been the actual vacancy rate?
- The area grade is low — what's the realistic commute time and amenity access for the typical tenant pool here? Any planned neighborhood developments (good or bad) we should know about?
- What's the average days-on-market for RENTAL listings here right now (not sales)? A rising rental-DOM trend means longer vacancies and softer asking-rent achievability than the comps imply.
- What's the recent tenant-quality profile in this submarket — average credit score on applications, eviction rate, late-payment / NSF rate, and stable-employment percentage? A property-management company in the area should have these aggregated.
- How much new apartment / multifamily construction is in the pipeline within 1–3 miles? Heavy new supply (>2% of stock underway) typically softens rents 12–24 months out; light construction supports rent growth.
Investment metrics
- 1% rule
- 0.95% ✗
- Cap rate
- 6.97%
- Cash-on-cash
- 2.41%
- DSCR
- 1.11
- GRM
- 8.8
CMA / ARV
- ARV (on-the-fly)
- $292,994
- Comps found
- 5
Show comp detail 5 sales within ~0.75 mi
| Address | Dist | Beds/Ba | Sqft | Sold | Price | $/sf | Match |
|---|---|---|---|---|---|---|---|
| 5625/5627 Fourth Ave | 0.01mi | 4/2.5 | 1,528 (-0%) | 1mo | $250,000 | $164 | 96 |
| 5637-5639 Fifth Ave | 0.07mi | 4/2.0 | 1,560 (+2%) | 5mo | $180,000 | $115 | 90 |
| 5532/5534 Seventh Ave | 0.22mi | 4/2.0 | 1,440 (-6%) | 2mo | $275,000 | $191 | 78 |
| 5508 10th Ave | 0.40mi | 4/2.0 | 1,440 (-6%) | 15mo | $282,646 | $196 | 59 |
| 5455/5457 Tenth Ave | 0.40mi | 4/2.0 | 1,320 (-14%) | 2mo | $267,300 | $203 | 57 |
Match score weights: distance 35% · size 25% · config 20% · recency 20%. Top-matched comps best support the ARV.
Projected returns pro-forma
-3.0% appreciation · 0.0% rent growth · sell at horizon
- IRR
- -17.7%
- Equity multiple
- 0.39×
- Total profit
- $-44,813
- Equity at exit
- $39,363
- IRR
- -17.2%
- Equity multiple
- 0.18×
- Total profit
- $-60,281
- Equity at exit
- $22,826
Cash invested: $73,920 (down + closing). Projections, not guarantees.
Landlord ↔ Tenant lean methodology
- Overall (STATE)
- 87 Strongly Landlord-Friendly
- State Florida
- 87 Strongly Landlord-Friendly · R+3
- County
- — inherits STATE
- City
- — inherits STATE
ZIP-level market 33907
- Home prices YoY
- -26.8%
- Rents YoY
- -9.7%
- Active inventory
- 346
- Price-to-rent
- 17.6×
Monthly cashflow live
- Estimated rent
- $2,497 high interval (Pro) →
- Mortgage (P&I)
- −$1,384
- Tax est. 1.5%
- −$330 /mo · $3,960/yr
- Insurance
- −$110
- Flood insurance flood zone
- −$66 /mo · $798/yr
- HOA
- −$0
- Vacancy / Maint / Mgmt
- −$524
- Net cashflow
- $82
Break-even live
2-unit breakdown (identical units grouped — click to expand)
| Units | Beds | Baths | Est. rent |
|---|---|---|---|
| 2× units | 2 | 1 | $2,498 |
| #1 | 2 | 1 | $1,249 |
| #2 | 2 | 1 | $1,249 |
| Total (2 units) | $2,497 | ||
UW: 25.0% down · 7.5% · 30yr · 1.5% tax · 5.0% vac · 8.0% maint · 8.0% mgmt
Financing live
Cash to close
- Down payment
- $66,000
- Closing costs
- $7,920
- Reserves months
- —
- Total cash needed
- —
Loan-product check · same deal, 3 products live
Conventional
25% down · 7.5% · 30yr
- Down + closing
- —
- Monthly P&I
- —
- Monthly cashflow
- —
- DSCR
- —
- Eligible?
- —
Personal DTI + credit; lowest rate.
DSCR
20% down · 8.5% · 30yr
- Down + closing
- —
- Monthly P&I
- —
- Monthly cashflow
- —
- DSCR
- —
- Eligible?
- —
No personal income docs; deal must DSCR.
Hard money
10% down · 12.0% · 12mo
- Down + closing
- —
- Monthly P&I
- —
- Monthly cashflow
- —
- DSCR
- —
- Eligible?
- —
Short-term bridge; refi at stabilization.
Rent comps 19 comps
| Address | Beds | Baths | Sqft | Rent | $/sqft | DOM | Units | Dist |
|---|---|---|---|---|---|---|---|---|
| 5457 9th Ave Fort Myers, FL | 3.0 | 2.0 | 1158 | $2,050 | $1.77 | 23d | 1 | 0.36mi |
| 5001 Palm Pointe Ct Fort Myers, FL | 1.0–3.0 | 1.0–2.0 | 990 | $2,735 | $2.76 | 2d | 35 | 0.36mi |
| 1608 Park Meadows Dr #1 Fort Myers, FL | 3.0 | 2.5 | 1722 | $1,950 | $1.13 | 23d | 1 | 0.39mi |
| 5335 Hawks Landing Dr Unit 202 Fort Myers, FL | 3.0 | 2.0 | 1154 | $1,555 | $1.35 | 23d | 1 | 0.56mi |
| 12750 Equestrian Cir #3005 Fort Myers, FL | 3.0 | 2.0 | 1154 | $1,650 | $1.43 | 23d | 1 | 0.66mi |
| 2181 Coronet St Fort Myers, FL | 3.0 | 1.0 | 1810 | $1,200 | $0.66 | 3d | 1 | 0.67mi |
| 5625 Trailwinds Dr #412 Fort Myers, FL | 3.0 | 2.0 | 1331 | $2,150 | $1.62 | 23d | 1 | 0.89mi |
| 5883 Sand Oak Dr Fort Myers, FL | 3.0 | 2.0 | 1582 | $2,300 | $1.45 | 3d | 1 | 0.97mi |
| 1601 Red Cedar Dr Fort Myers, FL | 1.0–3.0 | 1.0–2.0 | 1000 | $1,594 | $1.59 | 1d | 36 | 0.99mi |
| 5710 Trailwinds Dr #525 Fort Myers, FL | 3.0 | 2.0 | 1435 | $1,950 | $1.36 | 19d | 1 | 1.00mi |
| 5710 Trailwinds Dr #525 Fort Myers, FL | 3.0 | 3.0 | 1171 | $1,700 | $1.45 | 2d | 1 | 1.00mi |
| 1411 Whiskey Creek Dr Fort Myers, FL | 3.0 | 2.0 | 2087 | $3,390 | $1.62 | 23d | 1 | 1.10mi |
| 1463 Tanglewood Pkwy Fort Myers, FL | 3.0 | 2.0 | 1754 | $3,100 | $1.77 | 23d | 1 | 1.15mi |
| 1448 Covington Cir W Fort Myers, FL | 3.0 | 2.0 | 1350 | $3,500 | $2.59 | 23d | 1 | 1.20mi |
| 8251 Pathfinder Loop #621 Fort Myers, FL | 3.0 | 2.0 | 1306 | $4,000 | $3.06 | 23d | 1 | 1.26mi |
| 6346 Saint Andrews Cir S Fort Myers, FL | 3.0 | 2.0 | 1174 | $2,400 | $2.04 | 3d | 1 | 1.38mi |
| 1208 Westfield Dr Fort Myers, FL | 3.0 | 2.0 | 1600 | $2,900 | $1.81 | 23d | 1 | 1.39mi |
| 6313 Saint Andrews Cir S Fort Myers, FL | 3.0 | 2.0 | 1418 | $2,350 | $1.66 | 3d | 1 | 1.44mi |
| 2425 Woodland Cir Fort Myers, FL | 3.0 | 2.0 | 1379 | $2,220 | $1.61 | 23d | 1 | 1.49mi |
Listing history 2 events
-
2026-05-08status Pending
-
2026-04-27$264,000 Active
ⓘ Source: listings_history table (triggers on properties + properties_extension) + one-shot
backfill from property_details.listing_events for pre-trigger history.
Climate risk First Street
- Flood 7/10 Severe FEMA zone X (shaded) · 73% chance over 30 yrs
- Wildfire 1/10 Low
- Heat 10/10 Extreme 7 d/yr ≥107°F today · 31 d/yr by 30 yrs out
- Wind 10/10 Extreme 99% chance of damaging wind over 30 yrs
- Air quality 2/10 Low 1 unhealthy d/yr today · 1 by 30 yrs out
Nearby sold comps map
Loading sold comps map…
Walkable amenities ~0.75 mi
Loading nearby amenities…
Taxation est. · year 1
- Rental income
- $29,964
- − Mortgage interest
- −$14,788
- − Property taxes
- −$3,960
- − Insurance
- −$2,118
- − Repairs & maintenance
- −$2,397
- − Management
- −$2,397
- − Depreciation
- −$7,680
- Taxable loss
- −$3,376
- Est. tax savings @ 24.0%
- +$810
- After-tax cash flow
- $1,791/yr
For passive investors: Depreciation is non-cash, so a rental often shows a tax loss while cash-flowing — sheltering income. Rental losses are passive: they offset passive income freely, and up to $25,000/yr can offset ordinary (W-2) income if you actively participate and your MAGI is under $100k (phasing out to $0 by $150k); unused losses carry forward. On sale, claimed depreciation is recaptured at up to 25%, and gains may owe capital-gains tax (a 1031 exchange can defer both). Figures are a year-1 estimate at your 24.0% rate — not tax advice; consult a CPA.
Condition & rehab AI · 6 photos
A well-maintained and updated two-bedroom duplex with a new kitchen and central AC, ready for immediate occupancy.
Value-add opportunities
- Both Paint exterior and interior — Enhances curb appeal and interior aesthetics.
- Resale Replace countertops with quartz or granite — Improves kitchen functionality and appearance.
- Both Install smart home devices — Enhances convenience and marketability for both buyers and renters.
Renovation cost estimate screening
Value-add ROI direction
- Both Paint exterior and interior — Enhances curb appeal and interior aesthetics. ↑
- Resale Replace countertops with quartz or granite — Improves kitchen functionality and appearance. ↑
- Both Install smart home devices — Enhances convenience and marketability for both buyers and renters. ↑
ⓘ Cost ranges are severity-bucket heuristics (US national rule-of-thumb). Get contractor quotes + a written scope before underwriting a rehab budget.
Schools (NCES district)
- District
- Lee
- NCES district ID
- 1201080
- Math proficiency
- 47% ▼ -11.00%
- Reading proficiency
- 50% ▼ -4.00%
- Median HH income
- $49,518
- Composite
- 41.49/100
- National rank
- #3458
- State rank
- #42 of 73 in FL
Livability — Pine Manor
- Score
- 64/100
- State rank
- #695
- US rank
- #14531
Category grades
Schools grade is shown separately in the Schools card above.
Census & demographics
- Census place
- Pine Manor, FL
- County
- Lee County · 788,662 people
- Metro
- Cape Coral-Fort Myers, FL
- Population (ZIP)
- 25,033
- Household income
- $52,478
- Rent vs Own
- Severe rent burden
- 1960.0
Population outlook (Lee County) Hauer SSP2
- Today (2025)
- 871,946 people
- By 2030
- 955,468 · +9.6%
- By 2040
- 1,113,587 · +27.7%
- By 2050
- 1,256,891 · +44.1%
- By 2075
- 1,560,270 · +78.9%
- By 2100
- 1,726,848 · +98.0%
Race, ethnicity, and origin ACS 2023
- Neighborhood character
- Diverse neighborhood (Simpson 0.63)
- Race & ethnicity
- White 52% Hispanic / Latino 30% Two or more races 21% Black 10% Asian 2%
- Hispanic origin (detail)
- Mexican 10% Puerto Rican 6% Cuban 2% Dominican 1%
- Common ancestry
- Hispanic 2% Romanian 2% Lithuanian 2%
- Foreign-born
- 26% · Canada, Jamaica, Dominican Republic
- Languages at home
- 65% English-only · Spanish 25% Other Indo-European 4% French/Haitian/Cajun 2%
Political lean MEDSL · Lee
- 2024 margin
- Strong R (+28.4) · D 35.5% · R 63.9%
- 2008→2024 swing
- -18.0pp toward R · 2008: -10.4pp · 2024: -28.4pp
- All cycles
- 2024: R+28.4 2020: R+19.2 2016: R+20.4 2012: R+16.6 2008: R+10.4
Not yet ingested
- Civics
- —
Market trends
- HPI YoY
- ▼ -93.02%
- Current HPI
- 254.2264
- Rent YoY
- ▼ -9.68%
- Metro
- Cape Coral-Fort Myers, FL
- State GDP YoY
- ▲ 3.28%
- F500 in state
- 36
Industry mix (Fortune 500 HQ in FL)
| Industry | F500 HQs | Revenue |
|---|---|---|
| Industrial Technology | 2 | $29B |
|
||
| Insurance | 2 | $17B |
|
||
| Retail | 1 | $60B |
|
||
| Technology Distribution | 1 | $58B |
|
||
| Homebuilding | 1 | $35B |
|
||
| Technology Manufacturing | 1 | $35B |
|
||
Price history
2 events — show timeline
- 2026-05-08 Pending — FORTMLS
- 2026-04-27 Listed $264,000 FORTMLS
Cash-flow waterfall
monthlySold comps — $/sqft
last 12 mo · ≤1 miLoading sold comps…