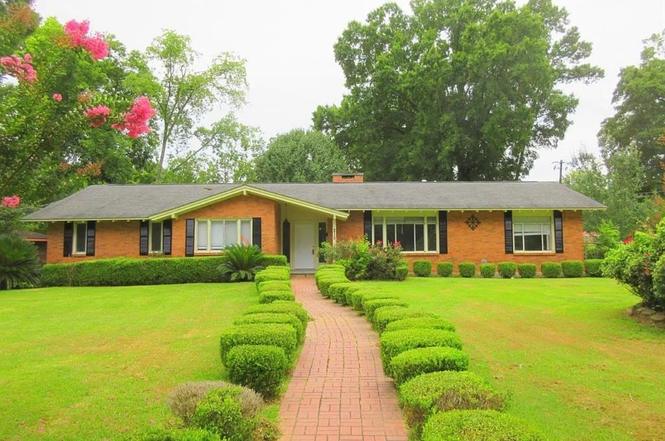
215 S Anton Dr · Montgomery, AL
Flood risk 1/10 · Minimal
- FEMA flood zone
- X (unshaded)
- Chance of flooding over 30 yrs
- 0.0%
- Est. flood insurance / yr
- $507 – $1,088
Fire risk 1/10 · Minimal
- Est. fire insurance / yr
- $916 – $1,700
Heat risk 7/10 · Major
- Hot days now (above 108°F)
- 7 days/yr
- Hot days in 30 yrs
- 20 days/yr
Wind risk 8/10 · Major
- Chance of severe wind over 30 yrs
- 80.0%
Air-quality risk 2/10 · Minimal
- Unhealthy air days now
- 1 days/yr
- Unhealthy air days in 30 yrs
- 1 days/yr
Risk factors via First Street. Map © Google.
Why this score? — see what drove the C- grade
The composite is a weighted blend of 9 inputs, each scored 0–100. Each bar is that input's sub-score; the figure is the points it added to the 100-point composite (weight × sub-score).
- Cash flow +22.4/30.0
- ARV discount +7.5/15.0
- DSCR +7.2/10.0
- 1% rule +5.1/10.0
- Livability +3.2/5.0
- Rent growth +2.5/5.0
- Condition / age +2.5/5.0
- Schools +1.7/10.0
- Appreciation +0.0/10.0
$159,900
🖨 Deal sheet 📄 Offer letter ✓ Due diligence
Listing remarks MLS
The curb appeal on this home is picture perfect! This home is old world charm meets cool grays and kitchen charm! This home is over 3000sqft. The floor plan includes two living areas, 2 dining areas, a florida room the length of the house a brick laid patio and three spacious bedrooms. If you're looking for a home that could easily be converted to 4 or 5 bedrooms. .. you've got to take a look at his home! The kitchen has been updated with stainless steel appliances including a new stove and refrigerator. The spacious master bedroom boasts a large master en suite bath and private entrance onto the enclosed porch. You've got to see this one in person! Schedule your showing today!
Key facts
- Large kitchen
- Expansive backyard
- Oversized lot
Tags
Property features AI
Finance
- Financial info: Current lease through 2026-07-03
Exterior
- Parking: Attached carport with 2 spaces
- Utilities: Cable available; Electricity available; Natural gas available; High-speed internet available; Public water; Public sewer
- Home design: Single-story; Brick construction; Slab foundation; Home warranty included
- Construction: Brick exterior
- Exterior features: Patio; City lot; Paved road access
Interior
- Kitchen: Dishwasher; Electric cooktop; Electric oven
- Flooring: Laminate; Tile; Wood
- Bathrooms: Two full bathrooms
- Heating & cooling: Central heating (gas); Central air conditioning (electric)
- Interior features: Double vanity; Fireplace (one)
- Laundry & utility: Electric water heater
Neighborhood map
What this means for you Summary
Snapshot
- This is a 3-bed/2.0-bath single-family listed at $160k.
Deal economics
- At list price, monthly cash flow is $267 ($3k/yr) — positive.
- The deal already cash-flows at list — no discount required.
- Meets the 1% rule at list price ($2k rent vs $160k).
- Cap rate 8.3% vs local median 6.0% in Montgomery — top-decile yield for the area; either an underpriced asset or a hidden risk that comps aren't pricing in. Stress-test before assuming the spread holds.
Location & tenants
- Location reads 65/100 on livability (#138 in AL) — a middle-class / working-renter tenant base. Strengths: cost of living A+, housing A+; Watch: schools C-, employment D, crime F.
- Montgomery County (urban): math 9% / reading 31% proficiency, ranked #106 of 129 in AL (top 82%) — low school quality limits family demand, transient renter base, plan for 1-2y turnover; 70% free/reduced lunch — lower-income household profile, screen leases tightly.
- Market conditions: 79 active listings in the ZIP; 6 comparable units currently listed for rent nearby; rentals lingering (median 44d on market — plan ~5-8 weeks vacancy on turnover, expect pricing pressure); 50% of comp listings sitting > 30 days — soft ceiling on asking rent; lower-income renter base — watch delinquency; 460 units permitted in Montgomery County in 2024 (37 in 5+ unit buildings).
- At $1,619/mo this rent would consume 47% of the median local household income ($41k/yr) (locally 679% of renters already pay >50% of income on rent) — very limited rent-growth headroom before tenants either downsize or default.
Forward outlook
- Local home prices are declining (-3.0%/yr); year-one equity from $1k of loan paydown is wiped out by about $5k of value loss. Plan a longer hold.
- Montgomery County population projected to shrink 8% by 2050 — rents likely to lag national; underwrite the cash flow, not the appreciation.
Negotiation context
- Only 5 days on market — expect competitive offers; lowballing is unlikely to land.
- 3 sale attempts since 6y ago with the ask held roughly flat each time — persistent listings suggest the price (not the market) is what's stuck; bring a comps-based counter.
- Current owner paid $133k; 20% above their basis — modest negotiation headroom, anchor on the comps not their cost.
Risks & watch-outs
- Climate carrying-cost: severe wind risk, 80% chance of damaging wind over 30y; extreme-heat days projected 7→20/yr by 2055 (HVAC capex compounding) — expect insurance premiums to compound above CPI over the hold.
Questions for the listing agent
- Built in 1961 — when were the roof, HVAC, electrical panel, plumbing, and water heater last replaced?
- Is there a deadline driving the sale (1031 exchange, divorce, estate, relocation)? That informs how much negotiation room exists.
- Crime grade is F in this area — have there been break-ins, vandalism, or insurance claims at this property in the last 3 years? What carrier currently insures it and at what premium?
- What's the average days-on-market for RENTAL listings here right now (not sales)? A rising rental-DOM trend means longer vacancies and softer asking-rent achievability than the comps imply.
- What's the recent tenant-quality profile in this submarket — average credit score on applications, eviction rate, late-payment / NSF rate, and stable-employment percentage? A property-management company in the area should have these aggregated.
- How much new for-sale + rental construction is in the pipeline within 1–3 miles? Heavy new supply typically softens prices + rents 12–24 months out; constrained supply supports both.
Investment metrics
- 1% rule
- 1.01% ✓
- Cap rate
- 8.29%
- Cash-on-cash
- 7.15%
- DSCR
- 1.32
- GRM
- 8.2
CMA / ARV
- ARV (on-the-fly)
- $71,392
- Comps found
- 7
Show comp detail 7 sales within ~0.75 mi
| Address | Dist | Beds/Ba | Sqft | Sold | Price | $/sf | Match |
|---|---|---|---|---|---|---|---|
| 3728 Rosa L Parks Ave | 0.32mi | 4/2.0 (+1) | 2,906 (-6%) | 13mo | $28,000 | $10 | 59 |
| 317 Cullen St | 0.11mi | 4/3.0 (+1) | 3,291 (+6%) | 23mo | $125,000 | $38 | 57 |
| 7 S Haardt Dr | 0.28mi | 4/3.5 (+1) | 3,401 (+10%) | 5mo | $60,500 | $18 | 56 |
| 3295 S Perry St | 0.60mi | 3/2.5 | 2,733 (-12%) | 1mo | $60,000 | $22 | 49 |
| 338 N Anton Dr | 0.24mi | 3/2.5 | 2,657 (-14%) | 20mo | $125,000 | $47 | 46 |
| 35 S Haardt Dr | 0.24mi | 3/3.5 | 3,530 (+14%) | 23mo | $82,000 | $23 | 41 |
| 3504 Southmont Dr | 0.38mi | 4/2.5 (+1) | 2,698 (-13%) | 20mo | $65,000 | $24 | 37 |
Match score weights: distance 35% · size 25% · config 20% · recency 20%. Top-matched comps best support the ARV.
Projected returns pro-forma
-3.0% appreciation · 3.0% rent growth · sell at horizon
- IRR
- -5.4%
- Equity multiple
- 0.80×
- Total profit
- $-8,962
- Equity at exit
- $23,842
- IRR
- 4.3%
- Equity multiple
- 1.31×
- Total profit
- $13,929
- Equity at exit
- $13,825
Cash invested: $44,772 (down + closing). Projections, not guarantees.
Landlord ↔ Tenant lean methodology
- Overall (STATE)
- 90 Strongly Landlord-Friendly
- State Alabama
- 90 Strongly Landlord-Friendly · R+15
- County
- — inherits STATE
- City
- — inherits STATE
ZIP-level market 36105
- Home prices YoY
- -32.6%
- Active inventory
- 79
- Price-to-rent
- 8.2×
Monthly cashflow live
- Estimated rent
- $1,619 high interval (Pro) →
- Mortgage (P&I)
- −$839
- Tax from tax record
- −$107 /mo · $1,283/yr
- Insurance
- −$67
- HOA
- −$0
- Vacancy / Maint / Mgmt
- −$340
- Net cashflow
- $267
Break-even live
UW: 25.0% down · 7.5% · 30yr · 1.5% tax · 5.0% vac · 8.0% maint · 8.0% mgmt
Financing live
Cash to close
- Down payment
- $39,975
- Closing costs
- $4,797
- Reserves months
- —
- Total cash needed
- —
Loan-product check · same deal, 3 products live
Conventional
25% down · 7.5% · 30yr
- Down + closing
- —
- Monthly P&I
- —
- Monthly cashflow
- —
- DSCR
- —
- Eligible?
- —
Personal DTI + credit; lowest rate.
DSCR
20% down · 8.5% · 30yr
- Down + closing
- —
- Monthly P&I
- —
- Monthly cashflow
- —
- DSCR
- —
- Eligible?
- —
No personal income docs; deal must DSCR.
Hard money
10% down · 12.0% · 12mo
- Down + closing
- —
- Monthly P&I
- —
- Monthly cashflow
- —
- DSCR
- —
- Eligible?
- —
Short-term bridge; refi at stabilization.
Rent comps 6 comps
| Address | Beds | Baths | Sqft | Rent | $/sqft | DOM | Units | Dist |
|---|---|---|---|---|---|---|---|---|
| 3179 Norman Bridge Rd Unit 4 Montgomery, AL | 2.0 | 1.0 | 4059 | $1,000 | $0.25 | 43d | 1 | 0.95mi |
| 3485 Wellington Rd Montgomery, AL | 3.0 | 2.0 | 2437 | $1,395 | $0.57 | 20d | 1 | 0.98mi |
| 3556 Princeton Rd Montgomery, AL | 4.0 | 2.0 | 2718 | $1,200 | $0.44 | 20d | 1 | 1.08mi |
| 334 Felder Ave Montgomery, AL | 3.0 | 2.0 | 2223 | $2,395 | $1.08 | 43d | 1 | 1.30mi |
| 3510 Bankhead Ave Montgomery, AL | 3.0 | 3.0 | 2210 | $2,250 | $1.02 | 43d | 1 | 1.34mi |
| 144 Clanton Ave Montgomery, AL | 4.0 | 2.0 | 3178 | $1,595 | $0.50 | 20d | 1 | 1.35mi |
Listing history 5 events
-
2026-06-15status $159,900 Pending 5 DOM
-
2026-06-15days on market $159,900 Active 5 DOM
-
2026-06-14days on market $159,900 Active 3 DOM
-
2026-06-13remarks 687-char remark
-
2026-06-13$159,900 Active 2 DOM
ⓘ Source: listings_history table (triggers on properties + properties_extension) + one-shot
backfill from property_details.listing_events for pre-trigger history.
Tax reassessment forecast AL · Resets to sale price
- Current annual tax
- $1,283 · $107/mo
- Projected year-2 tax
- $1,283 · $107/mo
- Expected delta
- $0/yr ($0/mo · 0.0%)
ⓘ Screening estimate from a state-policy table — verify with the county assessor before closing.
Climate risk First Street
- Flood 1/10 Low FEMA zone X (unshaded) · 0% chance over 30 yrs
- Wildfire 1/10 Low
- Heat 7/10 Severe 7 d/yr ≥108°F today · 20 d/yr by 30 yrs out
- Wind 8/10 Severe 80% chance of damaging wind over 30 yrs
- Air quality 2/10 Low 1 unhealthy d/yr today · 1 by 30 yrs out
Nearby sold comps map
Loading sold comps map…
Walkable amenities ~0.75 mi
Loading nearby amenities…
Taxation est. · year 1
- Rental income
- $19,424
- − Mortgage interest
- −$8,957
- − Property taxes
- −$1,283
- − Insurance
- −$800
- − Repairs & maintenance
- −$1,554
- − Management
- −$1,554
- − Depreciation
- −$4,652
- Taxable income
- $624
- Est. tax owed @ 24.0%
- −$150
- After-tax cash flow
- $3,050/yr
For passive investors: Depreciation is non-cash, so a rental often shows a tax loss while cash-flowing — sheltering income. Rental losses are passive: they offset passive income freely, and up to $25,000/yr can offset ordinary (W-2) income if you actively participate and your MAGI is under $100k (phasing out to $0 by $150k); unused losses carry forward. On sale, claimed depreciation is recaptured at up to 25%, and gains may owe capital-gains tax (a 1031 exchange can defer both). Figures are a year-1 estimate at your 24.0% rate — not tax advice; consult a CPA.
Schools (NCES district)
- District
- Montgomery County
- NCES district ID
- 0102430
- Math proficiency
- 9% ▼ -21.00%
- Reading proficiency
- 31% ▼ -1.00%
- Median HH income
- $43,902
- Composite
- 17.24/100
- National rank
- #9093
- State rank
- #106 of 129 in AL
Livability — Montgomery
- Score
- 65/100
- State rank
- #138
- US rank
- #13416
Category grades
Schools grade is shown separately in the Schools card above.
Census & demographics
- Census place
- Montgomery, AL
- County
- Montgomery County · 190,016 people
- City population
- 175,913
- Metro
- Montgomery, AL
- Population (ZIP)
- 9,207
- Household income
- $41,486
- Rent vs Own
- Severe rent burden
- 679.0
Population outlook (Montgomery County) Hauer SSP2
- Today (2025)
- 224,008 people
- By 2030
- 221,460 · -1.1%
- By 2040
- 214,179 · -4.4%
- By 2050
- 204,912 · -8.5%
- By 2075
- 177,821 · -20.6%
- By 2100
- 145,134 · -35.2%
Race, ethnicity, and origin ACS 2023
- Neighborhood character
- Predominantly Black (83%)
- Race & ethnicity
- Black 83% White 12% Hispanic / Latino 4% Two or more races 3%
- Common ancestry
- Italian 1%
- Foreign-born
- 3% · Canada, South Korea
- Languages at home
- 95% English-only · Spanish 4%
Political lean MEDSL · Montgomery
- 2024 margin
- Solid D (+30.7) · D 64.8% · R 34.1% · Other 1.1%
- 2008→2024 swing
- +11.5pp toward D · 2008: 19.2pp · 2024: 30.7pp
- All cycles
- 2024: D+30.7 2020: D+31.5 2016: D+26.2 2012: D+24.3 2008: D+19.2
Not yet ingested
- Civics
- —
Market trends
- HPI YoY
- ▼ -31.17%
- Current HPI
- 64.4673
- Rent YoY
- —
- Metro
- Montgomery, AL
- State GDP YoY
- ▲ 2.94%
- F500 in state
- 4
Industry mix (Fortune 500 HQ in AL)
| Industry | F500 HQs | Revenue |
|---|---|---|
| Financial Services | 1 | $8B |
|
||
| Healthcare | 1 | $5B |
|
||
Price history
+146.4% since first listed7 events — show timeline
- 2026-06-10 Listed $159,900 MAAR
- 2020-08-27 Sold (Public Records) $133,000 Public Records
- 2020-08-26 Sold (MLS) $133,000 MAAR
- 2020-07-07 Listed $129,000 MAAR
- 2020-03-12 Sold (Public Records) $57,950 Public Records
- 2020-03-11 Sold (MLS) $57,950 MAAR
- 2020-01-16 Listed $64,900 MAAR
Property tax history
+9.2%/yrLatest (2025): $1,283 · +0.0% YoY. Source: county tax records.
Cash-flow waterfall
monthlySold comps — $/sqft
last 12 mo · ≤1 miLoading sold comps…