2 Fordham Hill Oval · New York, NY
Flood risk 1/10 · Minimal
- FEMA flood zone
- X (unshaded)
- Chance of flooding over 30 yrs
- 0.0%
- Est. flood insurance / yr
- $507 – $1,088
Fire risk 1/10 · Minimal
- Est. fire insurance / yr
- $691 – $1,283
Heat risk 6/10 · Moderate
- Hot days now (above 99°F)
- 7 days/yr
- Hot days in 30 yrs
- 14 days/yr
Wind risk 6/10 · Moderate
- Chance of severe wind over 30 yrs
- 27.0%
Air-quality risk 3/10 · Minor
- Unhealthy air days now
- 3 days/yr
- Unhealthy air days in 30 yrs
- 4 days/yr
Risk factors via First Street. Map © Google.
Why this score? — see what drove the C+ grade
The composite is a weighted blend of 9 inputs, each scored 0–100. Each bar is that input's sub-score; the figure is the points it added to the 100-point composite (weight × sub-score).
- Cash flow +25.3/30.0
- DSCR +8.4/10.0
- 1% rule +6.6/10.0
- Appreciation +5.3/10.0
- Schools +5.0/10.0
- Rent growth +4.2/5.0
- Livability +3.8/5.0
- Condition / age +2.5/5.0
- ARV discount +0.3/15.0
$185,000
🖨 Deal sheet 📄 Offer letter ✓ Due diligence
Listing remarks
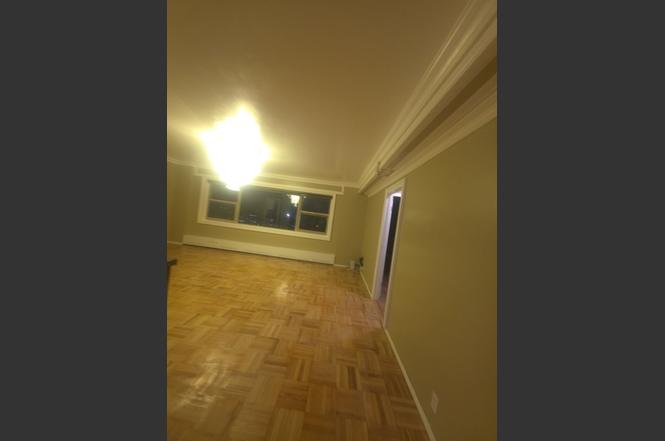
Beautiful, complete renew 1 bedroom apartment , in a gate community, 24 hour security, with an amazing view , laundry and gym in the building private garden and kids playground, close to everything, everything you ever want it and more, 725 square feet, is hard to put in the market my beloved apartment but time to move on, and looking for a lucky person, to enjoy everything the fordham hill community has to offer
Key facts
- Private garden
- Gate community
- Laundry in building
Tags
Neighborhood map
What this means for you Summary
Snapshot
- This is a 1-bed/1.0-bath townhouse listed at $185k.
Deal economics
- At list price, monthly cash flow is $422 ($5k/yr) — positive.
- The deal already cash-flows at list — no discount required.
- Meets the 1% rule at list price ($2k rent vs $185k).
- Recommended offer: $163k (12.0% below list) — sets the bar for market timing.
- Cap rate 9.0% vs local median 2.6% in New York — top-decile yield for the area; either an underpriced asset or a hidden risk that comps aren't pricing in. Stress-test before assuming the spread holds.
Location & tenants
- Location reads 75/100 on livability (#268 in NY, #4,188 nationally) — a middle-class / working-renter tenant base. Strengths: amenities A+, commute A+, health & safety A; Watch: crime F, cost of living F.
- Market conditions: Rents rising fast (+6.7%/yr); 122 active listings in the ZIP; 1 comparable units currently listed for rent nearby; 6,929 units permitted in Bronx County in 2024 (6,829 in 5+ unit buildings).
- At $2,153/mo this rent would consume 56% of the median local household income ($46k/yr) (locally 9659% of renters already pay >50% of income on rent) — very limited rent-growth headroom before tenants either downsize or default.
Forward outlook
- In year one you build about $2k of equity ($1k loan paydown + $932 appreciation (0.5% local appreciation)).
- Bronx County population projected at +21% by 2050 — long-run rental-demand tailwind backs the buy-and-hold thesis.
- At projected returns (0.5% appreciation + 6.7% rent growth), your $52k cash investment doubles in ~6 years — after that, you're playing with house money.
Negotiation context
- It's been on market 220 days — a 12% lower offer ($163k) is reasonable based on typical stale-listing flexibility.
- 2 sale attempts with the ask held roughly flat each time — persistent listings suggest the price (not the market) is what's stuck; bring a comps-based counter.
Risks & watch-outs
- Watch-outs: built in 1950 — expect roof / HVAC / electrical / plumbing capex.
- Climate carrying-cost: major wind risk, 27% chance of damaging wind over 30y; extreme-heat days projected 7→14/yr by 2055 (HVAC capex compounding) — expect insurance premiums to compound above CPI over the hold.
Questions for the listing agent
- It's been on market 220 days. Have you received any prior offers? Is the seller open to a 12% concession, seller financing, or rate buy-down credit?
- Built in 1950 — when were the roof, HVAC, electrical panel, plumbing, and water heater last replaced?
- Why hasn't it sold? Are there any deal-killer items the seller is aware of (foundation, flood, title, zoning, code violations)?
- Is there a deadline driving the sale (1031 exchange, divorce, estate, relocation)? That informs how much negotiation room exists.
- Schools are B-rated — typically a magnet for longer-tenancy family renters. What's the average tenant stay here, and is there a school-zone premium baked into asking?
- Crime grade is F in this area — have there been break-ins, vandalism, or insurance claims at this property in the last 3 years? What carrier currently insures it and at what premium?
- What's the average days-on-market for RENTAL listings here right now (not sales)? A rising rental-DOM trend means longer vacancies and softer asking-rent achievability than the comps imply.
- What's the recent tenant-quality profile in this submarket — average credit score on applications, eviction rate, late-payment / NSF rate, and stable-employment percentage? A property-management company in the area should have these aggregated.
- How much new for-sale + rental construction is in the pipeline within 1–3 miles? Heavy new supply typically softens prices + rents 12–24 months out; constrained supply supports both.
Investment metrics
- 1% rule
- 1.16% ✓
- Cap rate
- 9.03%
- Cash-on-cash
- 9.78%
- DSCR
- 1.44
- GRM
- 7.2
CMA / ARV
- ARV (on-the-fly)
- $159,500
- Comps found
- 12
Show comp detail 12 sales within ~0.75 mi
| Address | Dist | Beds/Ba | Sqft | Sold | Price | $/sf | Match |
|---|---|---|---|---|---|---|---|
| 7 Fordham Hl Unit 15D | 0.05mi | 1/1.0 | 750 (+3%) | 1mo | $165,000 | $220 | 92 |
| 5 Fordham Hill Oval Unit 12D | 0.01mi | 1/0.5 | 795 (+10%) | 5mo | $170,000 | $214 | 77 |
| 9 Fordham Hill Oval Unit 112E | 0.10mi | 1/1.0 | 800 (+10%) | 2mo | $170,000 | $213 | 77 |
| 2630 Kingsbridge Ter Unit 6B | 0.32mi | 1/1.0 | 750 (+3%) | 4mo | $140,000 | $187 | 76 |
| 2 Fordham Hill Oval Unit 4D | 0.09mi | 1/1.0 | 795 (+10%) | 5mo | $165,000 | $208 | 75 |
| 2400 Davidson Ave Unit A2 | 0.36mi | 1/1.0 | 700 (-3%) | 4mo | $157,500 | $225 | 74 |
| 2630 Kingsbridge Ter Unit 2R | 0.32mi | 1/1.0 | 775 (+7%) | 5mo | $200,000 | $258 | 69 |
| 2685 Creston Ave Unit 1-M | 0.67mi | 1/1.0 | 700 (-3%) | 1mo | $149,000 | $213 | 62 |
| 251 Seaman Ave Unit 6A | 0.69mi | 1/1.0 | 704 (-3%) | 1mo | $349,000 | $496 | 62 |
| 2685 Creston Ave Unit 2-L | 0.67mi | 1/1.0 | 750 (+3%) | 2mo | $165,000 | $220 | 62 |
| 2860 Bailey Ave Unit 4F | 0.68mi | 1/1.0 | 700 (-3%) | 2mo | $149,000 | $213 | 61 |
| 2685 Creston Ave Unit 5-L | 0.67mi | 1/1.0 | 750 (+3%) | 5mo | $169,000 | $225 | 59 |
Match score weights: distance 35% · size 25% · config 20% · recency 20%. Top-matched comps best support the ARV.
Projected returns pro-forma
0.5% appreciation · 6.7% rent growth · sell at horizon
- IRR
- 13.0%
- Equity multiple
- 1.66×
- Total profit
- $34,245
- Equity at exit
- $58,425
- IRR
- 19.5%
- Equity multiple
- 3.52×
- Total profit
- $130,764
- Equity at exit
- $74,104
Cash invested: $51,800 (down + closing). Projections, not guarantees.
Landlord ↔ Tenant lean methodology
- Overall (CITY)
- 0 Strongly Tenant-Friendly
- State New York
- 15 Strongly Tenant-Friendly · D+10
- County
- — inherits STATE
- City New York
- 0 Strongly Tenant-Friendly · D+34
ZIP-level market 10468
- Home prices YoY
- 0.2%
- Rents YoY
- 6.7%
- Active inventory
- 122
- Price-to-rent
- 7.2×
Monthly cashflow live
- Estimated rent
- $2,153 medium interval (Pro) →
- Mortgage (P&I)
- −$970
- Tax est. 1.5%
- −$231 /mo · $2,775/yr
- Insurance
- −$77
- HOA
- −$0
- Vacancy / Maint / Mgmt
- −$452
- Net cashflow
- $422
Break-even live
UW: 25.0% down · 7.5% · 30yr · 1.5% tax · 5.0% vac · 8.0% maint · 8.0% mgmt
Financing live
Cash to close
- Down payment
- $46,250
- Closing costs
- $5,550
- Reserves months
- —
- Total cash needed
- —
Loan-product check · same deal, 3 products live
Conventional
25% down · 7.5% · 30yr
- Down + closing
- —
- Monthly P&I
- —
- Monthly cashflow
- —
- DSCR
- —
- Eligible?
- —
Personal DTI + credit; lowest rate.
DSCR
20% down · 8.5% · 30yr
- Down + closing
- —
- Monthly P&I
- —
- Monthly cashflow
- —
- DSCR
- —
- Eligible?
- —
No personal income docs; deal must DSCR.
Hard money
10% down · 12.0% · 12mo
- Down + closing
- —
- Monthly P&I
- —
- Monthly cashflow
- —
- DSCR
- —
- Eligible?
- —
Short-term bridge; refi at stabilization.
Rent comps 1 comps
| Address | Beds | Baths | Sqft | Rent | $/sqft | DOM | Units | Dist |
|---|---|---|---|---|---|---|---|---|
| 2600 Netherland Ave Bronx, NY | 1.0–3.0 | 1.0–2.5 | 1132 | $2,775 | $2.45 | 22d | 3 | 1.02mi |
Listing history 12 events
-
2026-06-18days on market $185,000 Active 220 DOM
-
2026-06-17days on market $185,000 Active 219 DOM
-
2026-06-15days on market $185,000 Active 217 DOM
-
2026-06-13days on market $185,000 Active 215 DOM
-
2026-06-10days on market $185,000 Active 211 DOM
-
2026-06-08days on market $185,000 Active 210 DOM
-
2026-06-03days on market $185,000 Active 205 DOM
-
2026-06-01days on market $185,000 Active 203 DOM
-
2026-05-31days on market $185,000 Active 202 DOM
-
2025-11-10$185,000 Active
-
2025-07-02historical $3,200
-
2025-03-27$3,200
ⓘ Source: listings_history table (triggers on properties + properties_extension) + one-shot
backfill from property_details.listing_events for pre-trigger history.
Climate risk First Street
- Flood 1/10 Low FEMA zone X (unshaded) · 0% chance over 30 yrs
- Wildfire 1/10 Low
- Heat 6/10 Major 7 d/yr ≥99°F today · 14 d/yr by 30 yrs out
- Wind 6/10 Major 27% chance of damaging wind over 30 yrs
- Air quality 3/10 Moderate 3 unhealthy d/yr today · 4 by 30 yrs out
Nearby sold comps map
Loading sold comps map…
Walkable amenities ~0.75 mi
Loading nearby amenities…
Taxation est. · year 1
- Rental income
- $25,833
- − Mortgage interest
- −$10,363
- − Property taxes
- −$2,775
- − Insurance
- −$925
- − Repairs & maintenance
- −$2,067
- − Management
- −$2,067
- − Depreciation
- −$5,382
- Taxable income
- $2,255
- Est. tax owed @ 24.0%
- −$541
- After-tax cash flow
- $4,525/yr
For passive investors: Depreciation is non-cash, so a rental often shows a tax loss while cash-flowing — sheltering income. Rental losses are passive: they offset passive income freely, and up to $25,000/yr can offset ordinary (W-2) income if you actively participate and your MAGI is under $100k (phasing out to $0 by $150k); unused losses carry forward. On sale, claimed depreciation is recaptured at up to 25%, and gains may owe capital-gains tax (a 1031 exchange can defer both). Figures are a year-1 estimate at your 24.0% rate — not tax advice; consult a CPA.
Schools (NCES district)
No district data.
Livability — New York
- Score
- 75/100
- State rank
- #268
- US rank
- #4188
Category grades
Schools grade is shown separately in the Schools card above.
Census & demographics
- Census place
- New York, NY
- County
- Bronx County · 1,197,324 people
- City population
- 7,731,280
- Metro
- New York-Newark-Jersey City, NY-NJ-PA
- Population (ZIP)
- 75,557
- Household income
- $46,233
- Rent vs Own
- Severe rent burden
- 9659.0
Population outlook (Bronx County) Hauer SSP2
- Today (2025)
- 1,607,353 people
- By 2030
- 1,681,852 · +4.6%
- By 2040
- 1,824,421 · +13.5%
- By 2050
- 1,945,470 · +21.0%
- By 2075
- 2,187,887 · +36.1%
- By 2100
- 2,244,136 · +39.6%
Race, ethnicity, and origin ACS 2023
- Neighborhood character
- Predominantly Hispanic (76%)
- Race & ethnicity
- Hispanic / Latino 76% Black 17% Two or more races 15% White 3% Asian 2% Native American 2%
- Hispanic origin (detail)
- Mexican 10% Puerto Rican 11% Dominican 45%
- Common ancestry
- Hispanic 1%
- Foreign-born
- 46% · Canada, Vietnam, Jamaica
- Languages at home
- 22% English-only · Spanish 69% French/Haitian/Cajun 1% Other Indo-European 1%
Political lean MEDSL · Bronx
- 2024 margin
- Solid D (+45.4) · D 72.7% · R 27.3%
- 2008→2024 swing
- -32.3pp toward R · 2008: 77.8pp · 2024: 45.4pp
- All cycles
- 2024: D+45.4 2020: D+67.6 2016: D+79.1 2012: D+82.9 2008: D+77.8
Not yet ingested
- Civics
- —
Market trends
- HPI YoY
- ▲ 0.50%
- Current HPI
- 249.8923
- Rent YoY
- ▲ 6.70%
- Metro
- New York-Newark-Jersey City, NY-NJ-PA
- State GDP YoY
- ▲ 2.60%
- F500 in state
- 92
Industry mix (Fortune 500 HQ in NY)
| Industry | F500 HQs | Revenue |
|---|---|---|
| Financial Services | 10 | $950B |
|
||
| Consumer Goods | 9 | $162B |
|
||
| Insurance | 4 | $225B |
|
||
| Telecommunications | 2 | $144B |
|
||
| Pharmaceuticals | 2 | $112B |
|
||
| Media / Entertainment | 2 | $69B |
|
||
Price history
+5681.2% since first listed3 events — show timeline
- 2025-11-10 Listed $185,000 ForSaleByOwner.com
- 2025-07-02 Rental Removed $3,200 ONEKEY
- 2025-03-27 Listed for Rent $3,200 ONEKEY
Cash-flow waterfall
monthlySold comps — $/sqft
last 12 mo · ≤1 miLoading sold comps…