 Duplex
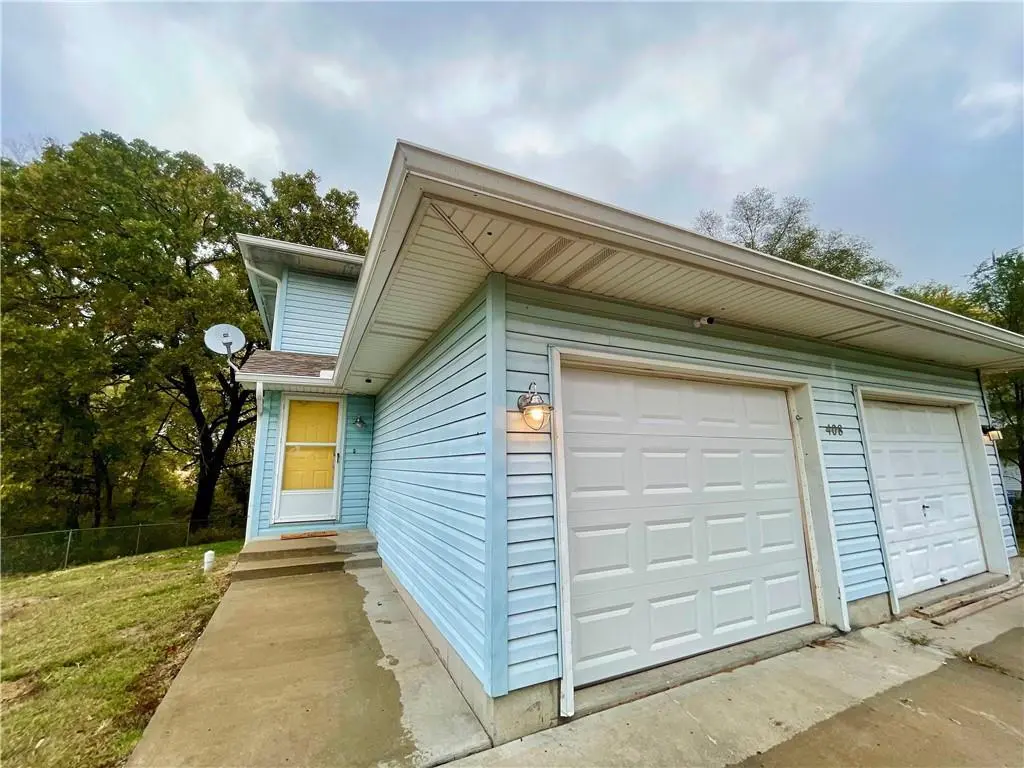
408 E Main Unit 1 & 2 St · Smithville, MO
Flood risk 8/10 · Major
- FEMA flood zone
- X (shaded)
- Chance of flooding over 30 yrs
- 0.99%
- Est. flood insurance / yr
- $473 – $860
Fire risk 4/10 · Minor
- Est. fire insurance / yr
- $1,054 – $1,958
Heat risk 4/10 · Minor
- Hot days now (above 106°F)
- 7 days/yr
- Hot days in 30 yrs
- 17 days/yr
Wind risk 2/10 · Minimal
- Chance of severe wind over 30 yrs
- —
Air-quality risk 3/10 · Minor
- Unhealthy air days now
- 3 days/yr
- Unhealthy air days in 30 yrs
- 4 days/yr
Risk factors via First Street. Map © Google.
Why this score? — see what drove the D- grade
The composite is a weighted blend of 9 inputs, each scored 0–100. Each bar is that input's sub-score; the figure is the points it added to the 100-point composite (weight × sub-score).
- ARV discount +15.0/15.0
- Cash flow +7.5/30.0
- Schools +4.8/10.0
- Livability +3.4/5.0
- Rent growth +2.5/5.0
- Condition / age +2.5/5.0
- 1% rule +1.7/10.0
- DSCR +1.7/10.0
- Appreciation +0.0/10.0
$359,000
🖨 Deal sheet 📄 Offer letter ✓ Due diligence
Multi-family units
County records classify this as Multi-Family (2-4 Unit). Listing-text estimate: 2 units. confirmed
Listing remarks MLS
Awesome income property or owner occupant. Live in one side and rent the other. Presently unit 1 is an airbnb with great income and unit 2 is a long term rental. Awesome location to walk to town, enjoy the lake activities, shop etc. Documentation available to interested parties on long term and short term.
Key facts
- Long term rental
- Great location
- Lake activities
Tags
Neighborhood map
What this means for you Summary
Snapshot
- This is a 2 × 2-bed/1-bath units multifamily listed at $359k.
Deal economics
- At list price, monthly cash flow is $-497 ($-6k/yr) — negative. Per door: $-248/mo.
- To cash-flow at today's rent, offer at most $271k (24.4% below list).
- To meet the 1% rule (rent ≥ 1% of price), the offer needs to be $240k (33.1% below list).
- Recommended offer: $240k (33.1% below list) — sets the bar for 1% rule.
- Cap rate 4.8% vs local median 3.3% in Smithville — top-decile yield for the area; either an underpriced asset or a hidden risk that comps aren't pricing in. Stress-test before assuming the spread holds.
Location & tenants
- Location reads 67/100 on livability (#230 in MO) — a middle-class / working-renter tenant base. Strengths: employment A+, cost of living A+, housing A+; Watch: amenities F, commute F, health & safety F.
- Smithville R-II (suburban): math 53% / reading 54% proficiency, ranked #20 of 324 in MO (top 6%) — acceptable for families but not a draw, mixed tenant base, ~2y average lease; only 12% free/reduced lunch — higher-income household profile.
- Market conditions: 156 active listings in the ZIP; 1 comparable units currently listed for rent nearby; 341 units permitted in Clay County in 2024 (40 in 5+ unit buildings).
Forward outlook
- Local home prices are declining (-3.0%/yr); year-one equity from $2k of loan paydown is wiped out by about $11k of value loss. Plan a longer hold.
- Clay County population projected at +24% by 2050 — long-run rental-demand tailwind backs the buy-and-hold thesis.
Negotiation context
- It's been on market 62 days — a 6% lower offer ($337k) is reasonable based on typical stale-listing flexibility.
- 4 sale attempts since 27y ago; this cycle's ask has dropped $56k (13%) from the opening price — seller is motivated, your offer sets the floor, not the list.
Risks & watch-outs
- Watch-outs: flood insurance adds $56/mo.
- Climate carrying-cost: severe flood risk — expect insurance premiums to compound above CPI over the hold.
Questions for the listing agent
- What do current leases actually rent for vs. the listed asking? Can we see a recent rent roll and the last 12 months of T-12 income?
- It's been on market 62 days. Have you received any prior offers? Is the seller open to a 33% concession, seller financing, or rate buy-down credit?
- Can we see the unit-by-unit rent roll, current vacancy, and any below-market leases? What's the average tenancy length?
- What capital expenditures (roof, boiler, parking lot, exteriors) have been made in the last 5 years, and what's planned in the next 2?
- What's the actual annual flood-insurance premium (NFIP or private), and is the property in a SFHA with mandatory coverage?
- Why hasn't it sold? Are there any deal-killer items the seller is aware of (foundation, flood, title, zoning, code violations)?
- Is there a deadline driving the sale (1031 exchange, divorce, estate, relocation)? That informs how much negotiation room exists.
- Schools are B-rated — typically a magnet for longer-tenancy family renters. What's the average tenant stay here, and is there a school-zone premium baked into asking?
- The area grade is low — what's the realistic commute time and amenity access for the typical tenant pool here? Any planned neighborhood developments (good or bad) we should know about?
- What's the average days-on-market for RENTAL listings here right now (not sales)? A rising rental-DOM trend means longer vacancies and softer asking-rent achievability than the comps imply.
- What's the recent tenant-quality profile in this submarket — average credit score on applications, eviction rate, late-payment / NSF rate, and stable-employment percentage? A property-management company in the area should have these aggregated.
- How much new apartment / multifamily construction is in the pipeline within 1–3 miles? Heavy new supply (>2% of stock underway) typically softens rents 12–24 months out; light construction supports rent growth.
Investment metrics
- 1% rule
- 0.67% ✗
- Cap rate
- 4.82%
- Cash-on-cash
- -5.26%
- DSCR
- 0.77
- GRM
- 12.5
CMA / ARV
- ARV (median comp)
- $445,811
- List price
- $359,000
- Delta
- -19.47%
- Verdict
- UNDERPRICED
- Comps
- 1 within 2.0 mi
Projected returns pro-forma
-3.0% appreciation · 3.0% rent growth · sell at horizon
- IRR
- -26.5%
- Equity multiple
- 0.11×
- Total profit
- $-89,814
- Equity at exit
- $53,528
- IRR
- -23.7%
- Equity multiple
- -0.18×
- Total profit
- $-119,002
- Equity at exit
- $31,040
Cash invested: $100,520 (down + closing). Projections, not guarantees.
Landlord ↔ Tenant lean methodology
- Overall (STATE)
- 81 Strongly Landlord-Friendly
- State Missouri
- 81 Strongly Landlord-Friendly · R+10
- County
- — inherits STATE
- City
- — inherits STATE
ZIP-level market 64089
- Home prices YoY
- -22.4%
- Active inventory
- 156
- Price-to-rent
- 24.9×
Monthly cashflow live
- Estimated rent
- $2,400 medium interval (Pro) →
- Mortgage (P&I)
- −$1,883
- Tax from tax record
- −$305 /mo · $3,657/yr
- Insurance
- −$150
- Flood insurance flood zone
- −$56 /mo · $666/yr
- HOA
- −$0
- Vacancy / Maint / Mgmt
- −$504
- Net cashflow
- $-497
Break-even live
2-unit breakdown (identical units grouped — click to expand)
| Units | Beds | Baths | Est. rent |
|---|---|---|---|
| 2× units | 2 | 1 | $2,400 |
| #1 | 2 | 1 | $1,200 |
| #2 | 2 | 1 | $1,200 |
| Total (2 units) | $2,400 | ||
UW: 25.0% down · 7.5% · 30yr · 1.5% tax · 5.0% vac · 8.0% maint · 8.0% mgmt
Financing live
Cash to close
- Down payment
- $89,750
- Closing costs
- $10,770
- Reserves months
- —
- Total cash needed
- —
Loan-product check · same deal, 3 products live
Conventional
25% down · 7.5% · 30yr
- Down + closing
- —
- Monthly P&I
- —
- Monthly cashflow
- —
- DSCR
- —
- Eligible?
- —
Personal DTI + credit; lowest rate.
DSCR
20% down · 8.5% · 30yr
- Down + closing
- —
- Monthly P&I
- —
- Monthly cashflow
- —
- DSCR
- —
- Eligible?
- —
No personal income docs; deal must DSCR.
Hard money
10% down · 12.0% · 12mo
- Down + closing
- —
- Monthly P&I
- —
- Monthly cashflow
- —
- DSCR
- —
- Eligible?
- —
Short-term bridge; refi at stabilization.
Rent comps 1 comps
| Address | Beds | Baths | Sqft | Rent | $/sqft | DOM | Units | Dist |
|---|---|---|---|---|---|---|---|---|
| 105 Sumac St Smithville, MO | 3.0 | 2.5 | 2528 | $2,399 | $0.95 | 23d | 1 | 1.24mi |
Listing history 25 events
-
2026-06-18days on market $359,000 Active 62 DOM
-
2026-06-17days on market $359,000 Active 61 DOM
-
2026-06-16days on market $359,000 Active 60 DOM
-
2026-06-15pricedays on market $359,000 Active 59 DOM
-
2026-06-13days on market $394,900 Active 57 DOM
-
2026-06-09days on market $394,900 Active 53 DOM
-
2026-06-08days on market $394,900 Active 52 DOM
-
2026-06-07days on market $394,900 Active 51 DOM
-
2026-06-05days on market $394,900 Active 48 DOM
-
2026-06-03days on market $394,900 Active 47 DOM
-
2026-06-02pricedays on market $394,900 Active 46 DOM
-
2026-06-01days on market $405,000 Active 45 DOM
-
2026-05-31days on market $405,000 Active 44 DOM
-
2026-04-29price $405,000 307-char remark
Show marketing remark (307 chars)
Awesome income property or owner occupant. Live in one side and rent the other. Presently unit 1 is an airbnb with great income and unit 2 is a long term rental. Awesome location to walk to town, enjoy the lake activities, shop etc. Documentation available to interested parties on long term and short term.
-
2026-04-17$415,000 Active 307-char remark
Show marketing remark (307 chars)
Awesome income property or owner occupant. Live in one side and rent the other. Presently unit 1 is an airbnb with great income and unit 2 is a long term rental. Awesome location to walk to town, enjoy the lake activities, shop etc. Documentation available to interested parties on long term and short term.
-
2012-11-19historical
-
2012-05-29$130,000
-
2006-09-18soldstatus
-
2006-09-18soldstatus
-
2001-06-21soldstatus
-
2001-06-20soldstatus
-
2001-05-12$79,500
-
2000-04-03soldstatus
-
2000-04-03soldstatus
-
1999-12-17$69,500
ⓘ Source: listings_history table (triggers on properties + properties_extension) + one-shot
backfill from property_details.listing_events for pre-trigger history.
Tax reassessment forecast MO · Resets to sale price
- Current annual tax
- $3,657 · $305/mo
- Projected year-2 tax
- $3,657 · $305/mo
- Expected delta
- $0/yr ($0/mo · -0.0%)
ⓘ Screening estimate from a state-policy table — verify with the county assessor before closing.
Climate risk First Street
- Flood 8/10 Severe FEMA zone X (shaded) · 99% chance over 30 yrs
- Wildfire 4/10 Moderate
- Heat 4/10 Moderate 7 d/yr ≥106°F today · 17 d/yr by 30 yrs out
- Wind 2/10 Low
- Air quality 3/10 Moderate 3 unhealthy d/yr today · 4 by 30 yrs out
Nearby sold comps map
Loading sold comps map…
Walkable amenities ~0.75 mi
Loading nearby amenities…
Taxation est. · year 1
- Rental income
- $28,800
- − Mortgage interest
- −$20,110
- − Property taxes
- −$3,657
- − Insurance
- −$2,462
- − Repairs & maintenance
- −$2,304
- − Management
- −$2,304
- − Depreciation
- −$10,444
- Taxable loss
- −$12,480
- Est. tax savings @ 24.0%
- +$2,995
- After-tax cash flow
- $-2,963/yr
For passive investors: Depreciation is non-cash, so a rental often shows a tax loss while cash-flowing — sheltering income. Rental losses are passive: they offset passive income freely, and up to $25,000/yr can offset ordinary (W-2) income if you actively participate and your MAGI is under $100k (phasing out to $0 by $150k); unused losses carry forward. On sale, claimed depreciation is recaptured at up to 25%, and gains may owe capital-gains tax (a 1031 exchange can defer both). Figures are a year-1 estimate at your 24.0% rate — not tax advice; consult a CPA.
Schools (NCES district)
- District
- Smithville R-II
- NCES district ID
- 2928410
- Math proficiency
- 53% ▼ -3.00%
- Reading proficiency
- 54% ▼ -3.00%
- Median HH income
- $74,017
- Composite
- 47.98/100
- National rank
- #2202
- State rank
- #20 of 324 in MO
Livability — Smithville
- Score
- 67/100
- State rank
- #230
- US rank
- #11187
Category grades
Schools grade is shown separately in the Schools card above.
Census & demographics
- Census place
- Smithville, MO
- Population (ZIP)
- 14,060
Population outlook (Clay County) Hauer SSP2
- Today (2025)
- 266,022 people
- By 2030
- 280,057 · +5.3%
- By 2040
- 306,153 · +15.1%
- By 2050
- 328,630 · +23.5%
- By 2075
- 375,182 · +41.0%
- By 2100
- 392,861 · +47.7%
Race, ethnicity, and origin ACS 2023
- Neighborhood character
- Predominantly White (95%)
- Race & ethnicity
- White 95% Two or more races 2% Hispanic / Latino 2%
- Common ancestry
- Italian 4% Lithuanian 3% Serbian 2%
- Foreign-born
- 0%
- Languages at home
- 98% English-only · Spanish 1%
Political lean MEDSL · Clay
- 2024 margin
- Lean R (+5.6) · D 46.4% · R 52.0% · Other 1.6%
- 2008→2024 swing
- -4.9pp toward R · 2008: -0.7pp · 2024: -5.6pp
- All cycles
- 2024: R+5.6 2020: R+4.1 2016: R+11.1 2012: R+8.4 2008: R+0.7
Not yet ingested
- Civics
- —
Market trends
- HPI YoY
- ▼ -71.29%
- Current HPI
- 246.8707
- Rent YoY
- —
- Metro
- —
- State GDP YoY
- ▲ 1.84%
- F500 in state
- 20
Industry mix (Fortune 500 HQ in MO)
| Industry | F500 HQs | Revenue |
|---|---|---|
| Healthcare | 1 | $163B |
|
||
| Insurance | 1 | $21B |
|
||
| Industrial Technology | 1 | $17B |
|
||
| Retail | 1 | $16B |
|
||
| Industrial Distribution | 1 | $10B |
|
||
| Utilities | 1 | $9B |
|
||
Price history
+482.7% since first listed12 events — show timeline
- 2026-04-29 Price Changed $405,000 Heartland MLS as Distributed by MLS Grid
- 2026-04-17 Listed $415,000 Heartland MLS as Distributed by MLS Grid
- 2012-11-19 Listing Removed — Heartland MLS as Distributed by MLS Grid
- 2012-05-29 Listed $130,000 Heartland MLS as Distributed by MLS Grid
- 2006-09-18 Sold (Public Records) — Public Records
- 2006-09-18 Sold (Public Records) — Public Records
- 2001-06-21 Sold (Public Records) — Public Records
- 2001-06-20 Sold (MLS) — Heartland MLS as Distributed by MLS Grid
- 2001-05-12 Listed $79,500 Heartland MLS as Distributed by MLS Grid
- 2000-04-03 Sold (Public Records) — Public Records
- 2000-04-03 Sold (MLS) — Heartland MLS as Distributed by MLS Grid
- 1999-12-17 Listed $69,500 Heartland MLS as Distributed by MLS Grid
Property tax history
+4.5%/yrLatest (2025): $3,657 · +7.2% YoY. Source: county tax records.
Cash-flow waterfall
monthlySold comps — $/sqft
last 12 mo · ≤1 miLoading sold comps…