82489 3rd St · Searles Valley, CA
Flood risk 1/10 · Minimal
- FEMA flood zone
- X (unshaded)
- Chance of flooding over 30 yrs
- 0.0%
- Est. flood insurance / yr
- $507 – $1,088
Fire risk 3/10 · Minor
- Est. fire insurance / yr
- $659 – $1,223
Heat risk 8/10 · Major
- Hot days now (above 107°F)
- 7 days/yr
- Hot days in 30 yrs
- 19 days/yr
Wind risk 1/10 · Minimal
- Chance of severe wind over 30 yrs
- —
Air-quality risk 4/10 · Minor
- Unhealthy air days now
- 4 days/yr
- Unhealthy air days in 30 yrs
- 5 days/yr
Risk factors via First Street. Map © Google.
Why this score? — see what drove the B- grade
The composite is a weighted blend of 9 inputs, each scored 0–100. Each bar is that input's sub-score; the figure is the points it added to the 100-point composite (weight × sub-score).
- Cash flow +28.5/30.0
- DSCR +10.0/10.0
- ARV discount +7.5/15.0
- 1% rule +7.0/10.0
- Appreciation +5.0/10.0
- Livability +3.1/5.0
- Schools +3.0/10.0
- Rent growth +2.5/5.0
- Condition / age +2.5/5.0
$94,999
🖨 Deal sheet 📄 Offer letter ✓ Due diligence
Listing remarks MLS
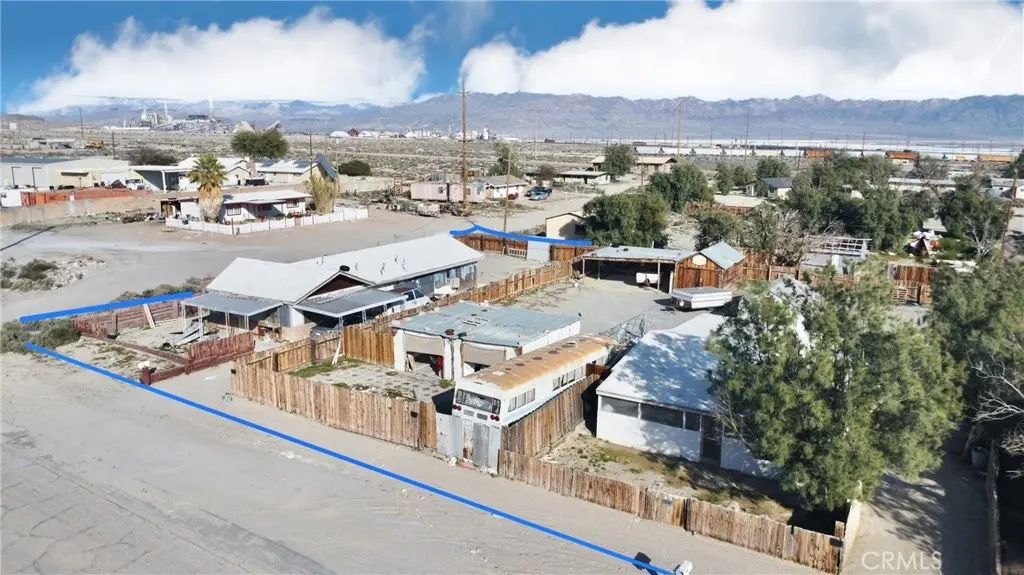
(Multi-Family)(2 HOMES FOR SALE) This special listing in Trona, California offers three parcels with two separate single-family homes on a combined 0.48 acres, approximately half an acre, creating a rare opportunity to own an entire section of the block. The far-left home features 3 bedrooms and 2 bathroom with approximately 1,488 square feet and is currently livable with water, electric, and gas connected, sits on conventional septic, has been remodeled by the seller over the years, and is in stable condition with good bones. The home to the right also offers 3 bedrooms but with 1 bathroom with approximately 1,530 square feet and is considered a light fixer from the interior, with some unlevel flooring, unfinished flooring in the hallway leading to the bathroom, and missing flooring in the third bedroom, but should be livable with minimal work and is also on conventional septic. The property includes a vacant lot located between the two homes, fencing, carports, large storage sheds, and much more, offering endless potential for investment, rental income, or multi-family use. This is a superb opportunity to own multiple parcels and homes in Trona with significant upside potential.
Key facts
- Vacant lot
- Fencing
- Large storage sheds
Tags
Neighborhood map
What this means for you Summary
Snapshot
- This is a 1-bed/1.0-bath single-family listed at $95k.
Deal economics
- At list price, monthly cash flow is $310 ($4k/yr) — positive.
- The deal already cash-flows at list — no discount required.
- Meets the 1% rule at list price ($1k rent vs $95k).
- Recommended offer: $84k (12.0% below list) — sets the bar for market timing.
Location & tenants
- Location reads 62/100 on livability (#500 in CA) — a middle-class / working-renter tenant base. Strengths: cost of living A+, housing A+, crime B; Watch: health & safety C-, schools F, amenities F.
- Trona Joint Unified (rural): math 25% / reading 40% proficiency, ranked #1,004 of 1,400 in CA (top 72%) — families likely to look elsewhere, expect single-tenant / working-renter base with shorter leases; 61% free/reduced lunch — lower-income household profile, screen leases tightly.
- Market conditions: 56 active listings in the ZIP; 5,458 units permitted in San Bernardino County in 2024 (1,500 in 5+ unit buildings).
Forward outlook
- In year one you build about $4k of equity ($657 loan paydown + $3k appreciation (3.0% local appreciation)).
- San Bernardino County population projected at +15% by 2050 — modest demand growth; plan on rents tracking national, not racing it.
- At projected returns (3.0% appreciation + 3.0% rent growth), your $27k cash investment doubles in ~4 years — after that, you're playing with house money.
- By year 10, paydown + projected appreciation supports a ~$34k cash-out refi (75% LTV) — recoverable capital for the next deal without selling this one.
Negotiation context
- It's been on market 138 days — a 12% lower offer ($84k) is reasonable based on typical stale-listing flexibility.
- 2 sale attempts since 18y ago with the ask held roughly flat each time — persistent listings suggest the price (not the market) is what's stuck; bring a comps-based counter.
- Current owner paid $24k; list at $95k implies a 288% gain — meaningful room to come down on a strong offer.
Risks & watch-outs
- Watch-outs: built in 1947 — expect roof / HVAC / electrical / plumbing capex.
- Climate carrying-cost: extreme-heat days projected 7→19/yr by 2055 (HVAC capex compounding) — expect insurance premiums to compound above CPI over the hold.
Questions for the listing agent
- It's been on market 138 days. Have you received any prior offers? Is the seller open to a 12% concession, seller financing, or rate buy-down credit?
- Built in 1947 — when were the roof, HVAC, electrical panel, plumbing, and water heater last replaced?
- Why hasn't it sold? Are there any deal-killer items the seller is aware of (foundation, flood, title, zoning, code violations)?
- Is there a deadline driving the sale (1031 exchange, divorce, estate, relocation)? That informs how much negotiation room exists.
- Schools are F-rated, which usually means shorter tenancies and higher turnover. Who's the typical renter profile here, and what's been the actual vacancy rate?
- What's the average days-on-market for RENTAL listings here right now (not sales)? A rising rental-DOM trend means longer vacancies and softer asking-rent achievability than the comps imply.
- What's the recent tenant-quality profile in this submarket — average credit score on applications, eviction rate, late-payment / NSF rate, and stable-employment percentage? A property-management company in the area should have these aggregated.
- How much new for-sale + rental construction is in the pipeline within 1–3 miles? Heavy new supply typically softens prices + rents 12–24 months out; constrained supply supports both.
Investment metrics
- 1% rule
- 1.20% ✓
- Cap rate
- 10.20%
- Cash-on-cash
- 13.97%
- DSCR
- 1.62
- GRM
- 6.9
CMA / ARV
- ARV (median comp)
- $26,000
- List price
- $94,999
- Delta
- 265.38%
- Verdict
- OVERPRICED
- Comps
- 1 within 2.0 mi
Projected returns pro-forma
3.0% appreciation · 3.0% rent growth · sell at horizon
- IRR
- 20.6%
- Equity multiple
- 2.17×
- Total profit
- $31,138
- Equity at exit
- $42,716
- IRR
- 21.7%
- Equity multiple
- 4.13×
- Total profit
- $83,199
- Equity at exit
- $65,830
Cash invested: $26,600 (down + closing). Projections, not guarantees.
Landlord ↔ Tenant lean methodology
- Overall (STATE)
- 18 Strongly Tenant-Friendly
- State California
- 18 Strongly Tenant-Friendly · D+13
- County
- — inherits STATE
- City
- — inherits STATE
ZIP-level market 93562
- Active inventory
- 56
- Price-to-rent
- 6.9×
Monthly cashflow live
- Estimated rent
- $1,141 medium interval (Pro) →
- Mortgage (P&I)
- −$498
- Tax from tax record
- −$54 /mo · $647/yr
- Insurance
- −$40
- HOA
- −$0
- Vacancy / Maint / Mgmt
- −$240
- Net cashflow
- $310
Break-even live
UW: 25.0% down · 7.5% · 30yr · 1.5% tax · 5.0% vac · 8.0% maint · 8.0% mgmt
Financing live
Cash to close
- Down payment
- $23,750
- Closing costs
- $2,850
- Reserves months
- —
- Total cash needed
- —
Loan-product check · same deal, 3 products live
Conventional
25% down · 7.5% · 30yr
- Down + closing
- —
- Monthly P&I
- —
- Monthly cashflow
- —
- DSCR
- —
- Eligible?
- —
Personal DTI + credit; lowest rate.
DSCR
20% down · 8.5% · 30yr
- Down + closing
- —
- Monthly P&I
- —
- Monthly cashflow
- —
- DSCR
- —
- Eligible?
- —
No personal income docs; deal must DSCR.
Hard money
10% down · 12.0% · 12mo
- Down + closing
- —
- Monthly P&I
- —
- Monthly cashflow
- —
- DSCR
- —
- Eligible?
- —
Short-term bridge; refi at stabilization.
Listing history 22 events
-
2026-06-18days on market $94,999 Active 138 DOM
-
2026-06-17days on market $94,999 Active 137 DOM
-
2026-06-16days on market $94,999 Active 136 DOM
-
2026-06-15days on market $94,999 Active 135 DOM
-
2026-06-14days on market $94,999 Active 133 DOM
-
2026-06-13days on market $94,999 Active 132 DOM
-
2026-06-10days on market $94,999 Active 130 DOM
-
2026-06-09days on market $94,999 Active 129 DOM
-
2026-06-08days on market $94,999 Active 128 DOM
-
2026-06-07days on market $94,999 Active 127 DOM
-
2026-06-05days on market $94,999 Active 124 DOM
-
2026-06-03days on market $94,999 Active 123 DOM
-
2026-06-03days on market $94,999 Active 122 DOM
-
2026-06-01days on market $94,999 Active 121 DOM
-
2026-05-31days on market $94,999 Active 120 DOM
-
2026-01-31$94,999 Active 1199-char remark
Show marketing remark (1199 chars)
(Multi-Family)(2 HOMES FOR SALE) This special listing in Trona, California offers three parcels with two separate single-family homes on a combined 0.48 acres, approximately half an acre, creating a rare opportunity to own an entire section of the block. The far-left home features 3 bedrooms and 2 bathroom with approximately 1,488 square feet and is currently livable with water, electric, and gas connected, sits on conventional septic, has been remodeled by the seller over the years, and is in stable condition with good bones. The home to the right also offers 3 bedrooms but with 1 bathroom with approximately 1,530 square feet and is considered a light fixer from the interior, with some unlevel flooring, unfinished flooring in the hallway leading to the bathroom, and missing flooring in the third bedroom, but should be livable with minimal work and is also on conventional septic. The property includes a vacant lot located between the two homes, fencing, carports, large storage sheds, and much more, offering endless potential for investment, rental income, or multi-family use. This is a superb opportunity to own multiple parcels and homes in Trona with significant upside potential.
-
2008-07-02price $19,900 62-char remark
Show marketing remark (62 chars)
In Trona, CA. in San Bernardino County. Not a short sale. REO.
-
2008-07-02soldstatus $24,500 62-char remark
Show marketing remark (62 chars)
In Trona, CA. in San Bernardino County. Not a short sale. REO.
-
2008-06-13historical 62-char remark
Show marketing remark (62 chars)
In Trona, CA. in San Bernardino County. Not a short sale. REO.
-
2008-01-20$24,500 62-char remark
Show marketing remark (62 chars)
In Trona, CA. in San Bernardino County. Not a short sale. REO.
-
1995-07-26soldstatus $10,000
-
1986-04-10soldstatus $14,000
ⓘ Source: listings_history table (triggers on properties + properties_extension) + one-shot
backfill from property_details.listing_events for pre-trigger history.
Tax reassessment forecast CA · Resets to sale price
- Current annual tax
- $647 · $54/mo
- Projected year-2 tax
- $722 · $60/mo
- Expected delta
- +$75/yr (+$6/mo · 11.6%)
ⓘ Screening estimate from a state-policy table — verify with the county assessor before closing.
Climate risk First Street
- Flood 1/10 Low FEMA zone X (unshaded) · 0% chance over 30 yrs
- Wildfire 3/10 Moderate
- Heat 8/10 Severe 7 d/yr ≥107°F today · 19 d/yr by 30 yrs out
- Wind 1/10 Low
- Air quality 4/10 Moderate 4 unhealthy d/yr today · 5 by 30 yrs out
Nearby sold comps map
Loading sold comps map…
Walkable amenities ~0.75 mi
Loading nearby amenities…
Taxation est. · year 1
- Rental income
- $13,689
- − Mortgage interest
- −$5,321
- − Property taxes
- −$647
- − Insurance
- −$475
- − Repairs & maintenance
- −$1,095
- − Management
- −$1,095
- − Depreciation
- −$2,764
- Taxable income
- $2,292
- Est. tax owed @ 24.0%
- −$550
- After-tax cash flow
- $3,165/yr
For passive investors: Depreciation is non-cash, so a rental often shows a tax loss while cash-flowing — sheltering income. Rental losses are passive: they offset passive income freely, and up to $25,000/yr can offset ordinary (W-2) income if you actively participate and your MAGI is under $100k (phasing out to $0 by $150k); unused losses carry forward. On sale, claimed depreciation is recaptured at up to 25%, and gains may owe capital-gains tax (a 1031 exchange can defer both). Figures are a year-1 estimate at your 24.0% rate — not tax advice; consult a CPA.
Schools (NCES district)
- District
- Trona Joint Unified
- NCES district ID
- 0639840
- Math proficiency
- 25% ▲ 5.00%
- Reading proficiency
- 40% ▲ 5.00%
- Median HH income
- $35,514
- Composite
- 29.6/100
- National rank
- #11751
- State rank
- #1004 of 1400 in CA
Livability — Searles Valley
- Score
- 62/100
- State rank
- #500
- US rank
- #16976
Category grades
Schools grade is shown separately in the Schools card above.
Census & demographics
- Census place
- Searles Valley, CA
- Population (ZIP)
- 1,822
Population outlook (San Bernardino County) Hauer SSP2
- Today (2025)
- 2,300,329 people
- By 2030
- 2,378,907 · +3.4%
- By 2040
- 2,523,137 · +9.7%
- By 2050
- 2,642,388 · +14.9%
- By 2075
- 2,880,769 · +25.2%
- By 2100
- 2,909,436 · +26.5%
Race, ethnicity, and origin ACS 2023
- Neighborhood character
- Predominantly White (65%)
- Race & ethnicity
- White 65% Hispanic / Latino 22% Two or more races 14% Black 2% Native American 2% Asian 1%
- Hispanic origin (detail)
- Mexican 16% Cuban 2%
- Common ancestry
- Italian 6% Slovak 2% Russian 1%
- Foreign-born
- 2% · Canada, China
- Languages at home
- 94% English-only · Spanish 4% Chinese 1%
Political lean MEDSL · San Bernardino
- 2024 margin
- Toss-up / Even · D 47.5% · R 49.7% · Other 2.8%
- 2008→2024 swing
- -8.5pp toward R · 2008: 6.3pp · 2024: -2.1pp
- All cycles
- 2024: R+2.1 2020: D+10.7 2016: D+9.8 2012: D+5.4 2008: D+6.3
Not yet ingested
- Civics
- —
Market trends
- HPI YoY
- —
- Current HPI
- —
- Rent YoY
- —
- Metro
- —
- State GDP YoY
- ▲ 3.21%
- F500 in state
- 116
Industry mix (Fortune 500 HQ in CA)
| Industry | F500 HQs | Revenue |
|---|---|---|
| Technology | 27 | $1,492B |
|
||
| Financial Services | 3 | $174B |
|
||
| Retail | 3 | $44B |
|
||
| Insurance | 3 | $26B |
|
||
| Media / Entertainment | 2 | $115B |
|
||
| Pharmaceuticals / Biotech | 2 | $62B |
|
||
Price history
+578.6% since first listed7 events — show timeline
- 2026-01-31 Listed $94,999 CRMLS
- 2008-07-02 Price Changed $19,900 GEMLS
- 2008-07-02 Sold (MLS) $24,500 GEMLS
- 2008-06-13 Delisted — GEMLS
- 2008-01-20 Listed $24,500 GEMLS
- 1995-07-26 Sold (Public Records) $10,000 Public Records
- 1986-04-10 Sold (Public Records) $14,000 Public Records
Property tax history
+3.5%/yrLatest (2025): $647 · +1.8% YoY. Source: county tax records.
Cash-flow waterfall
monthlySold comps — $/sqft
last 12 mo · ≤1 miLoading sold comps…