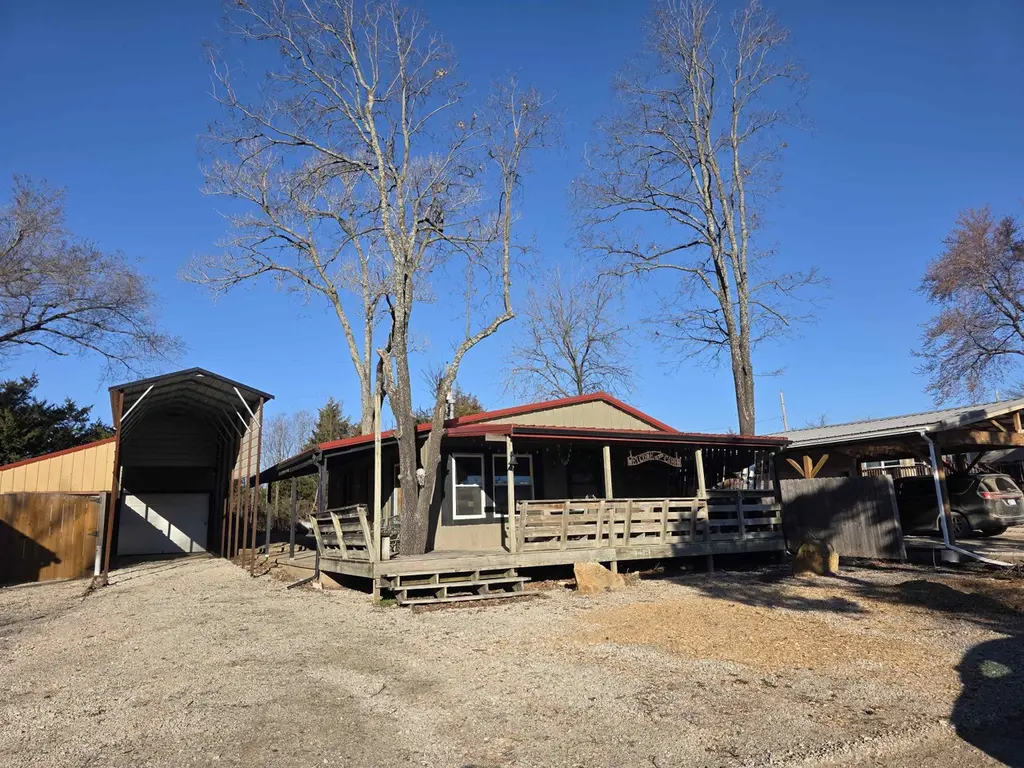
407 Y50 · Fall River, KS
Flood risk 1/10 · Minimal
- FEMA flood zone
- —
- Chance of flooding over 30 yrs
- 0.0%
- Est. flood insurance / yr
- —
Fire risk 7/10 · Major
- Est. fire insurance / yr
- $1,154 – $2,142
Heat risk 5/10 · Moderate
- Hot days now (above 108°F)
- 7 days/yr
- Hot days in 30 yrs
- 18 days/yr
Wind risk 2/10 · Minimal
- Chance of severe wind over 30 yrs
- 1.0%
Air-quality risk 4/10 · Minor
- Unhealthy air days now
- 4 days/yr
- Unhealthy air days in 30 yrs
- 4 days/yr
Risk factors via First Street. Map © Google.
Why this score? — see what drove the D grade
The composite is a weighted blend of 9 inputs, each scored 0–100. Each bar is that input's sub-score; the figure is the points it added to the 100-point composite (weight × sub-score).
- Cash flow +9.5/30.0
- Appreciation +8.1/10.0
- ARV discount +7.5/15.0
- Schools +3.6/10.0
- 1% rule +2.9/10.0
- Livability +2.9/5.0
- DSCR +2.7/10.0
- Rent growth +2.5/5.0
- Condition / age +2.5/5.0
$105,000
🖨 Deal sheet (PDF) 📄 Offer letter ✓ Due diligence
Key facts
- Covered deck
- Covered patios
- Remodeled kitchen
Tags
Property features AI
Finance
- HOA & community: Association trash service included
Exterior
- Parking: 1-car garage; RV access/parking
- Utilities: Propane service; Rural water; Septic tank
- Home design: Single-family onsite built home; Entry level: One level
- Construction: Metal roof; Crawl space foundation
- Exterior features: One-story; Patio; Covered patio; Deck; Storm windows; Fencing (other)
Interior
- Kitchen: Microwave; Refrigerator
- Bathrooms: 1 full bathroom
- Heating & cooling: Central air conditioning (electric); Forced air heating; Propane (rented)
- Interior features: Microwave; Refrigerator; No basement
- Laundry & utility: No laundry hookups / no laundry room
Neighborhood map
What this means for you Summary
Snapshot
- This is a 1-bed/1.0-bath single-family listed at $105k.
Deal economics
- At list price, monthly cash flow is $-72 ($-865/yr) — negative.
- To cash-flow at today's rent, offer at most $95k (9.9% below list).
- To meet the 1% rule (rent ≥ 1% of price), the offer needs to be $83k (21.2% below list).
- Recommended offer: $83k (21.2% below list) — sets the bar for 1% rule.
Location & tenants
- Location reads 57/100 on livability (#517 in KS) — a working-class tenant base; expect higher turnover. Strengths: cost of living A+, housing A+; Watch: health & safety C-, employment D, schools F.
- West Elk (rural): math 40% / reading 40% proficiency, ranked #79 of 280 in KS (top 28%) — families likely to look elsewhere, expect single-tenant / working-renter base with shorter leases.
- Market conditions: 9 active listings in the ZIP; 3 units permitted in Greenwood County in 2024 (0 in 5+ unit buildings).
Forward outlook
- In year one you build about $7k of equity ($726 loan paydown + $6k appreciation (6.1% local appreciation)).
- Greenwood County population projected at -35% by 2050 — secular population decline; favor cash flow + early exit over multi-decade hold.
- At projected returns (6.1% appreciation + 3.0% rent growth), your $29k cash investment doubles in ~5 years — after that, you're playing with house money.
- By year 5, paydown + projected appreciation supports a ~$32k cash-out refi (75% LTV) — recoverable capital for the next deal without selling this one.
Negotiation context
- It's been on market 116 days — a 9% lower offer ($96k) is reasonable based on typical stale-listing flexibility.
- 2 sale attempts; this cycle's ask has dropped $20k (16%) from the opening price — seller is motivated, your offer sets the floor, not the list.
- Current owner paid $26k; list at $105k implies a 296% gain — meaningful room to come down on a strong offer.
Risks & watch-outs
- Watch-outs: built in 1955 — expect roof / HVAC / electrical / plumbing capex.
- Climate carrying-cost: major wildfire risk; extreme-heat days projected 7→18/yr by 2055 (HVAC capex compounding) — expect insurance premiums to compound above CPI over the hold.
Questions for the listing agent
- What do current leases actually rent for vs. the listed asking? Can we see a recent rent roll and the last 12 months of T-12 income?
- It's been on market 116 days. Have you received any prior offers? Is the seller open to a 21% concession, seller financing, or rate buy-down credit?
- Built in 1955 — when were the roof, HVAC, electrical panel, plumbing, and water heater last replaced?
- Why hasn't it sold? Are there any deal-killer items the seller is aware of (foundation, flood, title, zoning, code violations)?
- Is there a deadline driving the sale (1031 exchange, divorce, estate, relocation)? That informs how much negotiation room exists.
- Schools are F-rated, which usually means shorter tenancies and higher turnover. Who's the typical renter profile here, and what's been the actual vacancy rate?
- Crime grade is F in this area — have there been break-ins, vandalism, or insurance claims at this property in the last 3 years? What carrier currently insures it and at what premium?
- The area grade is low — what's the realistic commute time and amenity access for the typical tenant pool here? Any planned neighborhood developments (good or bad) we should know about?
- What's the average days-on-market for RENTAL listings here right now (not sales)? A rising rental-DOM trend means longer vacancies and softer asking-rent achievability than the comps imply.
- What's the recent tenant-quality profile in this submarket — average credit score on applications, eviction rate, late-payment / NSF rate, and stable-employment percentage? A property-management company in the area should have these aggregated.
- How much new for-sale + rental construction is in the pipeline within 1–3 miles? Heavy new supply typically softens prices + rents 12–24 months out; constrained supply supports both.
Investment metrics
- 1% rule
- 0.79% ✗
- Cap rate
- 5.47%
- Cash-on-cash
- -2.94%
- DSCR
- 0.87
- GRM
- 10.6
CMA / ARV
No comps found within radius.
Projected returns pro-forma
6.13% appreciation · 3.0% rent growth · sell at horizon
- IRR
- 13.3%
- Equity multiple
- 1.90×
- Total profit
- $26,522
- Equity at exit
- $66,844
- IRR
- 13.8%
- Equity multiple
- 3.77×
- Total profit
- $81,428
- Equity at exit
- $121,946
Cash invested: $29,400 (down + closing). Projections, not guarantees.
Landlord ↔ Tenant lean methodology
- Overall (STATE)
- 83 Strongly Landlord-Friendly
- State Kansas
- 83 Strongly Landlord-Friendly · R+10
- County
- — inherits STATE
- City
- — inherits STATE
ZIP-level market 67047
- Home prices YoY
- 4.0%
- Active inventory
- 9
- Price-to-rent
- 10.6×
Monthly cashflow live
- Estimated rent
- $827 medium interval (Pro) →
- Mortgage (P&I)
- −$551
- Tax est. 1.5%
- −$131 /mo · $1,575/yr
- Insurance
- −$44
- HOA
- −$0
- Lot rent
- −$0
- Vacancy / Maint / Mgmt
- −$174
- Net cashflow
- $-72
Break-even live
Sensitivity live
| Price | -10% $0 | -5% $-36 | +0% $-72 | +5% $-108 | +10% $-145 |
|---|---|---|---|---|---|
| Rent | -10% $-137 | -5% $-105 | +0% $-72 | +5% $-39 | +10% $-7 |
| Rate | -1.0pp $-19 | -0.5pp $-45 | base $-72 | +0.5pp $-99 | +1.0pp $-127 |
UW: 25.0% down · 7.5% · 30yr · 1.5% tax · 5.0% vac · 8.0% maint · 8.0% mgmt
Financing live
Cash to close
- Down payment
- $26,250
- Closing costs
- $3,150
- Reserves months
- —
- Total cash needed
- —
Loan-product check · same deal, 3 products live
Conventional
25% down · 7.5% · 30yr
- Down + closing
- —
- Monthly P&I
- —
- Monthly cashflow
- —
- DSCR
- —
- Eligible?
- —
Personal DTI + credit; lowest rate.
DSCR
20% down · 8.5% · 30yr
- Down + closing
- —
- Monthly P&I
- —
- Monthly cashflow
- —
- DSCR
- —
- Eligible?
- —
No personal income docs; deal must DSCR.
Hard money
10% down · 12.0% · 12mo
- Down + closing
- —
- Monthly P&I
- —
- Monthly cashflow
- —
- DSCR
- —
- Eligible?
- —
Short-term bridge; refi at stabilization.
Listing history 25 events
-
2026-06-22days on market $105,000 Active 116 DOM
-
2026-06-21days on market $105,000 Active 115 DOM
-
2026-06-21days on market $105,000 Active 114 DOM
-
2026-06-18days on market $105,000 Active 112 DOM
-
2026-06-18price $105,000 Active 111 DOM
-
2026-06-17days on market $115,000 Active 111 DOM
-
2026-06-16days on market $115,000 Active 110 DOM
-
2026-06-15days on market $115,000 Active 109 DOM
-
2026-06-13days on market $115,000 Active 107 DOM
-
2026-06-12days on market $115,000 Active 106 DOM
-
2026-06-09days on market $115,000 Active 103 DOM
-
2026-06-08days on market $115,000 Active 102 DOM
-
2026-06-07days on market $115,000 Active 101 DOM
-
2026-06-05days on market $115,000 Active 99 DOM
-
2026-06-04days on market $115,000 Active 97 DOM
-
2026-06-02days on market $115,000 Active 96 DOM
-
2026-06-01days on market $115,000 Active 95 DOM
-
2026-05-31days on market $115,000 Active 94 DOM
-
2026-05-31days on market $115,000 Active 93 DOM
-
2026-05-20price $115,000
-
2026-02-26$125,000 Active
-
2026-01-01historical
-
2025-10-11$135,000 Active
-
2002-05-01soldstatus $26,500
-
1992-06-01soldstatus $4,200
ⓘ Source: listings_history table (triggers on properties + properties_extension) + one-shot
backfill from property_details.listing_events for pre-trigger history.
Climate risk First Street
- Flood 1/10 Low 0% chance over 30 yrs
- Wildfire 7/10 Severe
- Heat 5/10 Major 7 d/yr ≥108°F today · 18 d/yr by 30 yrs out
- Wind 2/10 Low 100% chance of damaging wind over 30 yrs
- Air quality 4/10 Moderate 4 unhealthy d/yr today · 4 by 30 yrs out
Nearby sold comps map
Loading sold comps map…
Walkable amenities ~0.75 mi
Loading nearby amenities…
Taxation est. · year 1
- Rental income
- $9,927
- − Mortgage interest
- −$5,882
- − Property taxes
- −$1,575
- − Insurance
- −$525
- − Repairs & maintenance
- −$794
- − Management
- −$794
- − Depreciation
- −$3,055
- Taxable loss
- −$2,698
- Est. tax savings @ 24.0%
- +$647
- After-tax cash flow
- $-218/yr
For passive investors: Depreciation is non-cash, so a rental often shows a tax loss while cash-flowing — sheltering income. Rental losses are passive: they offset passive income freely, and up to $25,000/yr can offset ordinary (W-2) income if you actively participate and your MAGI is under $100k (phasing out to $0 by $150k); unused losses carry forward. On sale, claimed depreciation is recaptured at up to 25%, and gains may owe capital-gains tax (a 1031 exchange can defer both). Figures are a year-1 estimate at your 24.0% rate — not tax advice; consult a CPA.
Schools (NCES district)
- District
- West Elk
- NCES district ID
- 2007500
- Math proficiency
- 40% ▬ 0.00%
- Reading proficiency
- 40% ▲ 10.00%
- Median HH income
- $36,442
- Composite
- 35.63/100
- National rank
- #9704
- State rank
- #79 of 280 in KS
Livability — Fall River
- Score
- 57/100
- State rank
- #517
- US rank
- #21586
Category grades
Schools grade is shown separately in the Schools card above.
Census & demographics
- Population (ZIP)
- 513
Population outlook (Greenwood County) Hauer SSP2
- Today (2025)
- 5,505 people
- By 2030
- 5,103 · -7.3%
- By 2040
- 4,287 · -22.1%
- By 2050
- 3,576 · -35.0%
- By 2075
- 2,370 · -56.9%
- By 2100
- 1,459 · -73.5%
Race, ethnicity, and origin ACS 2023
- Neighborhood character
- Predominantly White (99%)
- Race & ethnicity
- White 99% Two or more races 1%
- Common ancestry
- Italian 6% Slovak 3% Iranian 1%
Political lean MEDSL · Greenwood
- 2024 margin
- Solid R (+61.0) · D 18.8% · R 79.7% · Other 1.5%
- 2008→2024 swing
- -17.2pp toward R · 2008: -43.8pp · 2024: -61.0pp
- All cycles
- 2024: R+61.0 2020: R+60.8 2016: R+59.1 2012: R+49.3 2008: R+43.8
Not yet ingested
- Civics
- —
Market trends
- HPI YoY
- ▲ 6.13%
- Current HPI
- 159.4973
- Rent YoY
- —
- Metro
- —
- State GDP YoY
- —
- F500 in state
- 0
Price history
+2638.1% since first listed6 events — show timeline
- 2026-05-20 Price Changed $115,000 SCKMLS as Distributed by MLS Grid
- 2026-02-26 Listed $125,000 SCKMLS as Distributed by MLS Grid
- 2026-01-01 Listing Removed — SCKMLS as Distributed by MLS Grid
- 2025-10-11 Listed $135,000 SCKMLS as Distributed by MLS Grid
- 2002-05-01 Sold (Public Records) $26,500 Public Records
- 1992-06-01 Sold (Public Records) $4,200 Public Records
Cash-flow waterfall
monthlySold comps — $/sqft
last 12 mo · ≤1 miLoading sold comps…