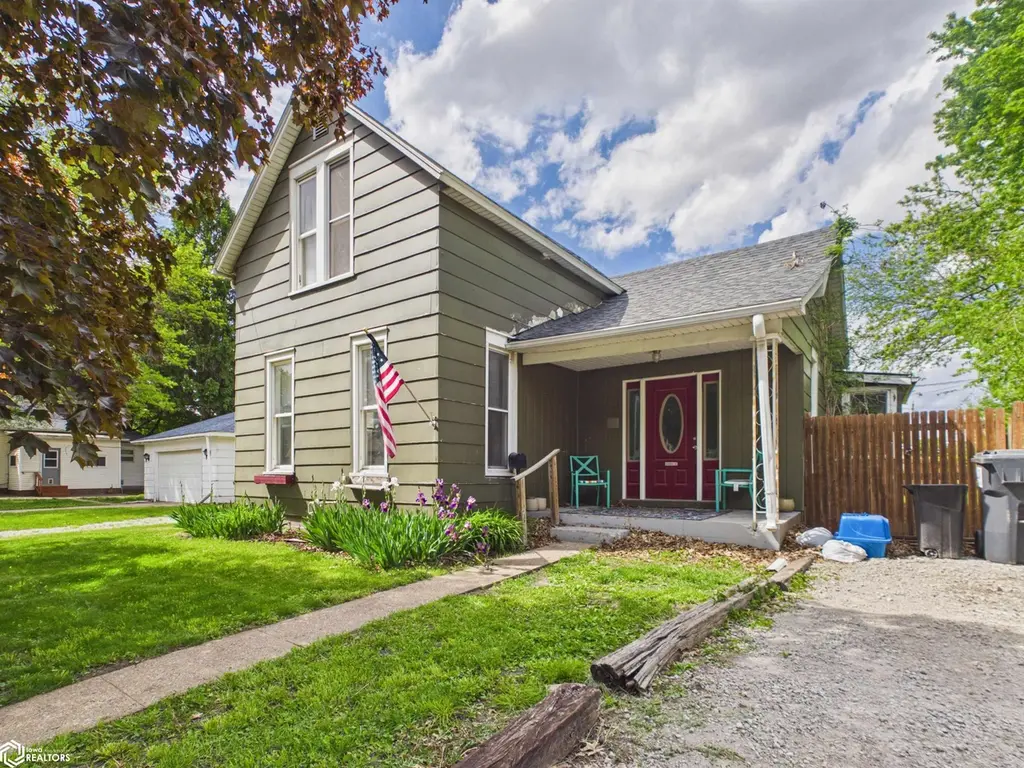
811 6th Ave E · Oskaloosa, IA
Flood risk 1/10 · Minimal
- FEMA flood zone
- X (unshaded)
- Chance of flooding over 30 yrs
- 0.0%
- Est. flood insurance / yr
- $473 – $860
Fire risk 1/10 · Minimal
- Est. fire insurance / yr
- $902 – $1,676
Heat risk 3/10 · Minor
- Hot days now (above 103°F)
- 7 days/yr
- Hot days in 30 yrs
- 16 days/yr
Wind risk 2/10 · Minimal
- Chance of severe wind over 30 yrs
- —
Air-quality risk 2/10 · Minimal
- Unhealthy air days now
- 1 days/yr
- Unhealthy air days in 30 yrs
- 1 days/yr
Risk factors via First Street. Map © Google.
Why this score? — see what drove the B grade
The composite is a weighted blend of 9 inputs, each scored 0–100. Each bar is that input's sub-score; the figure is the points it added to the 100-point composite (weight × sub-score).
- Cash flow +30.0/30.0
- 1% rule +10.0/10.0
- DSCR +10.0/10.0
- ARV discount +7.5/15.0
- Schools +5.4/10.0
- Livability +4.0/5.0
- Rent growth +2.5/5.0
- Condition / age +2.5/5.0
- Appreciation +0.0/10.0
$85,000
🖨 Deal sheet (PDF) 📄 Offer letter ✓ Due diligence
Listing remarks MLS
CHECK OUT THIS BEAUTIFULLY REMODELED 3BR/1BA HOME. Beautiful HARDWOOD FLOORING in over-sized foyer and living room and UNIQUE CERAMIC TILE in large kitchen. FRENCH DOORS open to patio & FENCED BACKYARD. MAIN FLOOR LAUNDRY. Large bathroom & bedroom complete the first floor. Beautiful open stairway to two additional bedrooms. * * * Updates include NEW ROOF, NEW WATER HEATER, plus so much more!!! Situated on a level lot.
Key facts
- Fenced in backyard
- 7,405 sq ft lot
- Built 1900
Tags
Property features AI
Exterior
- Parking: Gravel parking
- Utilities: Public water; Public sewer
- Home design: Single family residence; One and one-half story
- Construction: HardiPlank-type siding
- Exterior features: Gravel parking; Lot approximately 0.17 acres (60 x 120)
Interior
- Bathrooms: 1 full bathroom
- Interior features: Basement present; Central air conditioning; Forced air heating
Neighborhood map
What this means for you Summary
Snapshot
- This is a 4-bed/1.0-bath single-family listed at $85k.
Deal economics
- At list price, monthly cash flow is $496 ($6k/yr) — positive.
- The deal already cash-flows at list — no discount required.
- Meets the 1% rule at list price ($1k rent vs $85k).
- Recommended offer: $82k (3.0% below list) — sets the bar for market timing.
- Cap rate 13.3% vs local median 4.9% in Oskaloosa — top-decile yield for the area; either an underpriced asset or a hidden risk that comps aren't pricing in. Stress-test before assuming the spread holds.
Location & tenants
- Location reads 81/100 on livability (#57 in IA, #1,325 nationally) — a professional / high-income tenant draw. Strengths: cost of living A+, housing A+, health & safety A+; Watch: employment C-, amenities D-, commute F.
- Oskaloosa Community School District (rural): math 62% / reading 67% proficiency, ranked #208 of 289 in IA (top 72%) — acceptable for families but not a draw, mixed tenant base, ~2y average lease.
- Zoned schools: Oskaloosa Elementary School (math 67% / reading 62%, grade B, #317 of 616 statewide, top 58%, 886 students, 53% FRL); Oskaloosa Middle School (math 65% / reading 71%, grade A-, #131 of 246 statewide, top 53%, 454 students, 49% FRL); Oskaloosa High School (math 55% / reading 67%, grade C+, #258 of 336 statewide, top 78%, 600 students, 36% FRL) — zoned schools at 46% FRL track the district average.
- Market conditions: 73 active listings in the ZIP; 13 units permitted in Mahaska County in 2024 (0 in 5+ unit buildings).
Forward outlook
- Local home prices are declining (-3.0%/yr); year-one equity from $588 of loan paydown is wiped out by about $3k of value loss. Plan a longer hold.
- Mahaska County population projected at -10% by 2050 — secular population decline; favor cash flow + early exit over multi-decade hold.
- At projected returns (-3.0% appreciation + 3.0% rent growth), your $24k cash investment doubles in ~5 years — after that, you're playing with house money.
Negotiation context
- It's been on market 34 days — a 3% lower offer ($82k) is reasonable based on typical stale-listing flexibility.
- 2 sale attempts since 10y ago with the ask held roughly flat each time — persistent listings suggest the price (not the market) is what's stuck; bring a comps-based counter.
- Current owner paid $58k; 47% above their basis — modest negotiation headroom, anchor on the comps not their cost.
Risks & watch-outs
- Watch-outs: built in 1900 — expect roof / HVAC / electrical / plumbing capex.
Questions for the listing agent
- It's been on market 34 days. Have you received any prior offers? Is the seller open to a 3% concession, seller financing, or rate buy-down credit?
- Built in 1900 — when were the roof, HVAC, electrical panel, plumbing, and water heater last replaced?
- Is there a deadline driving the sale (1031 exchange, divorce, estate, relocation)? That informs how much negotiation room exists.
- Schools are B-rated — typically a magnet for longer-tenancy family renters. What's the average tenant stay here, and is there a school-zone premium baked into asking?
- What's the average days-on-market for RENTAL listings here right now (not sales)? A rising rental-DOM trend means longer vacancies and softer asking-rent achievability than the comps imply.
- What's the recent tenant-quality profile in this submarket — average credit score on applications, eviction rate, late-payment / NSF rate, and stable-employment percentage? A property-management company in the area should have these aggregated.
- How much new for-sale + rental construction is in the pipeline within 1–3 miles? Heavy new supply typically softens prices + rents 12–24 months out; constrained supply supports both.
Investment metrics
- 1% rule
- 1.64% ✓
- Cap rate
- 13.30%
- Cash-on-cash
- 25.01%
- DSCR
- 2.11
- GRM
- 5.1
CMA / ARV
- ARV (on-the-fly)
- $176,939
- Comps found
- 12
Show comp detail 12 sales within ~0.75 mi
| Address | Dist | Beds/Ba | Sqft | Sold | Price | $/sf | Match |
|---|---|---|---|---|---|---|---|
| 1012 5th Ave E | 0.16mi | 3/1.5 (-1) | 1,028 (-9%) | 1mo | $162,500 | $158 | 70 |
| 1013 4th Ave E | 0.20mi | 3/2.0 (-1) | 1,040 (-8%) | 3mo | $163,000 | $157 | 66 |
| 510 6th Ave E | 0.19mi | 4/1.0 | 1,233 (+9%) | 13mo | $60,000 | $49 | 65 |
| 1117 3rd Ave | 0.26mi | 3/1.0 (-1) | 992 (-12%) | 4mo | $175,000 | $176 | 59 |
| 316 N 1st St | 0.66mi | 3/1.0 (-1) | 1,092 (-3%) | 2mo | $89,000 | $82 | 58 |
| 614 S 7th St | 0.02mi | 3/2.0 (-1) | 1,294 (+15%) | 12mo | $169,900 | $131 | 55 |
| 1141 Clearview Dr | 0.54mi | 3/2.0 (-1) | 1,040 (-8%) | 0mo | $245,000 | $236 | 53 |
| 601 S Market St | 0.49mi | 4/1.5 | 1,008 (-11%) | 7mo | $135,000 | $134 | 52 |
| 514 A Ave E | 0.44mi | 3/2.0 (-1) | 1,228 (+9%) | 9mo | $247,500 | $202 | 48 |
| 1704 S 5th St | 0.69mi | 3/2.0 (-1) | 1,040 (-8%) | 4mo | $195,000 | $188 | 42 |
| 435 N 3rd St | 0.75mi | 3/1.0 (-1) | 1,048 (-7%) | 13mo | $150,000 | $143 | 37 |
| 412 4th Ave W | 0.70mi | 3/1.0 (-1) | 1,277 (+13%) | 14mo | $143,500 | $112 | 28 |
Match score weights: distance 35% · size 25% · config 20% · recency 20%. Top-matched comps best support the ARV.
Projected returns pro-forma
-3.0% appreciation · 3.0% rent growth · sell at horizon
- IRR
- 18.5%
- Equity multiple
- 1.75×
- Total profit
- $17,857
- Equity at exit
- $12,674
- IRR
- 26.9%
- Equity multiple
- 3.37×
- Total profit
- $56,372
- Equity at exit
- $7,349
Cash invested: $23,800 (down + closing). Projections, not guarantees.
Landlord ↔ Tenant lean methodology
- Overall (STATE)
- 83 Strongly Landlord-Friendly
- State Iowa
- 83 Strongly Landlord-Friendly · R+6
- County
- — inherits STATE
- City
- — inherits STATE
ZIP-level market 52577
- Home prices YoY
- -25.4%
- Active inventory
- 73
- Price-to-rent
- 5.1×
Monthly cashflow live
- Estimated rent
- $1,397 medium interval (Pro) →
- Mortgage (P&I)
- −$446
- Tax from tax record
- −$126 /mo · $1,512/yr
- Insurance
- −$35
- HOA
- −$0
- Vacancy / Maint / Mgmt
- −$293
- Net cashflow
- $496
Break-even live
Sensitivity live
| Price | -10% $544 | -5% $520 | +0% $496 | +5% $472 | +10% $448 |
|---|---|---|---|---|---|
| Rent | -10% $386 | -5% $441 | +0% $496 | +5% $551 | +10% $606 |
| Rate | -1.0pp $539 | -0.5pp $518 | base $496 | +0.5pp $474 | +1.0pp $452 |
UW: 25.0% down · 7.5% · 30yr · 1.5% tax · 5.0% vac · 8.0% maint · 8.0% mgmt
Financing live
Cash to close
- Down payment
- $21,250
- Closing costs
- $2,550
- Reserves months
- —
- Total cash needed
- —
Loan-product check · same deal, 3 products live
Conventional
25% down · 7.5% · 30yr
- Down + closing
- —
- Monthly P&I
- —
- Monthly cashflow
- —
- DSCR
- —
- Eligible?
- —
Personal DTI + credit; lowest rate.
DSCR
20% down · 8.5% · 30yr
- Down + closing
- —
- Monthly P&I
- —
- Monthly cashflow
- —
- DSCR
- —
- Eligible?
- —
No personal income docs; deal must DSCR.
Hard money
10% down · 12.0% · 12mo
- Down + closing
- —
- Monthly P&I
- —
- Monthly cashflow
- —
- DSCR
- —
- Eligible?
- —
Short-term bridge; refi at stabilization.
Listing history 15 events
-
2026-06-12statusdays on market $85,000 Pending 34 DOM
-
2026-06-09days on market $85,000 Active Under Contract 32 DOM
-
2026-06-08days on market $85,000 Active Under Contract 31 DOM
-
2026-06-07days on market $85,000 Active Under Contract 30 DOM
-
2026-06-07days on market $85,000 Active Under Contract 29 DOM
-
2026-06-04days on market $85,000 Active Under Contract 26 DOM
-
2026-06-02days on market $85,000 Active Under Contract 25 DOM
-
2026-06-01days on market $85,000 Active Under Contract 24 DOM
-
2026-05-31days on market $85,000 Active Under Contract 23 DOM
-
2026-05-31days on market $85,000 Active Under Contract 22 DOM
-
2026-05-15historical Active Under Contract
-
2026-05-08$85,000 Active
-
2017-03-13soldstatus $58,000
-
2017-03-10soldstatus $58,000 435-char remark
Show marketing remark (435 chars)
CHECK OUT THIS BEAUTIFULLY REMODELED 3BR/1BA HOME. Beautiful HARDWOOD FLOORING in over-sized foyer and living room and UNIQUE CERAMIC TILE in large kitchen. FRENCH DOORS open to patio & FENCED BACKYARD. MAIN FLOOR LAUNDRY. Large bathroom & bedroom complete the first floor. Beautiful open stairway to two additional bedrooms. * * * Updates include NEW ROOF, NEW WATER HEATER, plus so much more!!! Situated on a level lot.
-
2016-07-07$64,900 435-char remark
Show marketing remark (435 chars)
CHECK OUT THIS BEAUTIFULLY REMODELED 3BR/1BA HOME. Beautiful HARDWOOD FLOORING in over-sized foyer and living room and UNIQUE CERAMIC TILE in large kitchen. FRENCH DOORS open to patio & FENCED BACKYARD. MAIN FLOOR LAUNDRY. Large bathroom & bedroom complete the first floor. Beautiful open stairway to two additional bedrooms. * * * Updates include NEW ROOF, NEW WATER HEATER, plus so much more!!! Situated on a level lot.
ⓘ Source: listings_history table (triggers on properties + properties_extension) + one-shot
backfill from property_details.listing_events for pre-trigger history.
Tax reassessment forecast IA · Partial reset (capped growth)
- Current annual tax
- $1,512 · $126/mo
- Projected year-2 tax
- $1,512 · $126/mo
- Expected delta
- $0/yr ($0/mo · 0.0%)
ⓘ Screening estimate from a state-policy table — verify with the county assessor before closing.
Climate risk First Street
- Flood 1/10 Low FEMA zone X (unshaded) · 0% chance over 30 yrs
- Wildfire 1/10 Low
- Heat 3/10 Moderate 7 d/yr ≥103°F today · 16 d/yr by 30 yrs out
- Wind 2/10 Low
- Air quality 2/10 Low 1 unhealthy d/yr today · 1 by 30 yrs out
Nearby sold comps map
Loading sold comps map…
Walkable amenities ~0.75 mi
Loading nearby amenities…
Taxation est. · year 1
- Rental income
- $16,759
- − Mortgage interest
- −$4,761
- − Property taxes
- −$1,512
- − Insurance
- −$425
- − Repairs & maintenance
- −$1,341
- − Management
- −$1,341
- − Depreciation
- −$2,473
- Taxable income
- $4,906
- Est. tax owed @ 24.0%
- −$1,178
- After-tax cash flow
- $4,776/yr
For passive investors: Depreciation is non-cash, so a rental often shows a tax loss while cash-flowing — sheltering income. Rental losses are passive: they offset passive income freely, and up to $25,000/yr can offset ordinary (W-2) income if you actively participate and your MAGI is under $100k (phasing out to $0 by $150k); unused losses carry forward. On sale, claimed depreciation is recaptured at up to 25%, and gains may owe capital-gains tax (a 1031 exchange can defer both). Figures are a year-1 estimate at your 24.0% rate — not tax advice; consult a CPA.
Schools (NCES district)
- District
- Oskaloosa Community School District
- NCES district ID
- 1921870
- Math proficiency
- 62% ▼ -4.00%
- Reading proficiency
- 67% ▬ 0.00%
- Median HH income
- $44,362
- Composite
- 54.26/100
- National rank
- #1373
- State rank
- #208 of 289 in IA
Livability — Oskaloosa
- Score
- 81/100
- State rank
- #57
- US rank
- #1325
Category grades
Schools grade is shown separately in the Schools card above.
Census & demographics
- Census place
- Oskaloosa, IA
- Population (ZIP)
- 14,336
Population outlook (Mahaska County) Hauer SSP2
- Today (2025)
- 22,032 people
- By 2030
- 21,682 · -1.6%
- By 2040
- 20,750 · -5.8%
- By 2050
- 19,800 · -10.1%
- By 2075
- 17,839 · -19.0%
- By 2100
- 15,829 · -28.2%
Race, ethnicity, and origin ACS 2023
- Neighborhood character
- Predominantly White (92%)
- Race & ethnicity
- White 92% Two or more races 3% Hispanic / Latino 2% Black 2% Asian 1%
- Common ancestry
- Iranian 8% Italian 3% Portuguese 2%
- Foreign-born
- 2%
- Languages at home
- 97% English-only · Other Asian/Pacific 1% Spanish 1%
Political lean MEDSL · Mahaska
- 2024 margin
- Solid R (+51.6) · D 23.6% · R 75.2% · Other 1.1%
- 2008→2024 swing
- -35.1pp toward R · 2008: -16.5pp · 2024: -51.6pp
- All cycles
- 2024: R+51.6 2020: R+47.4 2016: R+45.7 2012: R+20.5 2008: R+16.5
Not yet ingested
- Civics
- —
Market trends
- HPI YoY
- ▼ -81.78%
- Current HPI
- 239.9131
- Rent YoY
- —
- Metro
- —
- State GDP YoY
- ▲ 2.48%
- F500 in state
- 4
Industry mix (Fortune 500 HQ in IA)
| Industry | F500 HQs | Revenue |
|---|---|---|
| Financial Services | 1 | $16B |
|
||
| Retail / Convenience | 1 | $15B |
|
||
Price history
+31.0% since first listed5 events — show timeline
- 2026-05-15 Contingent — IAR
- 2026-05-08 Listed $85,000 IAR
- 2017-03-13 Sold (Public Records) $58,000 Public Records
- 2017-03-10 Sold (MLS) $58,000 IAR
- 2016-07-07 Listed $64,900 IAR
Property tax history
+6.9%/yrLatest (2025): $1,512 · +0.7% YoY. Source: county tax records.
Cash-flow waterfall
monthlySold comps — $/sqft
last 12 mo · ≤1 miLoading sold comps…