2930 Hawk St · Federal Heights, CO
Flood risk 1/10 · Minimal
- FEMA flood zone
- X (unshaded)
- Chance of flooding over 30 yrs
- 0.0%
- Est. flood insurance / yr
- $507 – $1,088
Fire risk 1/10 · Minimal
- Est. fire insurance / yr
- $939 – $1,743
Heat risk 3/10 · Minor
- Hot days now (above 92°F)
- 7 days/yr
- Hot days in 30 yrs
- 18 days/yr
Wind risk 2/10 · Minimal
- Chance of severe wind over 30 yrs
- —
Air-quality risk 4/10 · Minor
- Unhealthy air days now
- 6 days/yr
- Unhealthy air days in 30 yrs
- 8 days/yr
Risk factors via First Street. Map © Google.
Why this score? — see what drove the D grade
The composite is a weighted blend of 9 inputs, each scored 0–100. Each bar is that input's sub-score; the figure is the points it added to the 100-point composite (weight × sub-score).
- Cash flow +10.9/30.0
- 1% rule +10.0/10.0
- ARV discount +6.3/15.0
- Livability +3.8/5.0
- Condition / age +3.8/5.0
- Schools +3.5/10.0
- DSCR +3.2/10.0
- Rent growth +2.7/5.0
- Appreciation +0.0/10.0
$65,000
🖨 Deal sheet (PDF) 📄 Offer letter ✓ Due diligence
Listing remarks
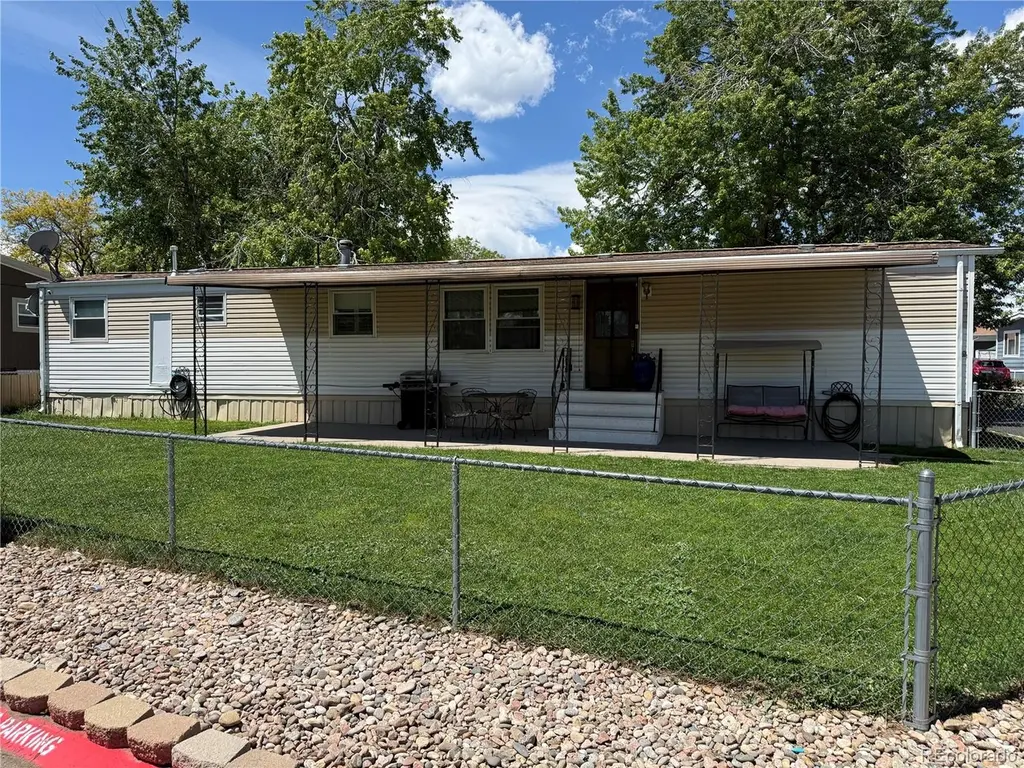
This well-maintained corner 2-bedroom, 1-bath mobile home offers comfort and modern living in a compact space. It features an attached 1-car oversized garage on one side and an attached covered front porch. All appliances are included. Whether you’re a first-time buyer, downsizing, or investing, this home stands out with its thoughtful improvements and move-in-ready condition. The kitchen and bathroom were updated in 2017. Don’t miss out on this opportunity!
Key facts
- Garage
- Built 1971
- Listed 24 days
Property features AI
Finance
- Financial info: Month-to-month land lease with a monthly payment of $931 (lease expires May 31, 2026); Association fee annual total: $11,172
- HOA & community: Association: Denver Cascade (professionally managed); Monthly association fee of $931; Clubhouse amenity
Exterior
- Parking: Attached 1-car garage; Total of 1 parking space
- Utilities: Public water; Community sewer; Electricity connected; Natural gas connected; Wired internet available; Cable available
- Home design: Manufactured in park (mobile home); Individual ownership
- Construction: Metal siding; Shingle and rolled/hot mop roof; Metal skirting; 66 ft by 14 ft mobile dimensions
- Exterior features: Fenced pasture; Covered front porch; Patio/porch
Interior
- Kitchen: Kitchen
- Bedrooms: Two bedrooms on the main level
- Bathrooms: One full bathroom on the main level
- Heating & cooling: Forced air heating; Central air conditioning
- Interior features: Covered front porch
Neighborhood map
What this means for you Summary
Snapshot
- This is a 2-bed/1.0-bath manufactured listed at $65k. Condition is rated good.
Deal economics
- At list price, monthly cash flow is $-28 ($-337/yr) — negative.
- To cash-flow at today's rent, offer at most $61k (6.2% below list).
- Meets the 1% rule at list price ($2k rent vs $65k).
- Recommended offer: $61k (6.2% below list) — sets the bar for cash-flow.
- Cap rate 5.8% vs local median 4.0% in Federal Heights — top-decile yield for the area; either an underpriced asset or a hidden risk that comps aren't pricing in. Stress-test before assuming the spread holds.
Location & tenants
- Location reads 76/100 on livability (#28 in CO, #3,380 nationally) — a middle-class / working-renter tenant base. Strengths: commute A+, cost of living A+, housing A+; Watch: health & safety D+, crime F.
- Adams 12 Five Star Schools (suburban): math 31% / reading 46% proficiency, ranked #26 of 86 in CO (top 30%) — families likely to look elsewhere, expect single-tenant / working-renter base with shorter leases.
- Zoned schools: Federal Heights Elementary School (math 2% / reading 8%, grade F, #958 of 966 statewide, top 100%, 414 students, 87% FRL); Northglenn Middle School (math 8% / reading 12%, grade F, #246 of 270 statewide, top 91%, 684 students, 85% FRL); Northglenn High School (math 16% / reading 38%, grade F, #257 of 381 statewide, top 68%, 1,959 students, 69% FRL) — zoned schools average 81% FRL vs 33% district-wide (47 pts higher); higher-poverty schools than district average — tighter screening recommended.
- Zoned-school proficiency averages 14% at this address vs 38% district-wide (-24 pts) — the specific schools serving this property underperform the Adams 12 Five Star Schools average; the district grade overstates school quality for this exact location.
- Market conditions: Rents flat; 135 active listings in the ZIP; 34 comparable units currently listed for rent nearby; rentals at typical pace (median 20d on market — plan ~3-4 weeks tenant-placement turnaround); 2,299 units permitted in Adams County in 2024 (343 in 5+ unit buildings).
- This rent runs 33% of the median local income ($62k/yr) — at the standard rent-burdened threshold; future hikes will face affordability resistance.
Forward outlook
- Local home prices are declining (-3.0%/yr); year-one equity from $449 of loan paydown is wiped out by about $2k of value loss. Plan a longer hold.
- Adams County population projected at +44% by 2050 — long-run rental-demand tailwind backs the buy-and-hold thesis.
Negotiation context
- It's been on market 24 days — a 2% lower offer ($64k) is reasonable based on typical stale-listing flexibility.
Risks & watch-outs
- Watch-outs: HOA is 54% of rent.
Questions for the listing agent
- What do current leases actually rent for vs. the listed asking? Can we see a recent rent roll and the last 12 months of T-12 income?
- Built in 1971 — when were the roof, HVAC, electrical panel, plumbing, and water heater last replaced?
- What does the HOA fee cover, when was the last increase, and are there any pending special assessments or reserve-fund shortfalls?
- Is there a deadline driving the sale (1031 exchange, divorce, estate, relocation)? That informs how much negotiation room exists.
- Schools are F-rated, which usually means shorter tenancies and higher turnover. Who's the typical renter profile here, and what's been the actual vacancy rate?
- Crime grade is F in this area — have there been break-ins, vandalism, or insurance claims at this property in the last 3 years? What carrier currently insures it and at what premium?
- The area grade is low — what's the realistic commute time and amenity access for the typical tenant pool here? Any planned neighborhood developments (good or bad) we should know about?
- What's the average days-on-market for RENTAL listings here right now (not sales)? A rising rental-DOM trend means longer vacancies and softer asking-rent achievability than the comps imply.
- What's the recent tenant-quality profile in this submarket — average credit score on applications, eviction rate, late-payment / NSF rate, and stable-employment percentage? A property-management company in the area should have these aggregated.
- How much new for-sale + rental construction is in the pipeline within 1–3 miles? Heavy new supply typically softens prices + rents 12–24 months out; constrained supply supports both.
Investment metrics
- 1% rule
- 2.63% ✓
- Cap rate
- 5.77%
- Cash-on-cash
- -1.85%
- DSCR
- 0.92
- GRM
- 3.2
CMA / ARV
- ARV (on-the-fly)
- $63,364
- Comps found
- 8
Show comp detail 8 sales within ~0.75 mi
| Address | Dist | Beds/Ba | Sqft | Sold | Price | $/sf | Match |
|---|---|---|---|---|---|---|---|
| 2820 Cascade Dr | 0.13mi | 2/2.0 | 840 (-3%) | 7mo | $75,000 | $89 | 78 |
| 9760 Peacock St | 0.15mi | 3/2.0 (+1) | 896 (+3%) | 9mo | $65,000 | $73 | 71 |
| 2810 Cascade Dr | 0.13mi | 3/2.0 (+1) | 952 (+10%) | 2mo | $65,000 | $68 | 67 |
| 2710 Warbler St | 0.31mi | 2/2.0 | 924 (+6%) | 5mo | $23,000 | $25 | 67 |
| 2820 Oriole St | 0.16mi | 2/2.0 | 924 (+6%) | 13mo | $68,000 | $74 | 67 |
| 2620 Pheasant St | 0.30mi | 2/2.0 | 924 (+6%) | 20mo | $32,000 | $35 | 54 |
| 9400 El Ct | 0.47mi | 2/2.0 | 924 (+6%) | 15mo | $70,000 | $76 | 51 |
| 2100 W 100th 212 Ave | 0.62mi | 2/1.0 | 924 (+6%) | 22mo | $35,000 | $38 | 42 |
Match score weights: distance 35% · size 25% · config 20% · recency 20%. Top-matched comps best support the ARV.
Projected returns pro-forma
-3.0% appreciation · 0.77% rent growth · sell at horizon
- IRR
- -26.7%
- Equity multiple
- 0.15×
- Total profit
- $-15,479
- Equity at exit
- $9,692
- IRR
- -81.0%
- Equity multiple
- -0.54×
- Total profit
- $-28,094
- Equity at exit
- $5,620
Cash invested: $18,200 (down + closing). Projections, not guarantees.
Landlord ↔ Tenant lean methodology
- Overall (STATE)
- 38 Tenant-Leaning
- State Colorado
- 38 Tenant-Leaning · D+4
- County
- — inherits STATE
- City
- — inherits STATE
ZIP-level market 80260
- Rents YoY
- 0.8%
- Active inventory
- 135
- Price-to-rent
- 3.2×
Monthly cashflow live
- Estimated rent
- $1,712 high interval (Pro) →
- Mortgage (P&I)
- −$341
- Tax est. 1.5%
- −$81 /mo · $975/yr
- Insurance
- −$27
- HOA
- −$931
- Vacancy / Maint / Mgmt
- −$359
- Net cashflow
- $-28
Break-even live
Sensitivity live
| Price | -10% $17 | -5% $-6 | +0% $-28 | +5% $-51 | +10% $-73 |
|---|---|---|---|---|---|
| Rent | -10% $-163 | -5% $-96 | +0% $-28 | +5% $40 | +10% $107 |
| Rate | -1.0pp $5 | -0.5pp $-12 | base $-28 | +0.5pp $-45 | +1.0pp $-62 |
UW: 25.0% down · 7.5% · 30yr · 1.5% tax · 5.0% vac · 8.0% maint · 8.0% mgmt
Financing live
Cash to close
- Down payment
- $16,250
- Closing costs
- $1,950
- Reserves months
- —
- Total cash needed
- —
Loan-product check · same deal, 3 products live
Conventional
25% down · 7.5% · 30yr
- Down + closing
- —
- Monthly P&I
- —
- Monthly cashflow
- —
- DSCR
- —
- Eligible?
- —
Personal DTI + credit; lowest rate.
DSCR
20% down · 8.5% · 30yr
- Down + closing
- —
- Monthly P&I
- —
- Monthly cashflow
- —
- DSCR
- —
- Eligible?
- —
No personal income docs; deal must DSCR.
Hard money
10% down · 12.0% · 12mo
- Down + closing
- —
- Monthly P&I
- —
- Monthly cashflow
- —
- DSCR
- —
- Eligible?
- —
Short-term bridge; refi at stabilization.
Rent comps 34 comps
| Address | Beds | Baths | Sqft | Rent | $/sqft | DOM | Units | Dist |
|---|---|---|---|---|---|---|---|---|
| 3323 W 96th Cir Westminster, CO | 1.0–3.0 | 1.0–3.0 | 1190 | $2,510 | $2.11 | 0d | 23 | 0.50mi |
| 2700 W 103rd Ave Denver, CO | 1.0–2.0 | 1.0–2.0 | 729 | $1,919 | $2.63 | 0d | 13 | 0.57mi |
| 10251 Zuni St Denver, CO | 1.0–2.0 | 1.0–2.0 | 800 | $1,724 | $2.15 | 0d | 13 | 0.61mi |
| 10211 Ura Ln Thornton, CO | 1.0–2.0 | 1.0 | 709 | $1,325 | $1.87 | 18d | 3 | 0.72mi |
| 1801 W 92nd Ave #754 Denver, CO | 3.0 | 2.0 | 1123 | $1,995 | $1.78 | 6d | 1 | 0.79mi |
| 9151 Fontaine St Denver, CO | 2.0 | 1.0 | 700 | $1,313 | $1.88 | 4d | 1 | 0.85mi |
| 9081 Federal Blvd Westminster, CO | 2.0 | 1.0 | 855 | $1,376 | $1.61 | 0d | 2 | 0.89mi |
| 9050 N Elm Ct Unit 1 Federal Heights, CO | 2.0 | 1.0 | 912 | $1,745 | $1.91 | 6d | 1 | 0.94mi |
| 8865 Federal Blvd #202 Denver, CO | 2.0 | 1.0 | 1067 | $1,700 | $1.59 | 13d | 1 | 1.16mi |
| 8943 Mccoy Pl Westminster, CO | 2.0 | 1.0 | 850 | $1,550 | $1.82 | 19d | 1 | 1.35mi |
| 8918 Mccoy Pl Unit 8906 Westminster, CO | 2.0 | 1.0 | 800 | $1,350 | $1.69 | 0d | 1 | 1.36mi |
| 8670 Clay St Unit 4211 Westminster, CO | 3.0 | 2.0 | 1110 | $2,186 | $1.97 | 25d | 1 | 1.40mi |
| 8670 Clay St Unit 5201 Westminster, CO | 3.0 | 2.0 | 1110 | $2,550 | $2.30 | 25d | 1 | 1.40mi |
| 8670 Clay St Unit 6301 Westminster, CO | 3.0 | 2.0 | 1110 | $2,325 | $2.09 | 25d | 1 | 1.40mi |
| 8670 Clay St Unit 5309 Westminster, CO | 2.0 | 2.0 | 1111 | $2,206 | $1.99 | 25d | 1 | 1.40mi |
| 8670 Clay St Unit 4312 Westminster, CO | 2.0 | 1.0 | 1038 | $1,891 | $1.82 | 25d | 1 | 1.40mi |
| 8670 Clay St Unit 5107 Westminster, CO | 2.0 | 2.0 | 951 | $1,891 | $1.99 | 25d | 1 | 1.40mi |
| 8670 Clay St Unit 7309 Westminster, CO | 2.0 | 2.0 | 951 | $1,761 | $1.85 | 25d | 1 | 1.40mi |
| 8670 Clay St Unit 7220 Westminster, CO | 2.0 | 1.0 | 1038 | $1,761 | $1.70 | 25d | 1 | 1.40mi |
| 8670 Clay St Unit 4306 Westminster, CO | 1.0 | 1.0 | 808 | $1,576 | $1.95 | 25d | 1 | 1.40mi |
| 950 W 103rd Pl Northglenn, CO | 2.0 | 1.0 | 820 | $1,399 | $1.71 | 26d | 3 | 1.40mi |
| 8670 Clay St Unit 7219 Westminster, CO | 3.0 | 2.0 | 1110 | $2,373 | $2.14 | 25d | 1 | 1.41mi |
| 8670 Clay St Unit 7317 Westminster, CO | 2.0 | 2.0 | 1111 | $2,054 | $1.85 | 25d | 1 | 1.41mi |
| 8670 Clay St Unit 5307 Westminster, CO | 2.0 | 2.0 | 951 | $1,891 | $1.99 | 6d | 1 | 1.41mi |
| 8670 Clay St Unit 7313 Westminster, CO | 1.0 | 1.0 | 808 | $1,839 | $2.28 | 25d | 1 | 1.41mi |
| 4901 W 93rd Ave Westminster, CO | 1.0–2.0 | 1.0–2.0 | 937 | $2,333 | $2.49 | 0d | 22 | 1.41mi |
| 747 W 96th Ave Denver, CO | 3.0 | 1.0 | 864 | $1,395 | $1.61 | 26d | 1 | 1.41mi |
| 747 W 96th Ave Denver, CO | 3.0 | 1.0 | 864 | $1,395 | $1.61 | 6d | 1 | 1.41mi |
| 8654 Decatur St #237 Westminster, CO | 1.0 | 1.0 | 888 | $1,450 | $1.63 | 13d | 1 | 1.42mi |
| 10701 Pecos St Northglenn, CO | 1.0–2.0 | 1.0 | 650 | $1,537 | $2.36 | 0d | 16 | 1.43mi |
| 707 W 96th Ave Thornton, CO | 3.0 | 1.0 | 859 | $1,350 | $1.57 | 26d | 1 | 1.43mi |
| 8635 Clay St #416 Westminster, CO | 2.0 | 1.0 | 1000 | $1,695 | $1.70 | 0d | 1 | 1.45mi |
| 8635 Clay St Westminster, CO | 1.0 | 1.0 | 829 | $1,400 | $1.69 | 16d | 1 | 1.45mi |
| 9189 Gale Blvd Thornton, CO | 1.0–3.0 | 1.0–2.0 | 755 | $1,449 | $1.92 | 26d | 1 | 1.50mi |
HOA detail
- Monthly dues
- $931 · $11,172/yr
Listing history 17 events
-
2026-06-21days on market $65,000 Active 24 DOM
-
2026-06-18days on market $65,000 Active 21 DOM
-
2026-06-17days on market $65,000 Active 20 DOM
-
2026-06-16days on market $65,000 Active 19 DOM
-
2026-06-15days on market $65,000 Active 18 DOM
-
2026-06-13days on market $65,000 Active 16 DOM
-
2026-06-13days on market $65,000 Active 15 DOM
-
2026-06-09days on market $65,000 Active 12 DOM
-
2026-06-08days on market $65,000 Active 11 DOM
-
2026-06-07days on market $65,000 Active 10 DOM
-
2026-06-04days on market $65,000 Active 7 DOM
-
2026-06-03days on market $65,000 Active 6 DOM
-
2026-06-02days on market $65,000 Active 5 DOM
-
2026-06-01days on market $65,000 Active 4 DOM
-
2026-05-31days on market $65,000 Active 3 DOM
-
2026-05-28$65,000 Active
-
2026-05-27historical $65,000
ⓘ Source: listings_history table (triggers on properties + properties_extension) + one-shot
backfill from property_details.listing_events for pre-trigger history.
Climate risk First Street
- Flood 1/10 Low FEMA zone X (unshaded) · 0% chance over 30 yrs
- Wildfire 1/10 Low
- Heat 3/10 Moderate 7 d/yr ≥92°F today · 18 d/yr by 30 yrs out
- Wind 2/10 Low
- Air quality 4/10 Moderate 6 unhealthy d/yr today · 8 by 30 yrs out
Nearby sold comps map
Loading sold comps map…
Walkable amenities ~0.75 mi
Loading nearby amenities…
Taxation est. · year 1
- Rental income
- $20,539
- − Mortgage interest
- −$3,641
- − Property taxes
- −$975
- − Insurance
- −$325
- − Repairs & maintenance
- −$1,643
- − Management
- −$1,643
- − HOA
- −$11,172
- − Depreciation
- −$1,891
- Taxable loss
- −$751
- Est. tax savings @ 24.0%
- +$180
- After-tax cash flow
- $-156/yr
For passive investors: Depreciation is non-cash, so a rental often shows a tax loss while cash-flowing — sheltering income. Rental losses are passive: they offset passive income freely, and up to $25,000/yr can offset ordinary (W-2) income if you actively participate and your MAGI is under $100k (phasing out to $0 by $150k); unused losses carry forward. On sale, claimed depreciation is recaptured at up to 25%, and gains may owe capital-gains tax (a 1031 exchange can defer both). Figures are a year-1 estimate at your 24.0% rate — not tax advice; consult a CPA.
Condition & rehab AI · 9 photos
This well-maintained corner 2-bedroom, 1-bath mobile home offers comfort and modern living in a compact space. It features an attached 1-car oversized garage on one side and an attached covered front porch. All appliances are included. The home is move-in ready with minor cosmetic updates.
Value-add opportunities
- Both paint exterior — enhances curb appeal and value
- Both replace window screens — improves energy efficiency and aesthetics
Renovation cost estimate screening
Value-add ROI direction
- Both paint exterior — enhances curb appeal and value ↑
- Both replace window screens — improves energy efficiency and aesthetics ↑
ⓘ Cost ranges are severity-bucket heuristics (US national rule-of-thumb). Get contractor quotes + a written scope before underwriting a rehab budget.
Schools (NCES district)
- District
- Adams 12 Five Star Schools
- NCES district ID
- 0806900
- Math proficiency
- 31% ▼ -4.00%
- Reading proficiency
- 46% ▬ 0.00%
- Median HH income
- $67,478
- Composite
- 34.87/100
- National rank
- #5086
- State rank
- #26 of 86 in CO
Livability — Federal Heights
- Score
- 76/100
- State rank
- #28
- US rank
- #3380
Category grades
Schools grade is shown separately in the Schools card above.
Census & demographics
- Census place
- Federal Heights, CO
- County
- Adams County · 464,133 people
- City population
- 34,677
- Metro
- Denver-Aurora-Lakewood, CO
- Population (ZIP)
- 34,677
- Household income
- $61,852
- Rent vs Own
- Severe rent burden
- 1521.0
Population outlook (Adams County) Hauer SSP2
- Today (2025)
- 598,184 people
- By 2030
- 651,880 · +9.0%
- By 2040
- 759,778 · +27.0%
- By 2050
- 862,889 · +44.3%
- By 2075
- 1,085,994 · +81.5%
- By 2100
- 1,211,318 · +102.5%
Race, ethnicity, and origin ACS 2023
- Neighborhood character
- Majority Hispanic (61%)
- Race & ethnicity
- Hispanic / Latino 61% White 30% Two or more races 26% Asian 3% Black 3%
- Hispanic origin (detail)
- Mexican 51%
- Common ancestry
- Romanian 1% Slovak 1% Italian 1%
- Foreign-born
- 25% · Canada, Vietnam, China
- Languages at home
- 53% English-only · Spanish 42% Other Asian/Pacific 2% Other Indo-European 1%
Political lean MEDSL · Adams
- 2024 margin
- Lean D (+9.0) · D 53.2% · R 44.1% · Other 2.7%
- 2008→2024 swing
- -9.3pp toward R · 2008: 18.4pp · 2024: 9.0pp
- All cycles
- 2024: D+9.0 2020: D+16.3 2016: D+7.2 2012: D+15.1 2008: D+18.4
Not yet ingested
- Civics
- —
Market trends
- HPI YoY
- ▼ -260.84%
- Current HPI
- 285.4552
- Rent YoY
- ▲ 0.77%
- Metro
- Denver-Aurora-Lakewood, CO
- State GDP YoY
- ▲ 1.95%
- F500 in state
- 14
Industry mix (Fortune 500 HQ in CO)
| Industry | F500 HQs | Revenue |
|---|---|---|
| Technology Distribution | 1 | $31B |
|
||
| Food / Agriculture | 1 | $18B |
|
||
| Packaging | 1 | $14B |
|
||
| Healthcare | 1 | $13B |
|
||
| Energy | 1 | $10B |
|
||
| Technology | 1 | $4B |
|
||
Price history
+0.0% since first listed2 events — show timeline
- 2026-05-28 Listed $65,000 REColorado as Distributed by MLS Grid
- 2026-05-27 Coming Soon $65,000 REColorado as Distributed by MLS Grid
Cash-flow waterfall
monthlySold comps — $/sqft
last 12 mo · ≤1 miLoading sold comps…