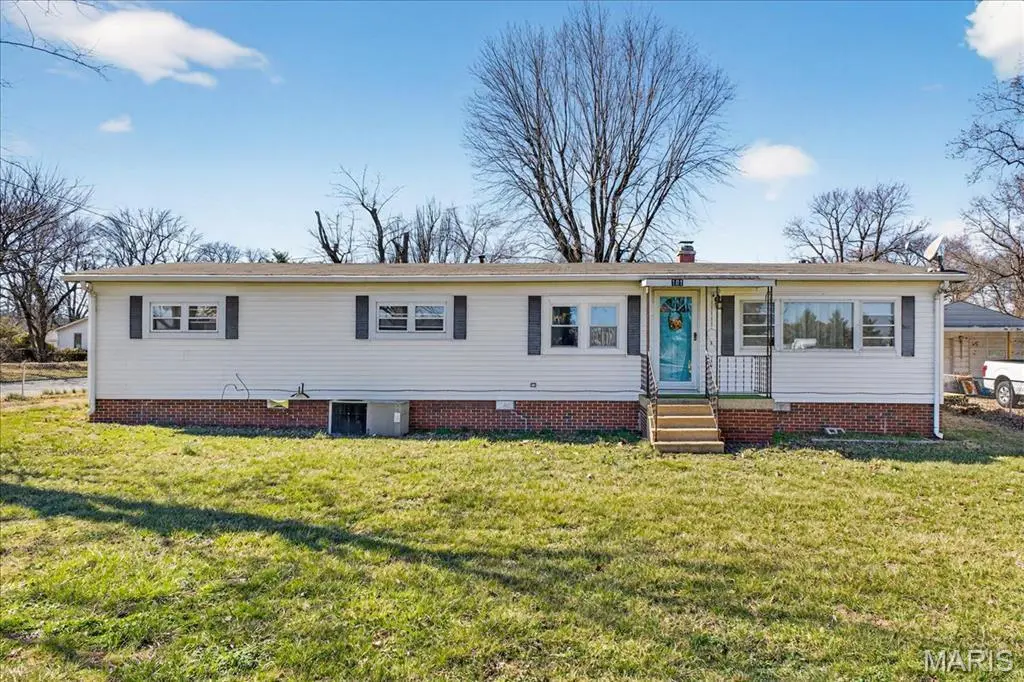
101 N Ruby Ln · Fairview Heights, IL
Flood risk 1/10 · Minimal
- FEMA flood zone
- X
- Chance of flooding over 30 yrs
- 0.0%
- Est. flood insurance / yr
- $507 – $1,088
Fire risk 1/10 · Minimal
- Est. fire insurance / yr
- $804 – $1,492
Heat risk 5/10 · Moderate
- Hot days now (above 108°F)
- 7 days/yr
- Hot days in 30 yrs
- 21 days/yr
Wind risk 2/10 · Minimal
- Chance of severe wind over 30 yrs
- 1.0%
Air-quality risk 3/10 · Minor
- Unhealthy air days now
- 2 days/yr
- Unhealthy air days in 30 yrs
- 4 days/yr
Risk factors via First Street. Map © Google.
Why this score? — see what drove the B- grade
The composite is a weighted blend of 9 inputs, each scored 0–100. Each bar is that input's sub-score; the figure is the points it added to the 100-point composite (weight × sub-score).
- Cash flow +30.0/30.0
- 1% rule +10.0/10.0
- DSCR +10.0/10.0
- ARV discount +7.5/15.0
- Livability +3.8/5.0
- Rent growth +2.5/5.0
- Condition / age +2.5/5.0
- Schools +2.2/10.0
- Appreciation +0.0/10.0
$74,900
🖨 Deal sheet 📄 Offer letter ✓ Due diligence
Listing remarks
Double the lot. Double the opportunity. This rare property features a large, level, fully fenced corner lot PLUS an additional fenced parcel, offering unmatched space, privacy, and flexibility. Whether you’re dreaming of RV parking, a hobby farm, outdoor entertaining, recreation, or future expansion, the possibilities here are endless. Inside, you’ll find 3 spacious bedrooms, 2 full bathrooms, and generous storage throughout with built-ins and large closets. The eat-in kitchen and separate dining room make hosting easy, while the oversized living room with vinyl plank flooring and fireplace creates the perfect space to gather or unwind. An attic fan adds comfort and efficiency.
Key facts
- 0.36 acre lot
- 2 garage spots
- Built 1976
Property features AI
Finance
- Financial info: Lease not considered; Seller may consider concessions
Exterior
- Parking: Detached or attached 2-car garage
- Utilities: Public water; Public sewer; Electric service (Ameren); Electricity, natural gas, sewer and water connected
- Home design: Manufactured home; Single-story (one level)
- Construction: Vinyl siding; Architectural shingle roof
- Exterior features: Full fenced yard; Adjoins common ground
Interior
- Kitchen: Microwave; Range; Refrigerator
- Bedrooms: Three bedrooms, all on the main level
- Bathrooms: Two full bathrooms, both on the main level
- Heating & cooling: Forced air heating (natural gas); Central electric air conditioning
- Interior features: Fireplace in the family room; Crawl space basement
Neighborhood map
What this means for you Summary
Snapshot
- This is a 3-bed/2.0-bath single-family listed at $75k.
Deal economics
- At list price, monthly cash flow is $648 ($8k/yr) — positive.
- The deal already cash-flows at list — no discount required.
- Meets the 1% rule at list price ($2k rent vs $75k).
- Cap rate 16.7% vs local median 4.1% in Fairview Heights — top-decile yield for the area; either an underpriced asset or a hidden risk that comps aren't pricing in. Stress-test before assuming the spread holds.
Location & tenants
- Location reads 75/100 on livability (#225 in IL, #4,180 nationally) — a middle-class / working-renter tenant base. Strengths: commute A+, cost of living A+, housing A+; Watch: crime F, amenities F, health & safety F.
- Belleville Twp Hsd 201 (suburban): math 21% / reading 28% proficiency, ranked #308 of 620 in IL (top 50%) — low school quality limits family demand, transient renter base, plan for 1-2y turnover.
- Zoned schools: Belleville High School-East (math 23% / reading 30%, grade F, #241 of 693 statewide, top 35%, 2,568 students, 0% FRL).
- Market conditions: 81 active listings in the ZIP; 5 comparable units currently listed for rent nearby; rentals at typical pace (median 24d on market — plan ~3-4 weeks tenant-placement turnaround); solid renter incomes; 783 units permitted in St. Clair County in 2024 (378 in 5+ unit buildings).
Forward outlook
- Local home prices are declining (-3.0%/yr); year-one equity from $518 of loan paydown is wiped out by about $2k of value loss. Plan a longer hold.
- St. Clair County population projected at -23% by 2050 — secular population decline; favor cash flow + early exit over multi-decade hold.
- At projected returns (-3.0% appreciation + 3.0% rent growth), your $21k cash investment doubles in ~4 years — after that, you're playing with house money.
Negotiation context
- Only 9 days on market — expect competitive offers; lowballing is unlikely to land.
- 8 sale attempts since 2y ago; this cycle's ask has dropped $50k (40%) from the opening price — seller is motivated, your offer sets the floor, not the list.
- Current owner paid $53k; 41% above their basis — modest negotiation headroom, anchor on the comps not their cost.
Risks & watch-outs
- Watch-outs: property tax is 4.3% of price.
- Climate carrying-cost: extreme-heat days projected 7→21/yr by 2055 (HVAC capex compounding) — expect insurance premiums to compound above CPI over the hold.
Questions for the listing agent
- Built in 1976 — when were the roof, HVAC, electrical panel, plumbing, and water heater last replaced?
- Property tax is high relative to price — has the assessment been appealed recently, and will the sale trigger a re-assessment?
- Is there a deadline driving the sale (1031 exchange, divorce, estate, relocation)? That informs how much negotiation room exists.
- Schools are D-rated, which usually means shorter tenancies and higher turnover. Who's the typical renter profile here, and what's been the actual vacancy rate?
- Crime grade is F in this area — have there been break-ins, vandalism, or insurance claims at this property in the last 3 years? What carrier currently insures it and at what premium?
- What's the average days-on-market for RENTAL listings here right now (not sales)? A rising rental-DOM trend means longer vacancies and softer asking-rent achievability than the comps imply.
- What's the recent tenant-quality profile in this submarket — average credit score on applications, eviction rate, late-payment / NSF rate, and stable-employment percentage? A property-management company in the area should have these aggregated.
- How much new for-sale + rental construction is in the pipeline within 1–3 miles? Heavy new supply typically softens prices + rents 12–24 months out; constrained supply supports both.
Investment metrics
- 1% rule
- 2.26% ✓
- Cap rate
- 16.68%
- Cash-on-cash
- 37.10%
- DSCR
- 2.65
- GRM
- 3.7
CMA / ARV
- ARV (on-the-fly)
- $167,088
- Comps found
- 12
Show comp detail 12 sales within ~0.75 mi
| Address | Dist | Beds/Ba | Sqft | Sold | Price | $/sf | Match |
|---|---|---|---|---|---|---|---|
| 26 Mark Dr | 0.44mi | 3/2.0 | 1,422 (+0%) | 6mo | $164,900 | $116 | 74 |
| 74 Pasadena Dr | 0.26mi | 2/2.0 (-1) | 1,521 (+7%) | 8mo | $165,000 | $108 | 64 |
| 117 Primrose Ln | 0.70mi | 3/2.0 | 1,393 (-2%) | 3mo | $175,000 | $126 | 62 |
| 113 Mark Dr | 0.51mi | 3/2.0 | 1,540 (+9%) | 1mo | $185,000 | $120 | 61 |
| 305 Roselawn Ave | 0.46mi | 3/2.0 | 1,580 (+12%) | 9mo | $186,000 | $118 | 52 |
| 233 Candlelight Dr | 0.70mi | 3/2.5 | 1,503 (+6%) | 5mo | $225,000 | $150 | 51 |
| 10 Leo Dr | 0.54mi | 3/2.0 | 1,620 (+14%) | 3mo | $115,000 | $71 | 48 |
| 20 Potomac Dr | 0.63mi | 3/1.5 | 1,527 (+8%) | 10mo | $149,900 | $98 | 47 |
| 24 Mark Dr | 0.44mi | 3/2.0 | 1,600 (+13%) | 13mo | $145,000 | $91 | 47 |
| 29 Potomac Dr | 0.66mi | 2/2.0 (-1) | 1,312 (-7%) | 10mo | $150,000 | $114 | 44 |
| 212 Mcknight Rd | 0.65mi | 3/2.0 | 1,203 (-15%) | 6mo | $170,000 | $141 | 40 |
| 56 Concord Dr | 0.69mi | 3/2.0 | 1,217 (-14%) | 14mo | $176,000 | $145 | 33 |
Match score weights: distance 35% · size 25% · config 20% · recency 20%. Top-matched comps best support the ARV.
Projected returns pro-forma
-3.0% appreciation · 3.0% rent growth · sell at horizon
- IRR
- 33.1%
- Equity multiple
- 2.40×
- Total profit
- $29,292
- Equity at exit
- $11,168
- IRR
- 40.1%
- Equity multiple
- 4.78×
- Total profit
- $79,219
- Equity at exit
- $6,476
Cash invested: $20,972 (down + closing). Projections, not guarantees.
Landlord ↔ Tenant lean methodology
- Overall (STATE)
- 43 Moderately Tenant-Leaning
- State Illinois
- 43 Moderately Tenant-Leaning · D+7
- County
- — inherits STATE
- City
- — inherits STATE
ZIP-level market 62208
- Home prices YoY
- -34.2%
- Active inventory
- 81
- Price-to-rent
- 3.7×
Monthly cashflow live
- Estimated rent
- $1,694 medium interval (Pro) →
- Mortgage (P&I)
- −$393
- Tax from tax record
- −$266 /mo · $3,190/yr
- Insurance
- −$31
- HOA
- −$0
- Vacancy / Maint / Mgmt
- −$356
- Net cashflow
- $648
Break-even live
UW: 25.0% down · 7.5% · 30yr · 1.5% tax · 5.0% vac · 8.0% maint · 8.0% mgmt
Financing live
Cash to close
- Down payment
- $18,725
- Closing costs
- $2,247
- Reserves months
- —
- Total cash needed
- —
Loan-product check · same deal, 3 products live
Conventional
25% down · 7.5% · 30yr
- Down + closing
- —
- Monthly P&I
- —
- Monthly cashflow
- —
- DSCR
- —
- Eligible?
- —
Personal DTI + credit; lowest rate.
DSCR
20% down · 8.5% · 30yr
- Down + closing
- —
- Monthly P&I
- —
- Monthly cashflow
- —
- DSCR
- —
- Eligible?
- —
No personal income docs; deal must DSCR.
Hard money
10% down · 12.0% · 12mo
- Down + closing
- —
- Monthly P&I
- —
- Monthly cashflow
- —
- DSCR
- —
- Eligible?
- —
Short-term bridge; refi at stabilization.
Rent comps 5 comps
| Address | Beds | Baths | Sqft | Rent | $/sqft | DOM | Units | Dist |
|---|---|---|---|---|---|---|---|---|
| 21 Northbrook Cir Fairview Heights, IL | 1.0–2.0 | 1.0–2.0 | 892 | $1,680 | $1.88 | 1d | 6 | 0.49mi |
| 13 Edding Ln Fairview Heights, IL | 3.0 | 1.5 | 1430 | $850 | $0.59 | 12d | 1 | 0.52mi |
| 6 Ram Ct Fairview Heights, IL | 2.0 | 1.5 | 1100 | $1,775 | $1.61 | 23d | 1 | 0.52mi |
| 115 Longacre Dr Unit 1 Fairview Heights, IL | 2.0 | 1.5 | 1168 | $1,450 | $1.24 | 23d | 1 | 0.54mi |
| 10021 Saint Clair Ave Fairview Heights, IL | 2.0 | 1.0 | 924 | $1,700 | $1.84 | 23d | 1 | 1.09mi |
Listing history 20 events
-
2026-05-19status Active
-
2026-05-19price $74,900
-
2026-04-26status Pending
-
2026-04-23$124,900 Active
-
2026-04-23historical $124,900
-
2026-03-19price $149,000
-
2026-03-07$159,000 Active
-
2026-03-03historical
-
2025-11-22$159,000 Active
-
2025-11-20historical
-
2025-03-20soldstatus $53,000
-
2025-03-19soldstatus Closed
-
2025-01-31status Pending
-
2025-01-29$55,000 Active
-
2025-01-22historical
-
2024-12-30status Active
-
2024-11-14status Pending
-
2024-11-06status Active
-
2024-10-28status Pending
-
2024-10-15$55,000 Active
ⓘ Source: listings_history table (triggers on properties + properties_extension) + one-shot
backfill from property_details.listing_events for pre-trigger history.
Tax reassessment forecast IL · Partial reset (capped growth)
- Current annual tax
- $3,190 · $266/mo
- Projected year-2 tax
- $3,190 · $266/mo
- Expected delta
- $0/yr ($0/mo · 0.0%)
ⓘ Screening estimate from a state-policy table — verify with the county assessor before closing.
Climate risk First Street
- Flood 1/10 Low FEMA zone X · 0% chance over 30 yrs
- Wildfire 1/10 Low
- Heat 5/10 Major 7 d/yr ≥108°F today · 21 d/yr by 30 yrs out
- Wind 2/10 Low 100% chance of damaging wind over 30 yrs
- Air quality 3/10 Moderate 2 unhealthy d/yr today · 4 by 30 yrs out
Nearby sold comps map
Loading sold comps map…
Walkable amenities ~0.75 mi
Loading nearby amenities…
Taxation est. · year 1
- Rental income
- $20,328
- − Mortgage interest
- −$4,196
- − Property taxes
- −$3,190
- − Insurance
- −$374
- − Repairs & maintenance
- −$1,626
- − Management
- −$1,626
- − Depreciation
- −$2,179
- Taxable income
- $7,136
- Est. tax owed @ 24.0%
- −$1,713
- After-tax cash flow
- $6,068/yr
For passive investors: Depreciation is non-cash, so a rental often shows a tax loss while cash-flowing — sheltering income. Rental losses are passive: they offset passive income freely, and up to $25,000/yr can offset ordinary (W-2) income if you actively participate and your MAGI is under $100k (phasing out to $0 by $150k); unused losses carry forward. On sale, claimed depreciation is recaptured at up to 25%, and gains may owe capital-gains tax (a 1031 exchange can defer both). Figures are a year-1 estimate at your 24.0% rate — not tax advice; consult a CPA.
Schools (NCES district)
- District
- Belleville Twp Hsd 201
- NCES district ID
- 1705640
- Math proficiency
- 21% ▼ -8.00%
- Reading proficiency
- 28% ▼ -3.00%
- Median HH income
- $58,064
- Composite
- 22.39/100
- National rank
- #8115
- State rank
- #308 of 620 in IL
Livability — Fairview Heights
- Score
- 75/100
- State rank
- #225
- US rank
- #4180
Category grades
Schools grade is shown separately in the Schools card above.
Census & demographics
- Census place
- Fairview Heights, IL
- County
- Saint Clair County · 169,691 people
- City population
- 16,821
- Metro
- St. Louis, MO-IL
- Population (ZIP)
- 16,821
- Household income
- $80,205
- Rent vs Own
- Severe rent burden
- 555.0
Population outlook (St. Clair County) Hauer SSP2
- Today (2025)
- 250,366 people
- By 2030
- 240,511 · -3.9%
- By 2040
- 217,391 · -13.2%
- By 2050
- 192,699 · -23.0%
- By 2075
- 140,637 · -43.8%
- By 2100
- 100,499 · -59.9%
Race, ethnicity, and origin ACS 2023
- Neighborhood character
- Diverse neighborhood (Simpson 0.64)
- Race & ethnicity
- White 50% Black 33% Two or more races 11% Asian 3% Hispanic / Latino 3%
- Common ancestry
- Lithuanian 2% Romanian 2% Slovak 2%
- Foreign-born
- 4% · Canada, South Korea, Jamaica
- Languages at home
- 96% English-only · Spanish 2% Arabic 1%
Political lean MEDSL · St. Clair
- 2024 margin
- Lean D (+7.9) · D 53.0% · R 45.1% · Other 1.8%
- 2008→2024 swing
- -14.6pp toward R · 2008: 22.4pp · 2024: 7.9pp
- All cycles
- 2024: D+7.9 2020: D+8.7 2016: D+5.6 2012: D+14.5 2008: D+22.4
Not yet ingested
- Civics
- —
Market trends
- HPI YoY
- ▼ -71.14%
- Current HPI
- 136.8631
- Rent YoY
- —
- Metro
- St. Louis, MO-IL
- State GDP YoY
- ▲ 1.59%
- F500 in state
- 60
Industry mix (Fortune 500 HQ in IL)
| Industry | F500 HQs | Revenue |
|---|---|---|
| Insurance | 4 | $201B |
|
||
| Consumer Goods | 4 | $87B |
|
||
| Industrial Machinery | 3 | $64B |
|
||
| Healthcare | 2 | $55B |
|
||
| Retail / Pharmacy | 1 | $148B |
|
||
| Agriculture / Food | 1 | $86B |
|
||
Price history
+36.2% since first listed20 events — show timeline
- 2026-05-19 Relisted — MARIS as Distributed by MLS Grid
- 2026-05-19 Price Changed $74,900 MARIS as Distributed by MLS Grid
- 2026-04-26 Pending — MARIS as Distributed by MLS Grid
- 2026-04-23 Listed $124,900 MARIS as Distributed by MLS Grid
- 2026-04-23 Coming Soon $124,900 MARIS as Distributed by MLS Grid
- 2026-03-19 Price Changed $149,000 MARIS as Distributed by MLS Grid
- 2026-03-07 Listed $159,000 MARIS as Distributed by MLS Grid
- 2026-03-03 Coming Soon — MARIS as Distributed by MLS Grid
- 2025-11-22 Listed $159,000 MARIS as Distributed by MLS Grid
- 2025-11-20 Coming Soon — MARIS as Distributed by MLS Grid
- 2025-03-20 Sold (Public Records) $53,000 Public Records
- 2025-03-19 Sold (MLS) — MARIS as Distributed by MLS Grid
- 2025-01-31 Pending — MARIS as Distributed by MLS Grid
- 2025-01-29 Listed $55,000 MARIS as Distributed by MLS Grid
- 2025-01-22 Delisted — MARIS as Distributed by MLS Grid
- 2024-12-30 Relisted — MARIS as Distributed by MLS Grid
- 2024-11-14 Pending — MARIS as Distributed by MLS Grid
- 2024-11-06 Relisted — MARIS as Distributed by MLS Grid
- 2024-10-28 Pending — MARIS as Distributed by MLS Grid
- 2024-10-15 Listed $55,000 MARIS as Distributed by MLS Grid
Property tax history
+16.1%/yrLatest (2024): $3,190 · +378.1% YoY. Source: county tax records.
Cash-flow waterfall
monthlySold comps — $/sqft
last 12 mo · ≤1 miLoading sold comps…