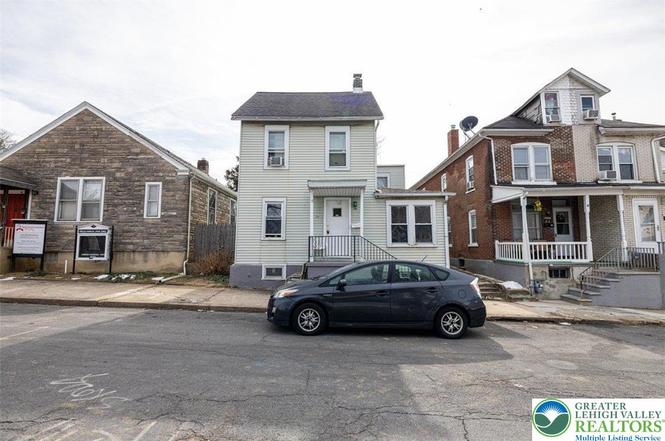
334 E Walnut St E · Allentown, PA
Flood risk 1/10 · Minimal
- FEMA flood zone
- X (unshaded)
- Chance of flooding over 30 yrs
- 0.0%
- Est. flood insurance / yr
- $473 – $860
Fire risk 3/10 · Minor
- Est. fire insurance / yr
- $511 – $949
Heat risk 5/10 · Moderate
- Hot days now (above 100°F)
- 7 days/yr
- Hot days in 30 yrs
- 15 days/yr
Wind risk 4/10 · Minor
- Chance of severe wind over 30 yrs
- 15.0%
Air-quality risk 4/10 · Minor
- Unhealthy air days now
- 3 days/yr
- Unhealthy air days in 30 yrs
- 6 days/yr
Risk factors via First Street. Map © Google.
Why this score? — see what drove the D grade
The composite is a weighted blend of 9 inputs, each scored 0–100. Each bar is that input's sub-score; the figure is the points it added to the 100-point composite (weight × sub-score).
- Cash flow +14.7/30.0
- ARV discount +9.0/15.0
- DSCR +4.5/10.0
- Rent growth +4.1/5.0
- 1% rule +4.0/10.0
- Livability +4.0/5.0
- Condition / age +2.5/5.0
- Schools +1.2/10.0
- Appreciation +0.0/10.0
$234,900
🖨 Deal sheet 📄 Offer letter ✓ Due diligence
Listing remarks MLS
4 BR, 2 full bath home being sold AS IS. Buyer is responsible for full 2% transfer tax.
Key facts
- 7,000 sq ft lot
- 2 garage spots
- Built 1900
Property features AI
Exterior
- Parking: Detached garage; On-street parking; 2-car garage
- Utilities: Public water; Public sewer
- Home design: 3 stories
- Construction: Aluminum siding; Asphalt/fiberglass roof; Full dirt-floor basement
- Exterior features: Estimated 0.161-acre lot; Zoned R-Mh (Medium High Density)
Interior
- Kitchen: Electric oven; Refrigerator
- Bedrooms: Bedroom on third level (8 x 12); Bedroom on second level (9 x 9); Bedroom on second level (10 x 12); Bedroom on second level (12 x 13)
- Flooring: Hardwood; Laminate; Resilient
- Bathrooms: Full bathroom on second level (6 x 8); Full bathroom on first level (5 x 7); Total of 2 full bathrooms
- Heating & cooling: Gas heating; Ceiling fan(s); Wall/window unit(s)
- Interior features: Eat-in kitchen
- Laundry & utility: Gas water heater
Neighborhood map
What this means for you Summary
Snapshot
- This is a 4-bed/2.0-bath single-family listed at $235k.
Deal economics
- At list price, monthly cash flow is $61 ($734/yr) — positive.
- The deal already cash-flows at list — no discount required.
- To meet the 1% rule (rent ≥ 1% of price), the offer needs to be $212k (9.8% below list).
- Recommended offer: $212k (9.8% below list) — sets the bar for 1% rule.
- Cap rate 6.6% vs local median 5.3% in Allentown — meaningfully above typical; check what's discounted (condition, days-on-market, listing class) to confirm the premium yield is real.
Location & tenants
- Location reads 81/100 on livability (#171 in PA, #1,440 nationally) — a professional / high-income tenant draw. Strengths: commute A+, cost of living A+, housing A+; Watch: schools D+, employment D.
- Allentown City SD (urban): math 10% / reading 20% proficiency, ranked #513 of 539 in PA (top 95%) — low school quality limits family demand, transient renter base, plan for 1-2y turnover; 73% free/reduced lunch — lower-income household profile, screen leases tightly.
- Market conditions: Rents rising fast (+6.6%/yr); 58 active listings in the ZIP; 26 comparable units currently listed for rent nearby; rentals at typical pace (median 24d on market — plan ~3-4 weeks tenant-placement turnaround); 765 units permitted in Lehigh County in 2024 (286 in 5+ unit buildings).
- This rent runs 44% of the median local income ($58k/yr) — at the standard rent-burdened threshold; future hikes will face affordability resistance.
Forward outlook
- Local home prices are declining (-3.0%/yr); year-one equity from $2k of loan paydown is wiped out by about $7k of value loss. Plan a longer hold.
- Lehigh County population projected at +21% by 2050 — long-run rental-demand tailwind backs the buy-and-hold thesis.
Negotiation context
- It's been on market 30 days — a 2% lower offer ($231k) is reasonable based on typical stale-listing flexibility.
- 7 sale attempts since 21y ago with the ask held roughly flat each time — persistent listings suggest the price (not the market) is what's stuck; bring a comps-based counter.
- Current owner paid $86k; list at $235k implies a 172% gain — meaningful room to come down on a strong offer.
Risks & watch-outs
- Watch-outs: built in 1900 — expect roof / HVAC / electrical / plumbing capex.
- Climate carrying-cost: extreme-heat days projected 7→15/yr by 2055 (HVAC capex compounding) — expect insurance premiums to compound above CPI over the hold.
Questions for the listing agent
- Built in 1900 — when were the roof, HVAC, electrical panel, plumbing, and water heater last replaced?
- Is there a deadline driving the sale (1031 exchange, divorce, estate, relocation)? That informs how much negotiation room exists.
- Schools are D-rated, which usually means shorter tenancies and higher turnover. Who's the typical renter profile here, and what's been the actual vacancy rate?
- The area grade is low — what's the realistic commute time and amenity access for the typical tenant pool here? Any planned neighborhood developments (good or bad) we should know about?
- What's the average days-on-market for RENTAL listings here right now (not sales)? A rising rental-DOM trend means longer vacancies and softer asking-rent achievability than the comps imply.
- What's the recent tenant-quality profile in this submarket — average credit score on applications, eviction rate, late-payment / NSF rate, and stable-employment percentage? A property-management company in the area should have these aggregated.
- How much new for-sale + rental construction is in the pipeline within 1–3 miles? Heavy new supply typically softens prices + rents 12–24 months out; constrained supply supports both.
Investment metrics
- 1% rule
- 0.90% ✗
- Cap rate
- 6.61%
- Cash-on-cash
- 1.12%
- DSCR
- 1.05
- GRM
- 9.2
CMA / ARV
- ARV (on-the-fly)
- $243,150
- Comps found
- 6
Show comp detail 6 sales within ~0.75 mi
| Address | Dist | Beds/Ba | Sqft | Sold | Price | $/sf | Match |
|---|---|---|---|---|---|---|---|
| 334 E Walnut St E | 0.00mi | 4/2.0 | 1,621 (0%) | 1mo | $232,500 | $143 | 99 |
| 423 E Walnut St | 0.07mi | 3/1.0 (-1) | 1,392 (-14%) | 9mo | $190,000 | $136 | 57 |
| 40 N Wood St | 0.70mi | 4/1.0 | 1,536 (-5%) | 3mo | $230,000 | $150 | 52 |
| 314 E Union St | 0.08mi | 3/1.5 (-1) | 1,848 (+14%) | 22mo | $265,000 | $143 | 48 |
| 952 E Union St | 0.51mi | 3/2.0 (-1) | 1,757 (+8%) | 12mo | $345,000 | $196 | 47 |
| 825 E Chew St | 0.52mi | 3/2.0 (-1) | 1,416 (-13%) | 24mo | $353,000 | $249 | 30 |
Match score weights: distance 35% · size 25% · config 20% · recency 20%. Top-matched comps best support the ARV.
Projected returns pro-forma
-3.0% appreciation · 6.57% rent growth · sell at horizon
- IRR
- -10.6%
- Equity multiple
- 0.60×
- Total profit
- $-26,263
- Equity at exit
- $35,024
- IRR
- 3.1%
- Equity multiple
- 1.26×
- Total profit
- $17,053
- Equity at exit
- $20,310
Cash invested: $65,772 (down + closing). Projections, not guarantees.
Landlord ↔ Tenant lean methodology
- Overall (STATE)
- 62 Landlord-Friendly
- State Pennsylvania
- 62 Landlord-Friendly · EVEN
- County
- — inherits STATE
- City
- — inherits STATE
ZIP-level market 18109
- Home prices YoY
- -21.9%
- Rents YoY
- 6.6%
- Active inventory
- 58
- Price-to-rent
- 9.2×
Monthly cashflow live
- Estimated rent
- $2,118 high interval (Pro) →
- Mortgage (P&I)
- −$1,232
- Tax from tax record
- −$282 /mo · $3,389/yr
- Insurance
- −$98
- HOA
- −$0
- Vacancy / Maint / Mgmt
- −$445
- Net cashflow
- $61
Break-even live
UW: 25.0% down · 7.5% · 30yr · 1.5% tax · 5.0% vac · 8.0% maint · 8.0% mgmt
Financing live
Cash to close
- Down payment
- $58,725
- Closing costs
- $7,047
- Reserves months
- —
- Total cash needed
- —
Loan-product check · same deal, 3 products live
Conventional
25% down · 7.5% · 30yr
- Down + closing
- —
- Monthly P&I
- —
- Monthly cashflow
- —
- DSCR
- —
- Eligible?
- —
Personal DTI + credit; lowest rate.
DSCR
20% down · 8.5% · 30yr
- Down + closing
- —
- Monthly P&I
- —
- Monthly cashflow
- —
- DSCR
- —
- Eligible?
- —
No personal income docs; deal must DSCR.
Hard money
10% down · 12.0% · 12mo
- Down + closing
- —
- Monthly P&I
- —
- Monthly cashflow
- —
- DSCR
- —
- Eligible?
- —
Short-term bridge; refi at stabilization.
Rent comps 26 comps
| Address | Beds | Baths | Sqft | Rent | $/sqft | DOM | Units | Dist |
|---|---|---|---|---|---|---|---|---|
| 230 E Fairview St Allentown, PA | 3.0 | 2.0 | 1414 | $2,300 | $1.63 | 23d | 1 | 0.20mi |
| 450 Hanover Ave Allentown, PA | 5.0 | 1.0 | 1692 | $2,200 | $1.30 | 23d | 1 | 0.34mi |
| 452 Hanover Ave Allentown, PA | 3.0 | 1.0 | 1917 | $2,350 | $1.23 | 19d | 1 | 0.34mi |
| 111 Ridge Ave Allentown, PA | 4.0 | 1.0 | 1658 | $1,650 | $1.00 | 43d | 1 | 0.66mi |
| 132 Chew St Allentown, PA | 3.0 | 1.0 | 1160 | $1,995 | $1.72 | 14d | 1 | 0.71mi |
| 208 Ridge Ave Allentown, PA | 4.0 | 1.0 | 1396 | $1,700 | $1.22 | 23d | 1 | 0.72mi |
| 208 Ridge Ave Allentown, PA | 4.0 | 1.0 | 1396 | $1,600 | $1.15 | 2d | 1 | 0.72mi |
| 743 N Halstead St Allentown, PA | 3.0 | 1.0 | 1356 | $1,800 | $1.33 | 2d | 1 | 0.87mi |
| 213 Chew St Allentown, PA | 5.0 | 1.0 | 1725 | $2,100 | $1.22 | 43d | 1 | 0.87mi |
| 630 N Front St Allentown, PA | 4.0 | 1.0 | 1912 | $1,900 | $0.99 | 23d | 1 | 0.92mi |
| 164 W Tilghman St Allentown, PA | 5.0 | 2.0 | 1801 | $2,250 | $1.25 | 23d | 1 | 1.02mi |
| 389 W Turner St Allentown, PA | 4.0 | 1.5 | 2144 | $2,400 | $1.12 | 2d | 1 | 1.04mi |
| 314 Barber St Lot 35 Allentown, PA | 3.0 | 2.5 | 1525 | $2,450 | $1.61 | 19d | 1 | 1.05mi |
| 177 W Tilghman St Allentown, PA | 3.0 | 1.5 | 1800 | $1,650 | $0.92 | 2d | 1 | 1.06mi |
| 605 E Susquehanna St Allentown, PA | 3.0 | 1.0 | 1092 | $2,500 | $2.29 | 14d | 1 | 1.16mi |
| 407 N 4th St Allentown, PA | 3.0 | 1.5 | 1321 | $1,550 | $1.17 | 23d | 1 | 1.17mi |
| 517 Elliger St Allentown, PA | 3.0 | 1.5 | 1235 | $1,700 | $1.38 | 23d | 1 | 1.20mi |
| 395 W Allen St Allentown, PA | 3.0 | 1.0 | 1344 | $1,800 | $1.34 | 23d | 1 | 1.26mi |
| 1111 Fullerton Ave Allentown, PA | 5.0 | 1.5 | 1670 | $2,200 | $1.32 | 43d | 1 | 1.35mi |
| 432 N Law St Allentown, PA | 4.0 | 1.0 | 1328 | $1,500 | $1.13 | 14d | 1 | 1.37mi |
| 626 Oak St Allentown, PA | 3.0 | 1.0 | 1396 | $1,900 | $1.36 | 43d | 1 | 1.39mi |
| 622 W Chew St Unit 2 Allentown, PA | 3.0 | 1.0 | 1161 | $1,600 | $1.38 | 19d | 1 | 1.40mi |
| 528 N 6th St Allentown, PA | 3.0 | 1.0 | 1934 | $1,800 | $0.93 | 43d | 1 | 1.46mi |
| 347 N 7th St Apt 3 Allentown, PA | 3.0 | 1.0 | 1200 | $1,500 | $1.25 | 43d | 1 | 1.47mi |
| 644 Lehigh St Allentown, PA | 3.0 | 1.0 | 1714 | $2,250 | $1.31 | 43d | 1 | 1.48mi |
| 535 Tilghman St Unit 2ND Allentown, PA | 4.0 | 2.0 | 1500 | $1,750 | $1.17 | 2d | 1 | 1.50mi |
Listing history 14 events
-
2026-04-30status Pending
-
2026-04-08status Active
-
2026-03-08$234,900 Active
-
2008-10-15soldstatus $86,295 87-char remark
Show marketing remark (87 chars)
4 BR, 2 full bath home being sold AS IS. Buyer is responsible for full 2% transfer tax.
-
2008-04-28$85,000 87-char remark
Show marketing remark (87 chars)
4 BR, 2 full bath home being sold AS IS. Buyer is responsible for full 2% transfer tax.
-
2007-09-29historical
-
2007-07-02$145,900
-
2007-06-06historical
-
2007-03-15historical
-
2007-03-15$169,900
-
2006-09-15$169,900
-
2006-05-22soldstatus $139,900
-
2006-05-15soldstatus $139,900
-
2005-12-19$139,900
ⓘ Source: listings_history table (triggers on properties + properties_extension) + one-shot
backfill from property_details.listing_events for pre-trigger history.
Tax reassessment forecast PA · Partial reset (capped growth)
- Current annual tax
- $3,389 · $282/mo
- Projected year-2 tax
- $3,550 · $296/mo
- Expected delta
- +$161/yr (+$13/mo · 4.8%)
ⓘ Screening estimate from a state-policy table — verify with the county assessor before closing.
Climate risk First Street
- Flood 1/10 Low FEMA zone X (unshaded) · 0% chance over 30 yrs
- Wildfire 3/10 Moderate
- Heat 5/10 Major 7 d/yr ≥100°F today · 15 d/yr by 30 yrs out
- Wind 4/10 Moderate 15% chance of damaging wind over 30 yrs
- Air quality 4/10 Moderate 3 unhealthy d/yr today · 6 by 30 yrs out
Nearby sold comps map
Loading sold comps map…
Walkable amenities ~0.75 mi
Loading nearby amenities…
Taxation est. · year 1
- Rental income
- $25,417
- − Mortgage interest
- −$13,158
- − Property taxes
- −$3,389
- − Insurance
- −$1,174
- − Repairs & maintenance
- −$2,033
- − Management
- −$2,033
- − Depreciation
- −$6,833
- Taxable loss
- −$3,205
- Est. tax savings @ 24.0%
- +$769
- After-tax cash flow
- $1,503/yr
For passive investors: Depreciation is non-cash, so a rental often shows a tax loss while cash-flowing — sheltering income. Rental losses are passive: they offset passive income freely, and up to $25,000/yr can offset ordinary (W-2) income if you actively participate and your MAGI is under $100k (phasing out to $0 by $150k); unused losses carry forward. On sale, claimed depreciation is recaptured at up to 25%, and gains may owe capital-gains tax (a 1031 exchange can defer both). Figures are a year-1 estimate at your 24.0% rate — not tax advice; consult a CPA.
Schools (NCES district)
- District
- Allentown City SD
- NCES district ID
- 4202280
- Math proficiency
- 10% ▼ -10.00%
- Reading proficiency
- 20% ▼ -15.00%
- Median HH income
- $36,337
- Composite
- 12.43/100
- National rank
- #9630
- State rank
- #513 of 539 in PA
Livability — Allentown
- Score
- 81/100
- State rank
- #171
- US rank
- #1440
Category grades
Schools grade is shown separately in the Schools card above.
Census & demographics
- Census place
- Allentown, PA
- County
- Lehigh County · 333,019 people
- City population
- 172,996
- Metro
- Allentown-Bethlehem-Easton, PA-NJ
- Population (ZIP)
- 18,446
- Household income
- $58,031
- Rent vs Own
- Severe rent burden
- 898.0
Population outlook (Lehigh County) Hauer SSP2
- Today (2025)
- 392,957 people
- By 2030
- 408,319 · +3.9%
- By 2040
- 440,007 · +12.0%
- By 2050
- 475,940 · +21.1%
- By 2075
- 590,448 · +50.3%
- By 2100
- 690,314 · +75.7%
Race, ethnicity, and origin ACS 2023
- Neighborhood character
- Diverse neighborhood (Simpson 0.59)
- Race & ethnicity
- Hispanic / Latino 55% White 33% Two or more races 15% Black 8% Asian 2%
- Hispanic origin (detail)
- Mexican 1% Puerto Rican 27% Cuban 1% Dominican 18%
- Common ancestry
- Hispanic 2% Romanian 1% Polish 1%
- Foreign-born
- 22% · Canada, Jamaica
- Languages at home
- 53% English-only · Spanish 37% Arabic 6% French/Haitian/Cajun 2%
Political lean MEDSL · Lehigh
- 2024 margin
- Toss-up / Even · D 50.7% · R 48.0% · Other 1.2%
- 2008→2024 swing
- -12.9pp toward R · 2008: 15.6pp · 2024: 2.7pp
- All cycles
- 2024: D+2.7 2020: D+7.6 2016: D+4.4 2012: D+7.5 2008: D+15.6
Not yet ingested
- Civics
- —
Market trends
- HPI YoY
- ▼ -96.00%
- Current HPI
- 342.9027
- Rent YoY
- ▲ 6.57%
- Metro
- Allentown-Bethlehem-Easton, PA-NJ
- State GDP YoY
- ▲ 1.68%
- F500 in state
- 34
Industry mix (Fortune 500 HQ in PA)
| Industry | F500 HQs | Revenue |
|---|---|---|
| Healthcare | 2 | $309B |
|
||
| Insurance | 2 | $27B |
|
||
| Telecommunications / Media | 1 | $124B |
|
||
| Industrial Distribution | 1 | $22B |
|
||
| Financial Services | 1 | $20B |
|
||
| Chemicals / Materials | 1 | $18B |
|
||
Price history
+67.9% since first listed14 events — show timeline
- 2026-04-30 Pending — GLVRMLS
- 2026-04-08 Relisted — GLVRMLS
- 2026-03-08 Listed $234,900 GLVRMLS
- 2008-10-15 Sold (MLS) $86,295 GLVRMLS
- 2008-04-28 Listed $85,000 GLVRMLS
- 2007-09-29 Listing Removed — GLVRMLS
- 2007-07-02 Listed $145,900 GLVRMLS
- 2007-06-06 Listing Removed — GLVRMLS
- 2007-03-15 Listed $169,900 GLVRMLS
- 2007-03-15 Listing Removed — GLVRMLS
- 2006-09-15 Listed $169,900 GLVRMLS
- 2006-05-22 Sold (Public Records) $139,900 Public Records
- 2006-05-15 Sold (MLS) $139,900 GLVRMLS
- 2005-12-19 Listed $139,900 GLVRMLS
Property tax history
-2.9%/yrLatest (2026): $3,389 · +1.0% YoY. Source: county tax records.
Cash-flow waterfall
monthlySold comps — $/sqft
last 12 mo · ≤1 miLoading sold comps…