3229 Coleman Ave · Rockford, IL
Flood risk 1/10 · Minimal
- FEMA flood zone
- X (unshaded)
- Chance of flooding over 30 yrs
- 0.0%
- Est. flood insurance / yr
- $507 – $1,088
Fire risk 1/10 · Minimal
- Est. fire insurance / yr
- $804 – $1,492
Heat risk 2/10 · Minimal
- Hot days now (above 102°F)
- 7 days/yr
- Hot days in 30 yrs
- 15 days/yr
Wind risk 2/10 · Minimal
- Chance of severe wind over 30 yrs
- —
Air-quality risk 2/10 · Minimal
- Unhealthy air days now
- 1 days/yr
- Unhealthy air days in 30 yrs
- 2 days/yr
Risk factors via First Street. Map © Google.
Why this score? — see what drove the B- grade
The composite is a weighted blend of 9 inputs, each scored 0–100. Each bar is that input's sub-score; the figure is the points it added to the 100-point composite (weight × sub-score).
- Cash flow +30.0/30.0
- 1% rule +10.0/10.0
- DSCR +10.0/10.0
- ARV discount +7.5/15.0
- Livability +3.1/5.0
- Rent growth +2.5/5.0
- Condition / age +2.5/5.0
- Schools +1.2/10.0
- Appreciation +0.0/10.0
$49,900
🖨 Deal sheet (PDF) 📄 Offer letter ✓ Due diligence
Listing remarks MLS
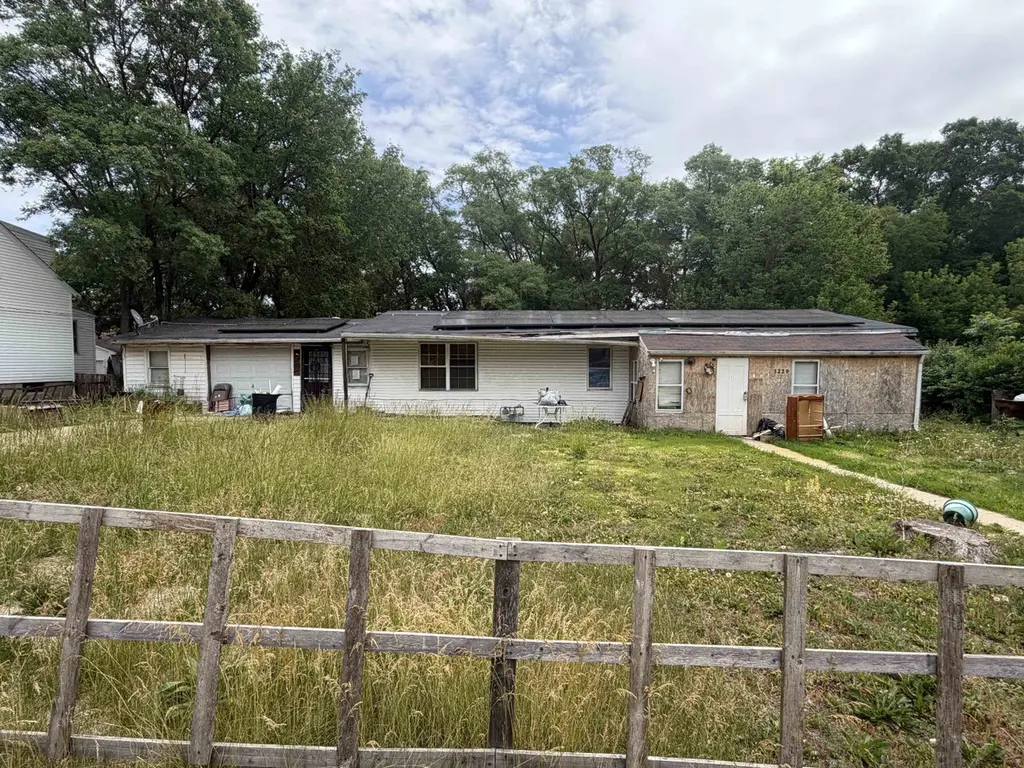
Bring Your Vision to Rockford! If you've been searching for a property with great bones where you can build instant sweat equity, this is it. This 3-bedroom, 1-bath home offers a fantastic footprint and sits on a massive lot with endless possibilities for expansion, gardening, or outdoor entertainment. Complete with a 2-car garage, this home is a blank canvas ready for its next chapter. This property requires some TLC and is being sold strictly as-is (including all current personal property). Leased solar panels will convey with the sale. Perfect for an ambitious homeowner or an investor looking for their next rewarding project! Property is sold as is. Buyer will be responsible for removing anything in the home.
Key facts
- Leased solar panels
- Massive lot
- 0.31 acre lot
Tags
Property features AI
Exterior
- Parking: Attached 2-car garage
- Utilities: Private well water; Public sewer
- Home design: Single-family residential house
- Construction: Residential construction
- Exterior features: Shingle roof
Interior
- Bathrooms: One full bathroom
- Interior features: One full bathroom on the main level
Neighborhood map
What this means for you Summary
Snapshot
- This is a 3-bed/1.0-bath single-family listed at $50k.
Deal economics
- At list price, monthly cash flow is $788 ($9k/yr) — positive.
- The deal already cash-flows at list — no discount required.
- Meets the 1% rule at list price ($1k rent vs $50k).
- Recommended offer: $49k (1.5% below list) — sets the bar for market timing.
- Cap rate 25.2% vs local median 6.1% in Rockford — top-decile yield for the area; either an underpriced asset or a hidden risk that comps aren't pricing in. Stress-test before assuming the spread holds.
Location & tenants
- Location reads 62/100 on livability (#876 in IL) — a middle-class / working-renter tenant base. Strengths: cost of living A+, housing A+, health & safety A+; Watch: crime F, amenities F, commute F.
- Rockford SD 205 (urban): math 12% / reading 16% proficiency, ranked #533 of 620 in IL (top 86%) — low school quality limits family demand, transient renter base, plan for 1-2y turnover; 73% free/reduced lunch — lower-income household profile, screen leases tightly.
- Zoned schools: Conklin Elem School (math 2% / reading 2%, grade F, #1,927 of 2,056 statewide, top 100%, 433 students, 0% FRL); West Middle School (math 3% / reading 11%, grade F, #627 of 665 statewide, top 95%, 849 students, 0% FRL); Auburn High School (math 26% / reading 32%, grade F, #210 of 693 statewide, top 30%, 1,936 students, 0% FRL) — zoned schools average 0% FRL vs 73% district-wide (73 pts lower); this property's tenant base skews higher-income than the district average.
- Market conditions: 76 active listings in the ZIP; 11 comparable units currently listed for rent nearby; rentals at typical pace (median 14d on market — plan ~3-4 weeks tenant-placement turnaround); 285 units permitted in Winnebago County in 2024 (0 in 5+ unit buildings).
- This rent runs 37% of the median local income ($46k/yr) — at the standard rent-burdened threshold; future hikes will face affordability resistance.
Forward outlook
- Local home prices are declining (-3.0%/yr); year-one equity from $345 of loan paydown is wiped out by about $1k of value loss. Plan a longer hold.
- Winnebago County population projected at -20% by 2050 — secular population decline; favor cash flow + early exit over multi-decade hold.
- At projected returns (-3.0% appreciation + 3.0% rent growth), your $14k cash investment doubles in ~2 years — after that, you're playing with house money.
Negotiation context
- It's been on market 16 days — a 2% lower offer ($49k) is reasonable based on typical stale-listing flexibility.
- 5 sale attempts since 11y ago with the ask held roughly flat each time — persistent listings suggest the price (not the market) is what's stuck; bring a comps-based counter.
- Current owner paid $7k; list at $50k implies a 593% gain — meaningful room to come down on a strong offer.
Questions for the listing agent
- Built in 1972 — when were the roof, HVAC, electrical panel, plumbing, and water heater last replaced?
- Is there a deadline driving the sale (1031 exchange, divorce, estate, relocation)? That informs how much negotiation room exists.
- Schools are F-rated, which usually means shorter tenancies and higher turnover. Who's the typical renter profile here, and what's been the actual vacancy rate?
- Crime grade is F in this area — have there been break-ins, vandalism, or insurance claims at this property in the last 3 years? What carrier currently insures it and at what premium?
- What's the average days-on-market for RENTAL listings here right now (not sales)? A rising rental-DOM trend means longer vacancies and softer asking-rent achievability than the comps imply.
- What's the recent tenant-quality profile in this submarket — average credit score on applications, eviction rate, late-payment / NSF rate, and stable-employment percentage? A property-management company in the area should have these aggregated.
- How much new for-sale + rental construction is in the pipeline within 1–3 miles? Heavy new supply typically softens prices + rents 12–24 months out; constrained supply supports both.
Investment metrics
- 1% rule
- 2.85% ✓
- Cap rate
- 25.24%
- Cash-on-cash
- 67.68%
- DSCR
- 4.01
- GRM
- 2.9
CMA / ARV
- ARV (on-the-fly)
- $166,911
- Comps found
- 12
Show comp detail 12 sales within ~0.75 mi
| Address | Dist | Beds/Ba | Sqft | Sold | Price | $/sf | Match |
|---|---|---|---|---|---|---|---|
| 3236 Ellis Rd | 0.17mi | 3/1.0 | 1,442 (+6%) | 7mo | $115,000 | $80 | 76 |
| 2807 Carmac Rd | 0.43mi | 3/1.5 | 1,330 (-2%) | 1mo | $190,000 | $143 | 74 |
| 3036 Rice Ave | 0.35mi | 4/2.0 (+1) | 1,382 (+2%) | 8mo | $222,500 | $161 | 65 |
| 2724 Kilburn Ave | 0.63mi | 3/1.0 | 1,345 (-1%) | 8mo | $125,000 | $93 | 63 |
| 3507 Packard Pkwy | 0.36mi | 3/2.0 | 1,196 (-12%) | 2mo | $176,000 | $147 | 58 |
| 2312 Jonathan Ave Ave | 0.68mi | 3/1.5 | 1,466 (+8%) | 3mo | $116,000 | $79 | 51 |
| 2616 Karen Dr | 0.50mi | 3/2.0 | 1,180 (-13%) | 1mo | $205,000 | $174 | 50 |
| 2324 Paradise Blvd | 0.69mi | 4/2.5 (+1) | 1,318 (-3%) | 10mo | $150,000 | $114 | 44 |
| 3959 Riverside Blvd | 0.60mi | 3/2.0 | 1,510 (+11%) | 10mo | $151,000 | $100 | 41 |
| 2316 Pierce Ave | 0.69mi | 3/1.0 | 1,221 (-10%) | 12mo | $155,000 | $127 | 41 |
| 2328 Pierce Ave | 0.66mi | 3/2.0 | 1,187 (-12%) | 4mo | $129,000 | $109 | 41 |
| 2612 Glenwood Ave | 0.74mi | 3/1.0 | 1,166 (-14%) | 6mo | $143,000 | $123 | 37 |
Match score weights: distance 35% · size 25% · config 20% · recency 20%. Top-matched comps best support the ARV.
Projected returns pro-forma
-3.0% appreciation · 3.0% rent growth · sell at horizon
- IRR
- 67.0%
- Equity multiple
- 4.01×
- Total profit
- $42,120
- Equity at exit
- $7,440
- IRR
- 71.3%
- Equity multiple
- 8.26×
- Total profit
- $101,372
- Equity at exit
- $4,314
Cash invested: $13,972 (down + closing). Projections, not guarantees.
Landlord ↔ Tenant lean methodology
- Overall (STATE)
- 43 Moderately Tenant-Leaning
- State Illinois
- 43 Moderately Tenant-Leaning · D+7
- County
- — inherits STATE
- City
- — inherits STATE
ZIP-level market 61101
- Home prices YoY
- -25.4%
- Active inventory
- 76
- Price-to-rent
- 2.9×
Monthly cashflow live
- Estimated rent
- $1,424 high interval (Pro) →
- Mortgage (P&I)
- −$262
- Tax from tax record
- −$54 /mo · $654/yr
- Insurance
- −$21
- HOA
- −$0
- Vacancy / Maint / Mgmt
- −$299
- Net cashflow
- $788
Break-even live
Sensitivity live
| Price | -10% $816 | -5% $802 | +0% $788 | +5% $774 | +10% $760 |
|---|---|---|---|---|---|
| Rent | -10% $676 | -5% $732 | +0% $788 | +5% $844 | +10% $901 |
| Rate | -1.0pp $813 | -0.5pp $801 | base $788 | +0.5pp $775 | +1.0pp $762 |
UW: 25.0% down · 7.5% · 30yr · 1.5% tax · 5.0% vac · 8.0% maint · 8.0% mgmt
Financing live
Cash to close
- Down payment
- $12,475
- Closing costs
- $1,497
- Reserves months
- —
- Total cash needed
- —
Loan-product check · same deal, 3 products live
Conventional
25% down · 7.5% · 30yr
- Down + closing
- —
- Monthly P&I
- —
- Monthly cashflow
- —
- DSCR
- —
- Eligible?
- —
Personal DTI + credit; lowest rate.
DSCR
20% down · 8.5% · 30yr
- Down + closing
- —
- Monthly P&I
- —
- Monthly cashflow
- —
- DSCR
- —
- Eligible?
- —
No personal income docs; deal must DSCR.
Hard money
10% down · 12.0% · 12mo
- Down + closing
- —
- Monthly P&I
- —
- Monthly cashflow
- —
- DSCR
- —
- Eligible?
- —
Short-term bridge; refi at stabilization.
Rent comps 11 comps
| Address | Beds | Baths | Sqft | Rent | $/sqft | DOM | Units | Dist |
|---|---|---|---|---|---|---|---|---|
| 2535 Halsted Rd Rockford, IL | 3.0 | 1.0–1.5 | 850 | $1,399 | $1.65 | 14d | 1 | 0.41mi |
| 2330 Kilburn Ave Rockford, IL | 2.0–3.0 | 1.0–2.0 | 950 | $1,199 | $1.26 | 14d | 1 | 0.86mi |
| 3936 Eagle Dr Rockford, IL | 1.0–2.0 | 1.0 | 712 | $999 | $1.40 | 14d | 1 | 0.86mi |
| 2019 Overdene Ave Rockford, IL | 3.0 | 1.0 | 875 | $1,500 | $1.71 | 44d | 1 | 0.93mi |
| 2019 Overdene Ave Rockford, IL | 3.0 | 1.0 | 875 | $1,400 | $1.60 | 14d | 1 | 0.93mi |
| 1823 Overdene Ave Rockford, IL | 3.0 | 1.0 | 875 | $1,500 | $1.71 | 21d | 1 | 1.03mi |
| 1823 Overdene Ave Rockford, IL | 3.0 | 1.0 | 875 | $1,400 | $1.60 | 14d | 1 | 1.03mi |
| 3007 Huffman Blvd Rockford, IL | 3.0 | 1.5 | 1296 | $1,450 | $1.12 | 44d | 1 | 1.11mi |
| 1617 Vermont St Rockford, IL | 2.0 | 1.0 | 1375 | $1,325 | $0.96 | 44d | 1 | 1.32mi |
| 1614 Pauline Ave Rockford, IL | 2.0 | 1.0 | 956 | $1,400 | $1.46 | 44d | 1 | 1.35mi |
| 3422 Fremont St Rockford, IL | 3.0 | 2.0 | 1700 | $1,975 | $1.16 | 14d | 1 | 1.38mi |
Listing history 15 events
-
2026-06-17status $49,900 Pending 16 DOM
-
2026-06-17days on market $49,900 Active 16 DOM
-
2026-06-16days on market $49,900 Active 15 DOM
-
2026-06-15days on market $49,900 Active 14 DOM
-
2026-06-14days on market $49,900 Active 12 DOM
-
2026-06-13days on market $49,900 Active 11 DOM
-
2026-06-10days on market $49,900 Active 9 DOM
-
2026-06-09days on market $49,900 Active 8 DOM
-
2026-06-08days on market $49,900 Active 7 DOM
-
2026-06-07days on market $49,900 Active 6 DOM
-
2026-06-03days on market $49,900 Active 2 DOM
-
2026-06-02remarks 699-char remark
-
2026-06-02$49,900 Active 1 DOM
-
2026-06-01remarks 636-char remark
Show marketing remark (723 chars)
Bring Your Vision to Rockford! If you've been searching for a property with great bones where you can build instant sweat equity, this is it. This 3-bedroom, 1-bath home offers a fantastic footprint and sits on a massive lot with endless possibilities for expansion, gardening, or outdoor entertainment. Complete with a 2-car garage, this home is a blank canvas ready for its next chapter. This property requires some TLC and is being sold strictly as-is (including all current personal property). Leased solar panels will convey with the sale. Perfect for an ambitious homeowner or an investor looking for their next rewarding project! Property is sold as is. Buyer will be responsible for removing anything in the home.
-
2026-06-01$49,900 Active 1 DOM
Show marketing remark (723 chars)
Bring Your Vision to Rockford! If you've been searching for a property with great bones where you can build instant sweat equity, this is it. This 3-bedroom, 1-bath home offers a fantastic footprint and sits on a massive lot with endless possibilities for expansion, gardening, or outdoor entertainment. Complete with a 2-car garage, this home is a blank canvas ready for its next chapter. This property requires some TLC and is being sold strictly as-is (including all current personal property). Leased solar panels will convey with the sale. Perfect for an ambitious homeowner or an investor looking for their next rewarding project! Property is sold as is. Buyer will be responsible for removing anything in the home.
ⓘ Source: listings_history table (triggers on properties + properties_extension) + one-shot
backfill from property_details.listing_events for pre-trigger history.
Tax reassessment forecast IL · Partial reset (capped growth)
- Current annual tax
- $654 · $54/mo
- Projected year-2 tax
- $893 · $74/mo
- Expected delta
- +$240/yr (+$20/mo · 36.6%)
ⓘ Screening estimate from a state-policy table — verify with the county assessor before closing.
Climate risk First Street
- Flood 1/10 Low FEMA zone X (unshaded) · 0% chance over 30 yrs
- Wildfire 1/10 Low
- Heat 2/10 Low 7 d/yr ≥102°F today · 15 d/yr by 30 yrs out
- Wind 2/10 Low
- Air quality 2/10 Low 1 unhealthy d/yr today · 2 by 30 yrs out
Nearby sold comps map
Loading sold comps map…
Walkable amenities ~0.75 mi
Loading nearby amenities…
Taxation est. · year 1
- Rental income
- $17,088
- − Mortgage interest
- −$2,795
- − Property taxes
- −$654
- − Insurance
- −$250
- − Repairs & maintenance
- −$1,367
- − Management
- −$1,367
- − Depreciation
- −$1,452
- Taxable income
- $9,204
- Est. tax owed @ 24.0%
- −$2,209
- After-tax cash flow
- $7,247/yr
For passive investors: Depreciation is non-cash, so a rental often shows a tax loss while cash-flowing — sheltering income. Rental losses are passive: they offset passive income freely, and up to $25,000/yr can offset ordinary (W-2) income if you actively participate and your MAGI is under $100k (phasing out to $0 by $150k); unused losses carry forward. On sale, claimed depreciation is recaptured at up to 25%, and gains may owe capital-gains tax (a 1031 exchange can defer both). Figures are a year-1 estimate at your 24.0% rate — not tax advice; consult a CPA.
Schools (NCES district)
- District
- Rockford SD 205
- NCES district ID
- 1734510
- Math proficiency
- 12% ▼ -2.00%
- Reading proficiency
- 16% ▼ -3.00%
- Median HH income
- $42,533
- Composite
- 12.21/100
- National rank
- #9649
- State rank
- #533 of 620 in IL
Livability — Rockford
- Score
- 62/100
- State rank
- #876
- US rank
- #17035
Category grades
Schools grade is shown separately in the Schools card above.
Census & demographics
- County
- Winnebago County · 147,297 people
- City population
- 147,297
- Metro
- Rockford, IL
- Population (ZIP)
- 19,318
- Household income
- $46,163
- Rent vs Own
- Severe rent burden
- 1170.0
Population outlook (Winnebago County) Hauer SSP2
- Today (2025)
- 271,080 people
- By 2030
- 260,684 · -3.8%
- By 2040
- 238,405 · -12.1%
- By 2050
- 216,129 · -20.3%
- By 2075
- 172,882 · -36.2%
- By 2100
- 135,336 · -50.1%
Race, ethnicity, and origin ACS 2023
- Neighborhood character
- Diverse neighborhood (Simpson 0.66)
- Race & ethnicity
- White 44% Black 34% Hispanic / Latino 16% Two or more races 8% Asian 1%
- Hispanic origin (detail)
- Mexican 14% Puerto Rican 1%
- Common ancestry
- Romanian 3% Italian 2% Portuguese 2%
- Foreign-born
- 9% · Canada
- Languages at home
- 84% English-only · Spanish 13% Other Indo-European 1% Russian/Polish/Slavic 1%
Political lean MEDSL · Winnebago
- 2024 margin
- Toss-up / Even · D 49.5% · R 49.0% · Other 1.5%
- 2008→2024 swing
- -12.2pp toward R · 2008: 12.8pp · 2024: 0.6pp
- All cycles
- 2024: D+0.6 2020: D+2.5 2016: R+1.2 2012: D+5.7 2008: D+12.8
Not yet ingested
- Civics
- —
Market trends
- HPI YoY
- ▼ -69.58%
- Current HPI
- 204.8946
- Rent YoY
- —
- Metro
- Rockford, IL
- State GDP YoY
- ▲ 1.59%
- F500 in state
- 60
Industry mix (Fortune 500 HQ in IL)
| Industry | F500 HQs | Revenue |
|---|---|---|
| Insurance | 4 | $201B |
|
||
| Consumer Goods | 4 | $87B |
|
||
| Industrial Machinery | 3 | $64B |
|
||
| Healthcare | 2 | $55B |
|
||
| Retail / Pharmacy | 1 | $148B |
|
||
| Agriculture / Food | 1 | $86B |
|
||
Price history
+404.0% since first listed11 events — show timeline
- 2026-06-01 Listed $49,900 NWIAR
- 2026-06-01 Listed $49,900 MRED as Distributed by MLS Grid
- 2026-04-22 Contingent — MRED as Distributed by MLS Grid
- 2026-04-21 Listing Removed — MRED as Distributed by MLS Grid
- 2026-03-26 Listed — MRED as Distributed by MLS Grid
- 2015-06-05 Sold (MLS) $7,200 MRED as Distributed by MLS Grid
- 2015-06-05 Sold (MLS) $7,200 NWIAR
- 2015-05-27 Pending — MRED as Distributed by MLS Grid
- 2015-05-04 Price Changed $9,900 MRED as Distributed by MLS Grid
- 2015-04-03 Listed $19,900 MRED as Distributed by MLS Grid
- 2015-04-01 Listed $9,900 NWIAR
Property tax history
-2.1%/yrLatest (2024): $654 · -7.9% YoY. Source: county tax records.
Cash-flow waterfall
monthlySold comps — $/sqft
last 12 mo · ≤1 miLoading sold comps…