 Multi-family
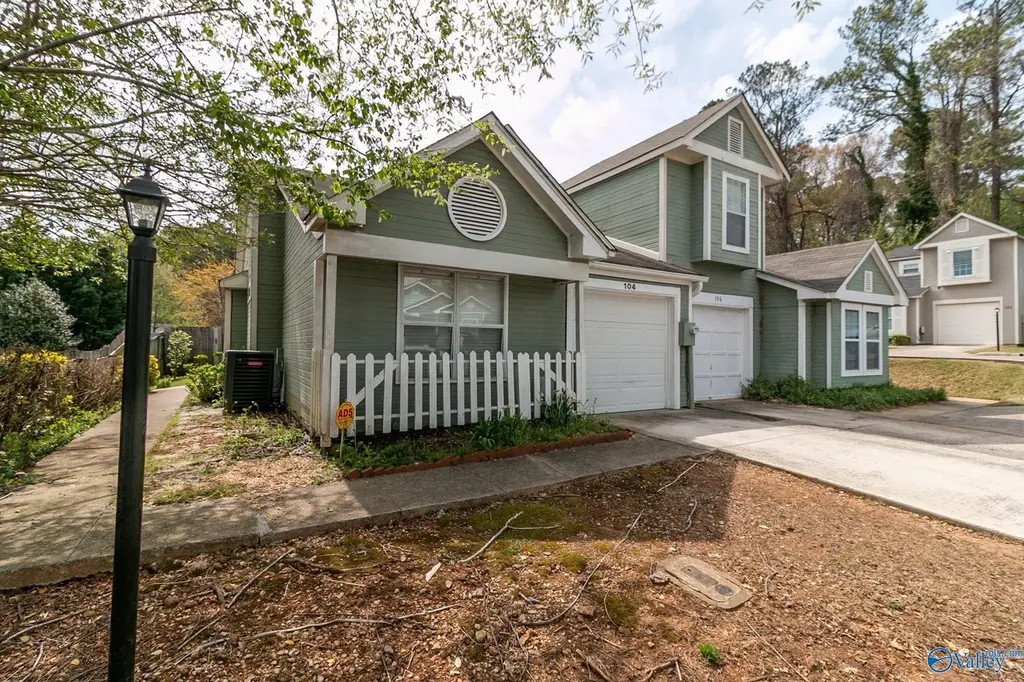
104 Brownsridge Ln · Madison, AL
Flood risk 1/10 · Minimal
- FEMA flood zone
- X (unshaded)
- Chance of flooding over 30 yrs
- 0.0%
- Est. flood insurance / yr
- $507 – $1,088
Fire risk 1/10 · Minimal
- Est. fire insurance / yr
- $916 – $1,700
Heat risk 6/10 · Moderate
- Hot days now (above 105°F)
- 7 days/yr
- Hot days in 30 yrs
- 19 days/yr
Wind risk 4/10 · Minor
- Chance of severe wind over 30 yrs
- 17.0%
Air-quality risk 2/10 · Minimal
- Unhealthy air days now
- 0 days/yr
- Unhealthy air days in 30 yrs
- 2 days/yr
Risk factors via First Street. Map © Google.
Why this score? — see what drove the B grade
The composite is a weighted blend of 9 inputs, each scored 0–100. Each bar is that input's sub-score; the figure is the points it added to the 100-point composite (weight × sub-score).
- Cash flow +26.3/30.0
- Appreciation +10.0/10.0
- DSCR +8.9/10.0
- ARV discount +7.3/15.0
- 1% rule +6.6/10.0
- Schools +5.6/10.0
- Livability +3.8/5.0
- Rent growth +2.9/5.0
- Condition / age +2.5/5.0
$260,000
🖨 Deal sheet 📄 Offer letter ✓ Due diligence
Multi-family units
County records classify this as Multi-Family (5+ Unit). Listing-text estimate: 1 unit. estimate disagrees with records
5+ unit building — per-unit beds/baths from public records are typically unavailable; the breakdown below (if shown) is an estimate from the listing text.
Listing remarks MLS
Investment Opportunity! This is a great property that is being sold with 5 other properties. All are currently leased and would be ideal for the Investor looking to enlarge your Portfolio or the Investor starting your Business. One Level 2 bedroom, 2 bath Patio Home in the heart of Madison. Open Floorplan w/soaring ceilings, stacked stone fireplace, wide plank flooring and an updated kitchen. Private Deck for outdoor enjoyment and attached garage all make this a fantastic investment. The Investment Portfolio of the 6 Properties: $1,350,000 - Madison: 114 Briargate Lane, 104 Brownsridge Lane, 2006 Liberty, 254 Waters Edge, 434 Shamrock Huntsville: 2020 Woodlawn Dr
Key facts
- Private deck
- Patio home
- Open floorplan
Tags
Neighborhood map
What this means for you Summary
Snapshot
- This is a 2-bed/1.0-bath multifamily listed at $260k.
Deal economics
- At list price, monthly cash flow is $673 ($8k/yr) — positive.
- The deal already cash-flows at list — no discount required.
- Meets the 1% rule at list price ($3k rent vs $260k).
- Recommended offer: $229k (12.0% below list) — sets the bar for market timing.
- Cap rate 9.4% vs local median 2.6% in Madison — top-decile yield for the area; either an underpriced asset or a hidden risk that comps aren't pricing in. Stress-test before assuming the spread holds.
Location & tenants
- Location reads 76/100 on livability (#12 in AL, #3,280 nationally) — a middle-class / working-renter tenant base. Strengths: employment A+, housing A+, schools A; Watch: amenities F, commute F.
- Madison City (suburban): math 51% / reading 71% proficiency, ranked #4 of 129 in AL (top 3%) — acceptable for families but not a draw, mixed tenant base, ~2y average lease; only 17% free/reduced lunch — higher-income household profile.
- Market conditions: Rents rising (+1.6%/yr); 382 active listings in the ZIP; 17 comparable units currently listed for rent nearby; rentals at typical pace (median 23d on market — plan ~3-4 weeks tenant-placement turnaround); high-income renter base; 4,709 units permitted in Madison County in 2024 (1,186 in 5+ unit buildings).
- This rent runs 31% of the median local income ($117k/yr) — at the standard rent-burdened threshold; future hikes will face affordability resistance.
Forward outlook
- In year one you build about $28k of equity ($2k loan paydown + $26k appreciation (10.0% local appreciation)).
- Madison County population projected at +18% by 2050 — long-run rental-demand tailwind backs the buy-and-hold thesis.
- At projected returns (10.0% appreciation + 1.6% rent growth), your $73k cash investment doubles in ~2 years — after that, you're playing with house money.
- By year 2, paydown + projected appreciation supports a ~$45k cash-out refi (75% LTV) — recoverable capital for the next deal without selling this one.
Negotiation context
- It's been on market 448 days — a 12% lower offer ($229k) is reasonable based on typical stale-listing flexibility.
- 5 sale attempts since 12y ago with the ask held roughly flat each time — persistent listings suggest the price (not the market) is what's stuck; bring a comps-based counter.
- Current owner paid $129k; list at $260k implies a 102% gain — meaningful room to come down on a strong offer.
Risks & watch-outs
- Climate carrying-cost: extreme-heat days projected 7→19/yr by 2055 (HVAC capex compounding) — expect insurance premiums to compound above CPI over the hold.
Questions for the listing agent
- It's been on market 448 days. Have you received any prior offers? Is the seller open to a 12% concession, seller financing, or rate buy-down credit?
- What does the HOA fee cover, when was the last increase, and are there any pending special assessments or reserve-fund shortfalls?
- Why hasn't it sold? Are there any deal-killer items the seller is aware of (foundation, flood, title, zoning, code violations)?
- Is there a deadline driving the sale (1031 exchange, divorce, estate, relocation)? That informs how much negotiation room exists.
- Schools are A-rated — typically a magnet for longer-tenancy family renters. What's the average tenant stay here, and is there a school-zone premium baked into asking?
- What's the average days-on-market for RENTAL listings here right now (not sales)? A rising rental-DOM trend means longer vacancies and softer asking-rent achievability than the comps imply.
- What's the recent tenant-quality profile in this submarket — average credit score on applications, eviction rate, late-payment / NSF rate, and stable-employment percentage? A property-management company in the area should have these aggregated.
- How much new apartment / multifamily construction is in the pipeline within 1–3 miles? Heavy new supply (>2% of stock underway) typically softens rents 12–24 months out; light construction supports rent growth.
Investment metrics
- 1% rule
- 1.16% ✓
- Cap rate
- 9.40%
- Cash-on-cash
- 11.09%
- DSCR
- 1.49
- GRM
- 7.2
CMA / ARV
- ARV (median comp)
- $258,736
- List price
- $260,000
- Delta
- 0.49%
- Verdict
- FAIR
- Comps
- 20 within 1.0 mi
Projected returns pro-forma
10.0% appreciation · 1.58% rent growth · sell at horizon
- IRR
- 31.8%
- Equity multiple
- 3.48×
- Total profit
- $180,203
- Equity at exit
- $234,229
- IRR
- 27.0%
- Equity multiple
- 7.71×
- Total profit
- $488,814
- Equity at exit
- $505,123
Cash invested: $72,800 (down + closing). Projections, not guarantees.
Landlord ↔ Tenant lean methodology
- Overall (STATE)
- 90 Strongly Landlord-Friendly
- State Alabama
- 90 Strongly Landlord-Friendly · R+15
- County
- — inherits STATE
- City
- — inherits STATE
ZIP-level market 35758
- Home prices YoY
- 4.2%
- Rents YoY
- 1.6%
- Active inventory
- 382
- Price-to-rent
- 14.4×
Monthly cashflow live
- Estimated rent
- $3,017 medium interval (Pro) →
- Mortgage (P&I)
- −$1,363
- Tax from tax record
- −$159 /mo · $1,905/yr
- Insurance
- −$108
- HOA
- −$80
- Vacancy / Maint / Mgmt
- −$634
- Net cashflow
- $673
Break-even live
2-unit breakdown (identical units grouped — click to expand)
| Units | Beds | Baths | Est. rent |
|---|---|---|---|
| 2× units | 2 | 2 | $3,016 |
| #1 | 2 | 2 | $1,508 |
| #2 | 2 | 2 | $1,508 |
| Total (2 units) | $3,017 | ||
UW: 25.0% down · 7.5% · 30yr · 1.5% tax · 5.0% vac · 8.0% maint · 8.0% mgmt
Financing live
Cash to close
- Down payment
- $65,000
- Closing costs
- $7,800
- Reserves months
- —
- Total cash needed
- —
Loan-product check · same deal, 3 products live
Conventional
25% down · 7.5% · 30yr
- Down + closing
- —
- Monthly P&I
- —
- Monthly cashflow
- —
- DSCR
- —
- Eligible?
- —
Personal DTI + credit; lowest rate.
DSCR
20% down · 8.5% · 30yr
- Down + closing
- —
- Monthly P&I
- —
- Monthly cashflow
- —
- DSCR
- —
- Eligible?
- —
No personal income docs; deal must DSCR.
Hard money
10% down · 12.0% · 12mo
- Down + closing
- —
- Monthly P&I
- —
- Monthly cashflow
- —
- DSCR
- —
- Eligible?
- —
Short-term bridge; refi at stabilization.
Rent comps 17 comps
| Address | Beds | Baths | Sqft | Rent | $/sqft | DOM | Units | Dist |
|---|---|---|---|---|---|---|---|---|
| 105 Browns Ridge Ln Unit 1 Madison, AL | 2.0 | 2.0 | 984 | $1,250 | $1.27 | 23d | 1 | 0.00mi |
| 100 Arch St Pl Madison, AL | 1.0–2.0 | 1.0–2.0 | 838 | $1,706 | $2.03 | 13d | 20 | 0.15mi |
| 7900 Old Madison Pike Madison, AL | 2.0–4.0 | 1.0–2.5 | 1313 | $1,164 | $0.89 | 13d | 11 | 0.36mi |
| 1 Madison Park Dr Madison, AL | 1.0–3.0 | 1.0–2.0 | 1149 | $1,678 | $1.46 | 13d | 18 | 0.45mi |
| 286 Slaughter Rd NW Madison, AL | 1.0–3.0 | 1.0–3.0 | 1385 | $1,699 | $1.23 | 13d | 31 | 0.59mi |
| 1105 Woodbine Rd Madison, AL | 3.0 | 1.5 | 1254 | $1,500 | $1.20 | 23d | 1 | 0.77mi |
| 403 Oakland Rd Madison, AL | 2.0 | 2.5 | 1165 | $1,295 | $1.11 | 43d | 1 | 0.87mi |
| 194 Shelton Rd Madison, AL | 2.0 | 1.0–2.0 | 729 | $1,149 | $1.58 | 13d | 9 | 0.92mi |
| 124 Westscott Dr Madison, AL | 2.0 | 2.0 | 994 | $1,025 | $1.03 | 21d | 1 | 0.96mi |
| 111 Westscott Dr Madison, AL | 2.0 | 2.0 | 975 | $995 | $1.02 | 43d | 1 | 1.02mi |
| 104 Westscott Dr Madison, AL | 2.0 | 2.0 | 975 | $995 | $1.02 | 43d | 1 | 1.06mi |
| 2002 Flagstone Dr Madison, AL | 1.0–3.0 | 1.0–2.0 | 973 | $1,247 | $1.28 | 13d | 77 | 1.26mi |
| 200 Millstone Ln Madison, AL | 3.0 | 2.0 | 1425 | $2,000 | $1.40 | 43d | 1 | 1.41mi |
| 712 Marion Dr Madison, AL | 3.0 | 1.0 | 1253 | $1,450 | $1.16 | 43d | 1 | 1.42mi |
| 100 River Oaks Dr Madison, AL | 3.0 | 2.0 | 1126 | $1,600 | $1.42 | 23d | 1 | 1.44mi |
| 210 Waters Edge Ln #6 Madison, AL | 2.0 | 2.0 | 1060 | $1,075 | $1.01 | 43d | 1 | 1.48mi |
| 104 Waters Edge Ln Unit 104 Madison, AL | 2.0 | 1.0 | 775 | $1,000 | $1.29 | 13d | 1 | 1.49mi |
HOA detail
- Monthly dues
- $80 · $960/yr
- Likely covers
- water
Listing history 27 events
-
2026-06-18days on market $260,000 Active 448 DOM
-
2026-06-17days on market $260,000 Active 447 DOM
-
2026-06-16days on market $260,000 Active 446 DOM
-
2026-06-15days on market $260,000 Active 445 DOM
-
2026-06-14days on market $260,000 Active 443 DOM
-
2026-06-10days on market $260,000 Active 440 DOM
-
2026-06-09days on market $260,000 Active 439 DOM
-
2026-06-08days on market $260,000 Active 438 DOM
-
2026-06-07days on market $260,000 Active 437 DOM
-
2026-06-03days on market $260,000 Active 433 DOM
-
2026-06-02days on market $260,000 Active 432 DOM
-
2026-06-01days on market $260,000 Active 431 DOM
-
2026-05-31days on market $260,000 Active 430 DOM
-
2026-05-30days on market $260,000 Active 429 DOM
-
2025-03-28$260,000 Active 675-char remark
Show marketing remark (675 chars)
Investment Opportunity! This is a great property that is being sold with 5 other properties. All are currently leased and would be ideal for the Investor looking to enlarge your Portfolio or the Investor starting your Business. One Level 2 bedroom, 2 bath Patio Home in the heart of Madison. Open Floorplan w/soaring ceilings, stacked stone fireplace, wide plank flooring and an updated kitchen. Private Deck for outdoor enjoyment and attached garage all make this a fantastic investment. The Investment Portfolio of the 6 Properties: $1,350,000 - Madison: 114 Briargate Lane, 104 Brownsridge Lane, 2006 Liberty, 254 Waters Edge, 434 Shamrock Huntsville: 2020 Woodlawn Dr
-
2025-03-08historical $1,250
-
2025-02-15$1,250
-
2020-02-10soldstatus $128,650
-
2020-02-07soldstatus $128,650 Sold 338-char remark
Show marketing remark (338 chars)
This home has it all and then some. The open floor plan has soaring vaulted ceilings, stacked stone tile fireplace, wide plank flooring, and a kitchen that has had a major face lift. Cabinets with granite counters, tile backsplash and stainless steel appliances. Outside you will find a HUGE private deck that is perfect for entertaining.
-
2020-01-17historical Contingent 338-char remark
Show marketing remark (338 chars)
This home has it all and then some. The open floor plan has soaring vaulted ceilings, stacked stone tile fireplace, wide plank flooring, and a kitchen that has had a major face lift. Cabinets with granite counters, tile backsplash and stainless steel appliances. Outside you will find a HUGE private deck that is perfect for entertaining.
-
2020-01-15$120,000 Active 338-char remark
Show marketing remark (338 chars)
This home has it all and then some. The open floor plan has soaring vaulted ceilings, stacked stone tile fireplace, wide plank flooring, and a kitchen that has had a major face lift. Cabinets with granite counters, tile backsplash and stainless steel appliances. Outside you will find a HUGE private deck that is perfect for entertaining.
-
2015-02-06soldstatus $105,900
-
2015-02-06soldstatus $106,000
-
2014-10-05$109,900
-
2014-08-01soldstatus $60,000
-
2014-07-31soldstatus $60,000
-
2014-07-11$69,900
ⓘ Source: listings_history table (triggers on properties + properties_extension) + one-shot
backfill from property_details.listing_events for pre-trigger history.
Tax reassessment forecast AL · Resets to sale price
- Current annual tax
- $1,905 · $159/mo
- Projected year-2 tax
- $1,905 · $159/mo
- Expected delta
- $0/yr ($0/mo · 0.0%)
ⓘ Screening estimate from a state-policy table — verify with the county assessor before closing.
Climate risk First Street
- Flood 1/10 Low FEMA zone X (unshaded) · 0% chance over 30 yrs
- Wildfire 1/10 Low
- Heat 6/10 Major 7 d/yr ≥105°F today · 19 d/yr by 30 yrs out
- Wind 4/10 Moderate 17% chance of damaging wind over 30 yrs
- Air quality 2/10 Low 0 unhealthy d/yr today · 2 by 30 yrs out
Nearby sold comps map
Loading sold comps map…
Walkable amenities ~0.75 mi
Loading nearby amenities…
Taxation est. · year 1
- Rental income
- $36,204
- − Mortgage interest
- −$14,564
- − Property taxes
- −$1,905
- − Insurance
- −$1,300
- − Repairs & maintenance
- −$2,896
- − Management
- −$2,896
- − HOA
- −$960
- − Depreciation
- −$7,564
- Taxable income
- $4,119
- Est. tax owed @ 24.0%
- −$989
- After-tax cash flow
- $7,086/yr
For passive investors: Depreciation is non-cash, so a rental often shows a tax loss while cash-flowing — sheltering income. Rental losses are passive: they offset passive income freely, and up to $25,000/yr can offset ordinary (W-2) income if you actively participate and your MAGI is under $100k (phasing out to $0 by $150k); unused losses carry forward. On sale, claimed depreciation is recaptured at up to 25%, and gains may owe capital-gains tax (a 1031 exchange can defer both). Figures are a year-1 estimate at your 24.0% rate — not tax advice; consult a CPA.
Schools (NCES district)
- District
- Madison City
- NCES district ID
- 0100008
- Math proficiency
- 51% ▼ -25.00%
- Reading proficiency
- 71% ▼ -2.00%
- Median HH income
- $89,091
- Composite
- 55.56/100
- National rank
- #1238
- State rank
- #4 of 129 in AL
Livability — Madison
- Score
- 76/100
- State rank
- #12
- US rank
- #3280
Category grades
Schools grade is shown separately in the Schools card above.
Census & demographics
- Census place
- Madison, AL
- County
- Madison County · 380,832 people
- City population
- 93,742
- Metro
- Huntsville, AL
- Population (ZIP)
- 50,266
- Household income
- $117,380
- Rent vs Own
- Severe rent burden
- 875.0
Population outlook (Madison County) Hauer SSP2
- Today (2025)
- 392,086 people
- By 2030
- 409,788 · +4.5%
- By 2040
- 440,557 · +12.4%
- By 2050
- 460,990 · +17.6%
- By 2075
- 502,872 · +28.3%
- By 2100
- 513,623 · +31.0%
Race, ethnicity, and origin ACS 2023
- Neighborhood character
- Predominantly White (68%)
- Race & ethnicity
- White 68% Black 14% Hispanic / Latino 8% Asian 7% Two or more races 7%
- Hispanic origin (detail)
- Mexican 3% Puerto Rican 2%
- Common ancestry
- Slovak 3% Italian 2% Lithuanian 2%
- Foreign-born
- 9% · Canada, South Korea, Vietnam
- Languages at home
- 87% English-only · Spanish 5% Other Asian/Pacific 2% Chinese 1%
Political lean MEDSL · Madison
- 2024 margin
- Lean R (+9.0) · D 44.7% · R 53.7% · Other 1.6%
- 2008→2024 swing
- +6.0pp toward D · 2008: -14.9pp · 2024: -9.0pp
- All cycles
- 2024: R+9.0 2020: R+8.0 2016: R+16.8 2012: R+18.7 2008: R+14.9
Not yet ingested
- Civics
- —
Market trends
- HPI YoY
- ▲ 14.46%
- Current HPI
- 355.2784
- Rent YoY
- ▲ 1.58%
- Metro
- Huntsville, AL
- State GDP YoY
- ▲ 2.94%
- F500 in state
- 4
Industry mix (Fortune 500 HQ in AL)
| Industry | F500 HQs | Revenue |
|---|---|---|
| Financial Services | 1 | $8B |
|
||
| Healthcare | 1 | $5B |
|
||
Price history
+272.0% since first listed13 events — show timeline
- 2025-03-28 Listed $260,000 VMLS
- 2025-03-08 Rental Removed $1,250 VMLS
- 2025-02-15 Listed for Rent $1,250 VMLS
- 2020-02-10 Sold (Public Records) $128,650 Public Records
- 2020-02-07 Sold (MLS) $128,650 VMLS
- 2020-01-17 Contingent — VMLS
- 2020-01-15 Listed $120,000 VMLS
- 2015-02-06 Sold (Public Records) $106,000 Public Records
- 2015-02-06 Sold (MLS) $105,900 VMLS
- 2014-10-05 Listed $109,900 VMLS
- 2014-08-01 Sold (Public Records) $60,000 Public Records
- 2014-07-31 Sold (MLS) $60,000 VMLS
- 2014-07-11 Listed $69,900 VMLS
Property tax history
+5.6%/yrLatest (2024): $1,905 · +0.0% YoY. Source: county tax records.
Cash-flow waterfall
monthlySold comps — $/sqft
last 12 mo · ≤1 miLoading sold comps…