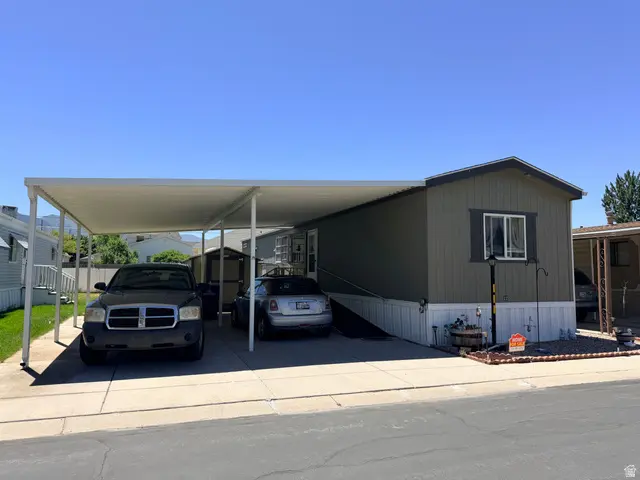
1050 E 800 N #22 · Spanish Fork, UT
Flood risk 1/10 · Minimal
- FEMA flood zone
- X (unshaded)
- Chance of flooding over 30 yrs
- 0.0%
- Est. flood insurance / yr
- $507 – $1,088
Fire risk 4/10 · Minor
- Est. fire insurance / yr
- $453 – $841
Heat risk 4/10 · Minor
- Hot days now (above 95°F)
- 7 days/yr
- Hot days in 30 yrs
- 20 days/yr
Wind risk 1/10 · Minimal
- Chance of severe wind over 30 yrs
- —
Air-quality risk 5/10 · Moderate
- Unhealthy air days now
- 8 days/yr
- Unhealthy air days in 30 yrs
- 8 days/yr
Risk factors via First Street. Map © Google.
Why this score? — see what drove the D grade
The composite is a weighted blend of 9 inputs, each scored 0–100. Each bar is that input's sub-score; the figure is the points it added to the 100-point composite (weight × sub-score).
- 1% rule +10.0/10.0
- Cash flow +7.7/30.0
- ARV discount +7.5/15.0
- Livability +4.2/5.0
- Schools +3.5/10.0
- Rent growth +3.4/5.0
- Condition / age +2.5/5.0
- DSCR +1.8/10.0
- Appreciation +0.0/10.0
$97,500
🖨 Deal sheet (PDF) 📄 Offer letter ✓ Due diligence
Listing remarks MLS
There are no remarks available.
Key facts
- Single level living
- 4 parking spots
- Built 2017
Tags
Property features AI
Finance
- Other: Above-grade finished area reported; Zoned Single-Family
- HOA & community: Homeowners association with monthly fee of $740; Located in a senior community; Subdivision: MILLER MEADOWS
Exterior
- Parking: Two covered parking spaces; Two open parking spaces; Two-car carport (covered)
- Utilities: Natural gas connected; Electricity connected; Water connected (culinary); Sewer connected
- Home design: Mobile home style; Built in 2017; Property listed as single-family
- Construction: Asphalt roof; Other construction materials; Built/standing condition
- Exterior features: Partially fenced yard; Automatic full sprinkler system; Double-pane windows; Storm windows; Outbuildings / storage shed(s)
Interior
- Kitchen: Built-in range/oven; Range hood; Disposal
- Bedrooms: Three main-level bedrooms; Primary bedroom on the first floor
- Flooring: Carpet
- Bathrooms: Two full bathrooms
- Heating & cooling: Gas central heating; Central air conditioning
- Interior features: Primary bathroom; Disposal; Built-in range/oven; Blinds
- Laundry & utility: Washer; Dryer; Electric dryer hookup
Neighborhood map
What this means for you Summary
Snapshot
- This is a 3-bed/2.0-bath manufactured listed at $98k.
Deal economics
- At list price, monthly cash flow is $-113 ($-1k/yr) — negative.
- To cash-flow at today's rent, offer at most $81k (16.7% below list).
- Meets the 1% rule at list price ($2k rent vs $98k).
- Recommended offer: $81k (16.7% below list) — sets the bar for cash-flow.
Location & tenants
- Location reads 83/100 on livability (#26 in UT, #1,012 nationally) — a professional / high-income tenant draw. Strengths: crime A+, commute A+, employment A+; Watch: cost of living C-, amenities F.
- Nebo District (suburban): math 38% / reading 40% proficiency, ranked #45 of 80 in UT (top 56%) — families likely to look elsewhere, expect single-tenant / working-renter base with shorter leases.
- Zoned schools: Rees School (math 43% / reading 33%, grade F, #349 of 585 statewide, top 60%, 641 students, 31% FRL); Maple Mountain High (math 35% / reading 55%, grade D-, #43 of 171 statewide, top 25%, 1,740 students, 10% FRL).
- Market conditions: Rents rising (+3.6%/yr); 575 active listings in the ZIP; 5 comparable units currently listed for rent nearby; rentals at typical pace (median 17d on market — plan ~3-4 weeks tenant-placement turnaround); solid renter incomes; 6,326 units permitted in Utah County in 2024 (1,053 in 5+ unit buildings).
Forward outlook
- Local home prices are declining (-3.0%/yr); year-one equity from $674 of loan paydown is wiped out by about $3k of value loss. Plan a longer hold.
- Utah County population projected at +49% by 2050 — long-run rental-demand tailwind backs the buy-and-hold thesis.
Negotiation context
- Only 9 days on market — expect competitive offers; lowballing is unlikely to land.
- 6 sale attempts since 26y ago with the ask held roughly flat each time — persistent listings suggest the price (not the market) is what's stuck; bring a comps-based counter.
Risks & watch-outs
- Watch-outs: HOA is 45% of rent.
Questions for the listing agent
- What do current leases actually rent for vs. the listed asking? Can we see a recent rent roll and the last 12 months of T-12 income?
- What does the HOA fee cover, when was the last increase, and are there any pending special assessments or reserve-fund shortfalls?
- Is there a deadline driving the sale (1031 exchange, divorce, estate, relocation)? That informs how much negotiation room exists.
- Schools are B-rated — typically a magnet for longer-tenancy family renters. What's the average tenant stay here, and is there a school-zone premium baked into asking?
- The area grade is low — what's the realistic commute time and amenity access for the typical tenant pool here? Any planned neighborhood developments (good or bad) we should know about?
- What's the average days-on-market for RENTAL listings here right now (not sales)? A rising rental-DOM trend means longer vacancies and softer asking-rent achievability than the comps imply.
- What's the recent tenant-quality profile in this submarket — average credit score on applications, eviction rate, late-payment / NSF rate, and stable-employment percentage? A property-management company in the area should have these aggregated.
- How much new for-sale + rental construction is in the pipeline within 1–3 miles? Heavy new supply typically softens prices + rents 12–24 months out; constrained supply supports both.
Investment metrics
- 1% rule
- 1.69% ✓
- Cap rate
- 4.90%
- Cash-on-cash
- -4.96%
- DSCR
- 0.78
- GRM
- 4.9
CMA / ARV
No comps found within radius.
Projected returns pro-forma
-3.0% appreciation · 3.59% rent growth · sell at horizon
- IRR
- -22.5%
- Equity multiple
- 0.21×
- Total profit
- $-21,520
- Equity at exit
- $14,538
- IRR
- -12.6%
- Equity multiple
- 0.20×
- Total profit
- $-21,957
- Equity at exit
- $8,430
Cash invested: $27,300 (down + closing). Projections, not guarantees.
Landlord ↔ Tenant lean methodology
- Overall (STATE)
- 86 Strongly Landlord-Friendly
- State Utah
- 86 Strongly Landlord-Friendly · R+15
- County
- — inherits STATE
- City
- — inherits STATE
ZIP-level market 84660
- Home prices YoY
- -34.6%
- Rents YoY
- 3.6%
- Active inventory
- 575
- Price-to-rent
- 4.9×
Monthly cashflow live
- Estimated rent
- $1,647 high interval (Pro) →
- Mortgage (P&I)
- −$511
- Tax est. 1.5%
- −$122 /mo · $1,462/yr
- Insurance
- −$41
- HOA
- −$740
- Vacancy / Maint / Mgmt
- −$346
- Net cashflow
- $-113
Break-even live
Sensitivity live
| Price | -10% $-45 | -5% $-79 | +0% $-113 | +5% $-146 | +10% $-180 |
|---|---|---|---|---|---|
| Rent | -10% $-243 | -5% $-178 | +0% $-113 | +5% $-48 | +10% $17 |
| Rate | -1.0pp $-64 | -0.5pp $-88 | base $-113 | +0.5pp $-138 | +1.0pp $-164 |
UW: 25.0% down · 7.5% · 30yr · 1.5% tax · 5.0% vac · 8.0% maint · 8.0% mgmt
Financing live
Cash to close
- Down payment
- $24,375
- Closing costs
- $2,925
- Reserves months
- —
- Total cash needed
- —
Loan-product check · same deal, 3 products live
Conventional
25% down · 7.5% · 30yr
- Down + closing
- —
- Monthly P&I
- —
- Monthly cashflow
- —
- DSCR
- —
- Eligible?
- —
Personal DTI + credit; lowest rate.
DSCR
20% down · 8.5% · 30yr
- Down + closing
- —
- Monthly P&I
- —
- Monthly cashflow
- —
- DSCR
- —
- Eligible?
- —
No personal income docs; deal must DSCR.
Hard money
10% down · 12.0% · 12mo
- Down + closing
- —
- Monthly P&I
- —
- Monthly cashflow
- —
- DSCR
- —
- Eligible?
- —
Short-term bridge; refi at stabilization.
Rent comps 5 comps
| Address | Beds | Baths | Sqft | Rent | $/sqft | DOM | Units | Dist |
|---|---|---|---|---|---|---|---|---|
| 567 N 880 E #5 Spanish Fork, UT | 3.0 | 1.0 | 1040 | $1,199 | $1.15 | 25d | 1 | 0.26mi |
| 567 N 880 East St Unit 6 Spanish Fork, UT | 3.0 | 1.0 | 1040 | $1,149 | $1.10 | 23d | 1 | 0.26mi |
| 934 E 500 N Spanish Fork, UT | 2.0 | 1.0 | 950 | $1,450 | $1.53 | 16d | 1 | 0.31mi |
| 1295 Spanish Fork, UT | 3.0 | 1.0–2.0 | 944 | $1,859 | $1.97 | 13d | 1 | 0.72mi |
| 636 N Main St Unit B Spanish Fork, UT | 2.0 | 1.0 | 999 | $1,075 | $1.08 | 16d | 1 | 0.93mi |
HOA detail
- Monthly dues
- $740 · $8,880/yr
Listing history 7 events
-
2026-06-22days on market $97,500 Active 9 DOM
-
2026-06-18days on market $97,500 Active 6 DOM
-
2026-06-17days on market $97,500 Active 5 DOM
-
2026-06-16days on market $97,500 Active 4 DOM
-
2026-06-15days on market $97,500 Active 3 DOM
-
2026-06-14remarks 699-char remark
-
2026-06-14$97,500 Active 1 DOM
ⓘ Source: listings_history table (triggers on properties + properties_extension) + one-shot
backfill from property_details.listing_events for pre-trigger history.
Climate risk First Street
- Flood 1/10 Low FEMA zone X (unshaded) · 0% chance over 30 yrs
- Wildfire 4/10 Moderate
- Heat 4/10 Moderate 7 d/yr ≥95°F today · 20 d/yr by 30 yrs out
- Wind 1/10 Low
- Air quality 5/10 Major 8 unhealthy d/yr today · 8 by 30 yrs out
Nearby sold comps map
Loading sold comps map…
Walkable amenities ~0.75 mi
Loading nearby amenities…
Taxation est. · year 1
- Rental income
- $19,762
- − Mortgage interest
- −$5,462
- − Property taxes
- −$1,462
- − Insurance
- −$488
- − Repairs & maintenance
- −$1,581
- − Management
- −$1,581
- − HOA
- −$8,880
- − Depreciation
- −$2,836
- Taxable loss
- −$2,528
- Est. tax savings @ 24.0%
- +$607
- After-tax cash flow
- $-747/yr
For passive investors: Depreciation is non-cash, so a rental often shows a tax loss while cash-flowing — sheltering income. Rental losses are passive: they offset passive income freely, and up to $25,000/yr can offset ordinary (W-2) income if you actively participate and your MAGI is under $100k (phasing out to $0 by $150k); unused losses carry forward. On sale, claimed depreciation is recaptured at up to 25%, and gains may owe capital-gains tax (a 1031 exchange can defer both). Figures are a year-1 estimate at your 24.0% rate — not tax advice; consult a CPA.
Schools (NCES district)
- District
- Nebo District
- NCES district ID
- 4900630
- Math proficiency
- 38% ▼ -5.00%
- Reading proficiency
- 40% ▼ -4.00%
- Median HH income
- $64,067
- Composite
- 35.01/100
- National rank
- #5047
- State rank
- #45 of 80 in UT
Livability — Spanish Fork
- Score
- 83/100
- State rank
- #26
- US rank
- #1012
Category grades
Schools grade is shown separately in the Schools card above.
Census & demographics
- Census place
- Spanish Fork, UT
- County
- Utah County · 661,754 people
- City population
- 48,583
- Metro
- Provo-Orem, UT
- Population (ZIP)
- 48,583
- Household income
- $104,355
- Rent vs Own
- Severe rent burden
- 525.0
Population outlook (Utah County) Hauer SSP2
- Today (2025)
- 693,420 people
- By 2030
- 757,324 · +9.2%
- By 2040
- 893,178 · +28.8%
- By 2050
- 1,035,842 · +49.4%
- By 2075
- 1,376,733 · +98.5%
- By 2100
- 1,609,388 · +132.1%
Race, ethnicity, and origin ACS 2023
- Neighborhood character
- Predominantly White (81%)
- Race & ethnicity
- White 81% Hispanic / Latino 14% Two or more races 8%
- Hispanic origin (detail)
- Mexican 9%
- Common ancestry
- Slovak 4% Italian 4% Iranian 2%
- Foreign-born
- 5% · Canada
- Languages at home
- 88% English-only · Spanish 10% Other Asian/Pacific 1%
Political lean MEDSL · Utah
- 2024 margin
- Solid R (+39.8) · D 28.5% · R 68.3% · Other 3.2%
- 2008→2024 swing
- +19.1pp toward D · 2008: -58.9pp · 2024: -39.8pp
- All cycles
- 2024: R+39.8 2020: R+41.0 2016: R+37.3 2012: R+78.5 2008: R+58.9
Not yet ingested
- Civics
- —
Market trends
- HPI YoY
- ▼ -161.19%
- Current HPI
- 304.4917
- Rent YoY
- ▲ 3.59%
- Metro
- Provo-Orem, UT
- State GDP YoY
- ▲ 3.54%
- F500 in state
- 2
Industry mix (Fortune 500 HQ in UT)
| Industry | F500 HQs | Revenue |
|---|---|---|
| Financial Services | 1 | $3B |
|
||
Price history
+323.9% since first listed16 events — show timeline
- 2026-06-12 Listed $97,500 WFRMLS
- 2026-04-13 Sold (MLS) — WFRMLS
- 2026-03-26 Pending — WFRMLS
- 2026-02-28 Listed $166,000 WFRMLS
- 2026-02-04 Listing Removed — WFRMLS
- 2025-10-17 Price Changed $144,000 WFRMLS
- 2025-08-09 Relisted — WFRMLS
- 2025-08-01 Listing Removed — WFRMLS
- 2025-06-19 Price Changed $149,000 WFRMLS
- 2024-11-09 Listing Removed — WFRMLS
- 2024-10-30 Price Changed $94,900 WFRMLS
- 2024-10-15 Listed $160,000 WFRMLS
- 2024-09-20 Price Changed $99,900 WFRMLS
- 2024-08-16 Listed $109,000 WFRMLS
- 2000-05-31 Listing Removed — WFRMLS
- 2000-05-17 Listed $23,000 WFRMLS
Cash-flow waterfall
monthlySold comps — $/sqft
last 12 mo · ≤1 miLoading sold comps…