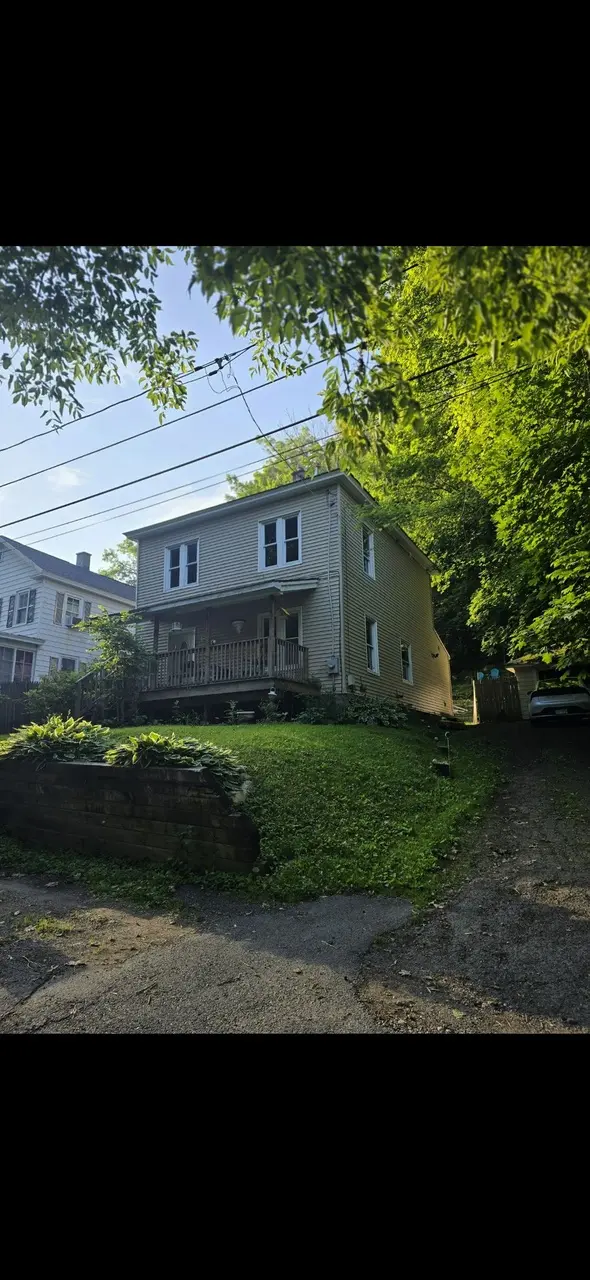
14 Charles St · North Adams, MA
Flood risk 1/10 · Minimal
- FEMA flood zone
- X
- Chance of flooding over 30 yrs
- 0.0%
- Est. flood insurance / yr
- $473 – $860
Fire risk 3/10 · Minor
- Est. fire insurance / yr
- $915 – $1,699
Heat risk 2/10 · Minimal
- Hot days now (above 92°F)
- 9 days/yr
- Hot days in 30 yrs
- 20 days/yr
Wind risk 3/10 · Minor
- Chance of severe wind over 30 yrs
- 7.0%
Air-quality risk 2/10 · Minimal
- Unhealthy air days now
- 0 days/yr
- Unhealthy air days in 30 yrs
- 1 days/yr
Risk factors via First Street. Map © Google.
Why this score? — see what drove the C grade
The composite is a weighted blend of 9 inputs, each scored 0–100. Each bar is that input's sub-score; the figure is the points it added to the 100-point composite (weight × sub-score).
- Cash flow +22.7/30.0
- ARV discount +12.0/15.0
- DSCR +7.3/10.0
- 1% rule +5.6/10.0
- Livability +2.8/5.0
- Rent growth +2.5/5.0
- Condition / age +2.5/5.0
- Appreciation +1.9/10.0
- Schools +1.8/10.0
$194,000
🖨 Deal sheet (PDF) 📄 Offer letter ✓ Due diligence
Listing remarks MLS
Home has some potential to look really great again. In a quiet location and close to downtown North Adams. 3 upstairs bedroom with bath and 1 downstairs bedroom with bath. Large living room space. This could be a really pretty home again - Nice Front Porch
Key facts
- Private driveway
- Cozy backyard
- Ample cabinet space
Tags
Property features AI
Exterior
- Parking: Off-street parking
- Utilities: Public sewer; 200 Amp electric service with circuit breakers
- Construction: Total building area about 1440
- Exterior features: Off-street parking
Interior
- Kitchen: Includes dishwasher, microwave, refrigerator
- Bedrooms: 6 total rooms (includes living spaces and bedrooms)
- Flooring: Laminate flooring
- Bathrooms: 1 full bathroom; 1 half bathroom
- Heating & cooling: Natural gas heating; Pellet stove heating; 200 Amp electric service with circuit breakers
- Interior features: Dishwasher; Microwave; Refrigerator
Neighborhood map
What this means for you Summary
Snapshot
- This is a 3-bed/1.0-bath single-family listed at $194k.
Deal economics
- At list price, monthly cash flow is $334 ($4k/yr) — positive.
- The deal already cash-flows at list — no discount required.
- Meets the 1% rule at list price ($2k rent vs $194k).
- Cap rate 8.4% vs local median 5.9% in North Adams — top-decile yield for the area; either an underpriced asset or a hidden risk that comps aren't pricing in. Stress-test before assuming the spread holds.
Location & tenants
- Location reads 55/100 on livability (#242 in MA) — a working-class tenant base; expect higher turnover. Strengths: housing A+, cost of living A-; Watch: employment C-, health & safety D, crime F.
- North Adams (town): math 14% / reading 29% proficiency, ranked #291 of 302 in MA (top 96%) — low school quality limits family demand, transient renter base, plan for 1-2y turnover.
- Zoned schools: Brayton (math 8% / reading 27%, grade F, #819 of 938 statewide, top 88%, 228 students, 0% FRL); Drury High (math 16% / reading 24%, grade F, #308 of 343 statewide, top 91%, 493 students, 0% FRL) — zoned schools average 0% FRL vs 53% district-wide (53 pts lower); this property's tenant base skews higher-income than the district average.
- Market conditions: 99 active listings in the ZIP; 3 comparable units currently listed for rent nearby; rentals lingering (median 46d on market — plan ~5-8 weeks vacancy on turnover, expect pricing pressure); 67% of comp listings sitting > 30 days — soft ceiling on asking rent; 130 units permitted in Berkshire County in 2024 (10 in 5+ unit buildings).
Forward outlook
- Local home prices are declining (-3.0%/yr); year-one equity from $1k of loan paydown is wiped out by about $6k of value loss. Plan a longer hold.
- Berkshire County population projected at -24% by 2050 — secular population decline; favor cash flow + early exit over multi-decade hold.
Negotiation context
- Only 11 days on market — expect competitive offers; lowballing is unlikely to land.
- 7 sale attempts since 26y ago with the ask held roughly flat each time — persistent listings suggest the price (not the market) is what's stuck; bring a comps-based counter.
- Current owner paid $28k; list at $194k implies a 605% gain — meaningful room to come down on a strong offer.
Risks & watch-outs
- Watch-outs: built in 1920 — expect roof / HVAC / electrical / plumbing capex.
Questions for the listing agent
- Built in 1920 — when were the roof, HVAC, electrical panel, plumbing, and water heater last replaced?
- Is there a deadline driving the sale (1031 exchange, divorce, estate, relocation)? That informs how much negotiation room exists.
- Schools are F-rated, which usually means shorter tenancies and higher turnover. Who's the typical renter profile here, and what's been the actual vacancy rate?
- Crime grade is F in this area — have there been break-ins, vandalism, or insurance claims at this property in the last 3 years? What carrier currently insures it and at what premium?
- What's the average days-on-market for RENTAL listings here right now (not sales)? A rising rental-DOM trend means longer vacancies and softer asking-rent achievability than the comps imply.
- What's the recent tenant-quality profile in this submarket — average credit score on applications, eviction rate, late-payment / NSF rate, and stable-employment percentage? A property-management company in the area should have these aggregated.
- How much new for-sale + rental construction is in the pipeline within 1–3 miles? Heavy new supply typically softens prices + rents 12–24 months out; constrained supply supports both.
Investment metrics
- 1% rule
- 1.06% ✓
- Cap rate
- 8.36%
- Cash-on-cash
- 7.37%
- DSCR
- 1.33
- GRM
- 7.8
CMA / ARV
- ARV (median comp)
- $215,475
- List price
- $194,000
- Delta
- -12.98%
- Verdict
- UNDERPRICED
- Comps
- 20 within 1.0 mi
Show comp detail 12 sales within ~0.75 mi
| Address | Dist | Beds/Ba | Sqft | Sold | Price | $/sf | Match |
|---|---|---|---|---|---|---|---|
| 20 Barlow Ave | 0.23mi | 3/1.0 | 1,356 (-6%) | 6mo | $226,300 | $167 | 74 |
| 454 Main St | 0.23mi | 3/1.0 | 1,327 (-8%) | 4mo | $35,000 | $26 | 73 |
| 64 Notch Rd | 0.45mi | 3/1.5 | 1,465 (+2%) | 3mo | $240,000 | $164 | 72 |
| 19 Fairgrounds Ave | 0.14mi | 4/2.5 (+1) | 1,540 (+7%) | 1mo | $330,000 | $214 | 70 |
| 51 Notch Rd | 0.48mi | 3/2.0 | 1,463 (+2%) | 3mo | $295,500 | $202 | 69 |
| 8 Duggan St | 0.40mi | 3/2.0 | 1,548 (+8%) | 1mo | $204,000 | $132 | 64 |
| 55 First St | 0.36mi | 2/1.0 (-1) | 1,532 (+6%) | 6mo | $227,500 | $148 | 62 |
| 69 Harris St | 0.53mi | 3/1.0 | 1,531 (+6%) | 16mo | $230,000 | $150 | 52 |
| 68 Furnace St | 0.56mi | 2/1.5 (-1) | 1,500 (+4%) | 12mo | $145,000 | $97 | 50 |
| 84 Notch Rd | 0.49mi | 3/1.0 | 1,310 (-9%) | 16mo | $210,000 | $160 | 48 |
| 85 Furnace St | 0.54mi | 3/1.0 | 1,236 (-14%) | 4mo | $207,000 | $167 | 48 |
| 4 Lamoureaux Pl | 0.46mi | 3/2.0 | 1,272 (-12%) | 16mo | $180,000 | $142 | 42 |
Match score weights: distance 35% · size 25% · config 20% · recency 20%. Top-matched comps best support the ARV.
Projected returns pro-forma
-3.0% appreciation · 3.0% rent growth · sell at horizon
- IRR
- -5.0%
- Equity multiple
- 0.81×
- Total profit
- $-10,184
- Equity at exit
- $28,926
- IRR
- 4.6%
- Equity multiple
- 1.34×
- Total profit
- $18,510
- Equity at exit
- $16,774
Cash invested: $54,320 (down + closing). Projections, not guarantees.
Landlord ↔ Tenant lean methodology
- Overall (STATE)
- 20 Strongly Tenant-Friendly
- State Massachusetts
- 20 Strongly Tenant-Friendly · D+15
- County
- — inherits STATE
- City
- — inherits STATE
ZIP-level market 01247
- Home prices YoY
- -2.0%
- Active inventory
- 99
- Price-to-rent
- 7.8×
Monthly cashflow live
- Estimated rent
- $2,064 medium interval (Pro) →
- Mortgage (P&I)
- −$1,017
- Tax from tax record
- −$199 /mo · $2,384/yr
- Insurance
- −$81
- HOA
- −$0
- Vacancy / Maint / Mgmt
- −$433
- Net cashflow
- $334
Break-even live
Sensitivity live
| Price | -10% $443 | -5% $389 | +0% $334 | +5% $279 | +10% $224 |
|---|---|---|---|---|---|
| Rent | -10% $171 | -5% $252 | +0% $334 | +5% $415 | +10% $497 |
| Rate | -1.0pp $431 | -0.5pp $383 | base $334 | +0.5pp $283 | +1.0pp $232 |
UW: 25.0% down · 7.5% · 30yr · 1.5% tax · 5.0% vac · 8.0% maint · 8.0% mgmt
Financing live
Cash to close
- Down payment
- $48,500
- Closing costs
- $5,820
- Reserves months
- —
- Total cash needed
- —
Loan-product check · same deal, 3 products live
Conventional
25% down · 7.5% · 30yr
- Down + closing
- —
- Monthly P&I
- —
- Monthly cashflow
- —
- DSCR
- —
- Eligible?
- —
Personal DTI + credit; lowest rate.
DSCR
20% down · 8.5% · 30yr
- Down + closing
- —
- Monthly P&I
- —
- Monthly cashflow
- —
- DSCR
- —
- Eligible?
- —
No personal income docs; deal must DSCR.
Hard money
10% down · 12.0% · 12mo
- Down + closing
- —
- Monthly P&I
- —
- Monthly cashflow
- —
- DSCR
- —
- Eligible?
- —
Short-term bridge; refi at stabilization.
Rent comps 3 comps
| Address | Beds | Baths | Sqft | Rent | $/sqft | DOM | Units | Dist |
|---|---|---|---|---|---|---|---|---|
| 14 Tyler St North Adams, MA | 2.0 | 1.0 | 1174 | $1,975 | $1.68 | 46d | 1 | 0.42mi |
| 40 Cady St North Adams, MA | 3.0 | 1.5 | 1467 | $2,475 | $1.69 | 46d | 1 | 0.58mi |
| 210 Eagle St Unit 1 North Adams, MA | 2.0 | 1.0 | 1040 | $1,300 | $1.25 | 16d | 1 | 1.06mi |
Listing history 18 events
-
2026-06-18statusdays on market $194,000 Pending 11 DOM
-
2026-06-17days on market $194,000 Active 10 DOM
-
2026-06-16days on market $194,000 Active 9 DOM
-
2026-06-15days on market $194,000 Active 8 DOM
-
2026-06-13days on market $194,000 Active 6 DOM
-
2026-06-12pricestatusdays on market $194,000 Active 5 DOM
-
2026-01-07$187,500 Active 434-char remark
-
2019-04-02soldstatus $27,500 260-char remark
Show marketing remark (260 chars)
Home has some potential to look really great again. In a quiet location and close to downtown North Adams. 3 upstairs bedroom with bath and 1 downstairs bedroom with bath. Large living room space. This could be a really pretty home again - Nice Front Porch
-
2019-02-11$39,000 260-char remark
Show marketing remark (260 chars)
Home has some potential to look really great again. In a quiet location and close to downtown North Adams. 3 upstairs bedroom with bath and 1 downstairs bedroom with bath. Large living room space. This could be a really pretty home again - Nice Front Porch
-
2009-06-18soldstatus $90,000
Show marketing remark (164 chars)
This home has a new 200 amp electric service, new heating system, new kitchen and baths. Seller is currentlly siding the house and finishing up finish work inside.
-
2009-03-17$95,000
Show marketing remark (164 chars)
This home has a new 200 amp electric service, new heating system, new kitchen and baths. Seller is currentlly siding the house and finishing up finish work inside.
-
2008-04-25historical
-
2007-10-25$99,900
-
2006-09-19soldstatus $42,600
-
2006-06-16$48,900
-
2000-05-05soldstatus $66,500
-
2000-05-05soldstatus $66,500
-
2000-02-24$66,914
ⓘ Source: listings_history table (triggers on properties + properties_extension) + one-shot
backfill from property_details.listing_events for pre-trigger history.
Tax reassessment forecast MA · Partial reset (capped growth)
- Current annual tax
- $2,384 · $199/mo
- Projected year-2 tax
- $2,385 · $199/mo
- Expected delta
- +$1/yr ($0/mo · 0.0%)
ⓘ Screening estimate from a state-policy table — verify with the county assessor before closing.
Climate risk First Street
- Flood 1/10 Low FEMA zone X · 0% chance over 30 yrs
- Wildfire 3/10 Moderate
- Heat 2/10 Low 9 d/yr ≥92°F today · 20 d/yr by 30 yrs out
- Wind 3/10 Moderate 7% chance of damaging wind over 30 yrs
- Air quality 2/10 Low 0 unhealthy d/yr today · 1 by 30 yrs out
Nearby sold comps map
Loading sold comps map…
Walkable amenities ~0.75 mi
Loading nearby amenities…
Taxation est. · year 1
- Rental income
- $24,767
- − Mortgage interest
- −$10,867
- − Property taxes
- −$2,384
- − Insurance
- −$970
- − Repairs & maintenance
- −$1,981
- − Management
- −$1,981
- − Depreciation
- −$5,644
- Taxable income
- $939
- Est. tax owed @ 24.0%
- −$225
- After-tax cash flow
- $3,778/yr
For passive investors: Depreciation is non-cash, so a rental often shows a tax loss while cash-flowing — sheltering income. Rental losses are passive: they offset passive income freely, and up to $25,000/yr can offset ordinary (W-2) income if you actively participate and your MAGI is under $100k (phasing out to $0 by $150k); unused losses carry forward. On sale, claimed depreciation is recaptured at up to 25%, and gains may owe capital-gains tax (a 1031 exchange can defer both). Figures are a year-1 estimate at your 24.0% rate — not tax advice; consult a CPA.
Schools (NCES district)
- District
- North Adams
- NCES district ID
- 2508670
- Math proficiency
- 14% ▼ -13.00%
- Reading proficiency
- 29% ▼ -11.00%
- Median HH income
- $36,746
- Composite
- 17.83/100
- National rank
- #9006
- State rank
- #291 of 302 in MA
Livability — North Adams
- Score
- 55/100
- State rank
- #242
- US rank
- #23506
Category grades
Schools grade is shown separately in the Schools card above.
Census & demographics
- Census place
- North Adams, MA
- City population
- 14,967
- Population (ZIP)
- 14,967
Population outlook (Berkshire County) Hauer SSP2
- Today (2025)
- 119,723 people
- By 2030
- 114,608 · -4.3%
- By 2040
- 102,806 · -14.1%
- By 2050
- 91,305 · -23.7%
- By 2075
- 71,517 · -40.3%
- By 2100
- 57,988 · -51.6%
Race, ethnicity, and origin ACS 2023
- Neighborhood character
- Predominantly White (88%)
- Race & ethnicity
- White 88% Hispanic / Latino 5% Two or more races 4% Asian 3%
- Hispanic origin (detail)
- Puerto Rican 1%
- Common ancestry
- Lithuanian 15% Romanian 4% German 2%
- Foreign-born
- 5% · Canada
- Languages at home
- 95% English-only · Other Indo-European 2% Spanish 2% French/Haitian/Cajun 0%
Political lean MEDSL · Berkshire
- 2024 margin
- Solid D (+39.9) · D 68.9% · R 29.0% · Other 2.1%
- 2008→2024 swing
- -12.5pp toward R · 2008: 52.4pp · 2024: 39.9pp
- All cycles
- 2024: D+39.9 2020: D+47.1 2016: D+41.5 2012: D+53.7 2008: D+52.4
Not yet ingested
- Civics
- —
Market trends
- HPI YoY
- ▼ -6.22%
- Current HPI
- 298.8949
- Rent YoY
- —
- Metro
- —
- State GDP YoY
- ▲ 2.28%
- F500 in state
- 38
Industry mix (Fortune 500 HQ in MA)
| Industry | F500 HQs | Revenue |
|---|---|---|
| Technology | 3 | $17B |
|
||
| Insurance | 2 | $84B |
|
||
| Retail | 2 | $76B |
|
||
| Life Sciences | 1 | $43B |
|
||
| Energy Technology | 1 | $31B |
|
||
| Aerospace / Defense | 1 | $18B |
|
||
Price history
+189.9% since first listed16 events — show timeline
- 2026-06-18 Pending — BCMLS
- 2026-06-11 Relisted — BCMLS
- 2026-06-10 Price Changed $194,000 BCMLS
- 2026-05-29 Pending — BCMLS
- 2026-05-21 Listed $199,900 BCMLS
- 2019-04-02 Sold (MLS) $27,500 BCMLS
- 2019-02-11 Listed $39,000 BCMLS
- 2009-06-18 Sold (MLS) $90,000 BCMLS
- 2009-03-17 Listed $95,000 BCMLS
- 2008-04-25 Listing Removed — BCMLS
- 2007-10-25 Listed $99,900 BCMLS
- 2006-09-19 Sold (MLS) $42,600 MLS PIN
- 2006-06-16 Listed $48,900 MLS PIN
- 2000-05-05 Sold (Public Records) $66,500 Public Records
- 2000-05-05 Sold (MLS) $66,500 BCMLS
- 2000-02-24 Listed $66,914 BCMLS
Property tax history
+12.9%/yrLatest (2023): $2,384 · +11.5% YoY. Source: county tax records.
Cash-flow waterfall
monthlySold comps — $/sqft
last 12 mo · ≤1 miLoading sold comps…