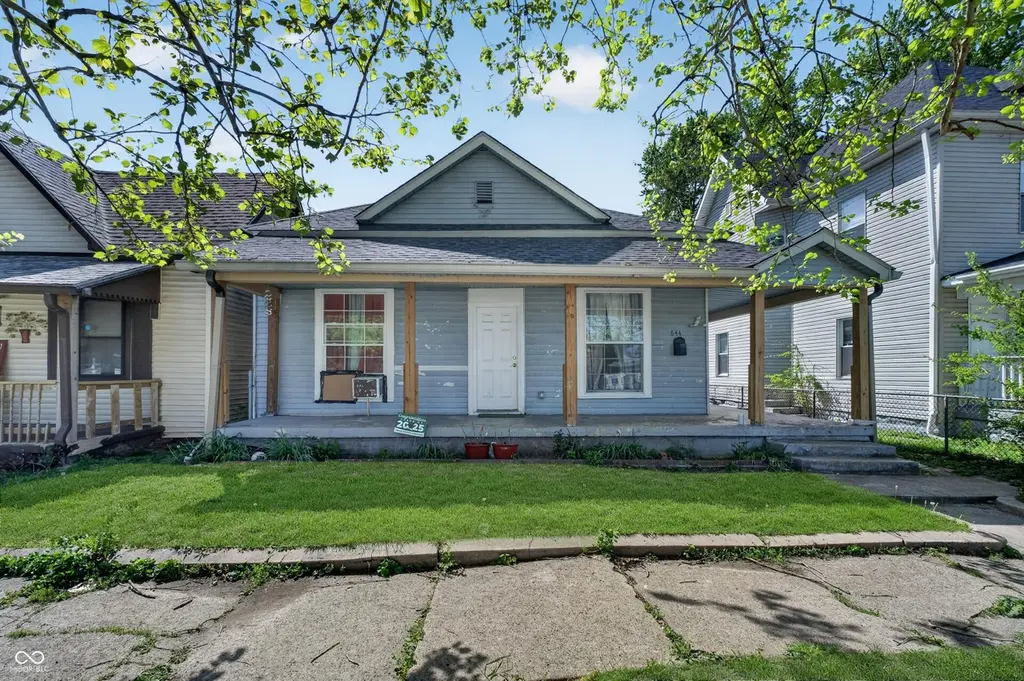
644 Marion Ave · Indianapolis city (balance), IN
Flood risk 4/10 · Minor
- FEMA flood zone
- X
- Chance of flooding over 30 yrs
- 0.24%
- Est. flood insurance / yr
- $473 – $860
Fire risk 1/10 · Minimal
- Est. fire insurance / yr
- $717 – $1,331
Heat risk 4/10 · Minor
- Hot days now (above 101°F)
- 7 days/yr
- Hot days in 30 yrs
- 19 days/yr
Wind risk 2/10 · Minimal
- Chance of severe wind over 30 yrs
- 0.0%
Air-quality risk 4/10 · Minor
- Unhealthy air days now
- 5 days/yr
- Unhealthy air days in 30 yrs
- 7 days/yr
Risk factors via First Street. Map © Google.
Why this score? — see what drove the C grade
The composite is a weighted blend of 9 inputs, each scored 0–100. Each bar is that input's sub-score; the figure is the points it added to the 100-point composite (weight × sub-score).
- Cash flow +30.0/30.0
- 1% rule +10.0/10.0
- DSCR +10.0/10.0
- Rent growth +2.9/5.0
- Livability +2.5/5.0
- Condition / age +2.5/5.0
- Schools +1.4/10.0
- ARV discount +0.0/15.0
- Appreciation +0.0/10.0
$195,000
🖨 Deal sheet 📄 Offer letter ✓ Due diligence
Listing remarks MLS
Welcome home to this completely remodeled move in ready gem! This spacious updated home includes 3 bedrooms plus one bonus room in the attic, two full luxuriously updated bathrooms, nice open concept, fully fenced back yard and a two car garage! Conveniently located minutes to i70, from Indy's down town and all it has to offer!
Key facts
- Updated kitchen
- Finished garage
- Versatile bonus room
Tags
Property features AI
Exterior
- Parking: Detached 2-car garage
- Security: Smoke detector(s)
- Utilities: Community sewer; Private water source; 200+ amp electric service; Cable available and connected; Sewer and water connected
- Home design: Single family residence; Residential property; One- and two-level layout; Faces north
- Construction: Vinyl siding; Block foundation
- Exterior features: Covered, wrap-around porch; Mature trees; Curbs and street lights; Other exterior features
Interior
- Kitchen: Dishwasher; Electric oven; Microwave (with hood); Garbage disposal; Refrigerator
- Bedrooms: Primary bedroom with walk-in closet; Three bedrooms on the main level
- Bathrooms: Two full bathrooms; Primary bathroom with tub and shower
- Heating & cooling: Forced air heating; Central air conditioning
- Interior features: High ceilings; Kitchen island; Eat-in kitchen; Pantry; Walk-in closet(s); Breakfast bar; Laundry in unit; Updated/remodeled condition; Smoke alarm(s)
- Laundry & utility: Washer; Dryer; Upper-level laundry room
Neighborhood map
What this means for you Summary
Snapshot
- This is a 3-bed/2.0-bath single-family listed at $195k.
Deal economics
- At list price, monthly cash flow is $1k ($16k/yr) — positive.
- The deal already cash-flows at list — no discount required.
- Meets the 1% rule at list price ($4k rent vs $195k).
- Recommended offer: $189k (3.0% below list) — sets the bar for market timing.
- Cap rate 14.7% vs local median 4.4% in Indianapolis city (balance) — top-decile yield for the area; either an underpriced asset or a hidden risk that comps aren't pricing in. Stress-test before assuming the spread holds.
Location & tenants
- Location reads: area grade C — affects rentability + tenant quality, not the cash-flow math above.
- Indianapolis Public Schools (urban): math 14% / reading 20% proficiency, ranked #286 of 301 in IN (top 95%) — low school quality limits family demand, transient renter base, plan for 1-2y turnover; 77% free/reduced lunch — lower-income household profile, screen leases tightly.
- Market conditions: Rents rising (+1.8%/yr); 43 active listings in the ZIP; 4 comparable units currently listed for rent nearby; rentals at typical pace (median 24d on market — plan ~3-4 weeks tenant-placement turnaround); 1,906 units permitted in Marion County in 2024 (621 in 5+ unit buildings).
- At $3,539/mo this rent would consume 65% of the median local household income ($65k/yr) (locally 1011% of renters already pay >50% of income on rent) — very limited rent-growth headroom before tenants either downsize or default.
Forward outlook
- Local home prices are declining (-3.0%/yr); year-one equity from $1k of loan paydown is wiped out by about $6k of value loss. Plan a longer hold.
- Marion County population projected at +18% by 2050 — long-run rental-demand tailwind backs the buy-and-hold thesis.
- At projected returns (-3.0% appreciation + 1.8% rent growth), your $55k cash investment doubles in ~5 years — after that, you're playing with house money.
Negotiation context
- It's been on market 44 days — a 3% lower offer ($189k) is reasonable based on typical stale-listing flexibility.
- 4 sale attempts since 20y ago; this cycle's ask has dropped $15k (7%) from the opening price — seller is motivated, your offer sets the floor, not the list.
- Current owner paid $130k; list at $195k implies a 50% gain — meaningful room to come down on a strong offer.
Risks & watch-outs
- Watch-outs: built in 1900 — expect roof / HVAC / electrical / plumbing capex.
Questions for the listing agent
- It's been on market 44 days. Have you received any prior offers? Is the seller open to a 3% concession, seller financing, or rate buy-down credit?
- Built in 1900 — when were the roof, HVAC, electrical panel, plumbing, and water heater last replaced?
- Is there a deadline driving the sale (1031 exchange, divorce, estate, relocation)? That informs how much negotiation room exists.
- What's the average days-on-market for RENTAL listings here right now (not sales)? A rising rental-DOM trend means longer vacancies and softer asking-rent achievability than the comps imply.
- What's the recent tenant-quality profile in this submarket — average credit score on applications, eviction rate, late-payment / NSF rate, and stable-employment percentage? A property-management company in the area should have these aggregated.
- How much new for-sale + rental construction is in the pipeline within 1–3 miles? Heavy new supply typically softens prices + rents 12–24 months out; constrained supply supports both.
Investment metrics
- 1% rule
- 1.81% ✓
- Cap rate
- 14.66%
- Cash-on-cash
- 29.90%
- DSCR
- 2.33
- GRM
- 4.6
CMA / ARV
- ARV (median comp)
- $142,834
- List price
- $195,000
- Delta
- 36.52%
- Verdict
- OVERPRICED
- Comps
- 20 within 1.0 mi
Show comp detail 3 sales within ~0.75 mi
| Address | Dist | Beds/Ba | Sqft | Sold | Price | $/sf | Match |
|---|---|---|---|---|---|---|---|
| 642 Division St | 0.14mi | 3/2.0 | 2,864 (+3%) | 8mo | $220,000 | $77 | 82 |
| 1321 W Oliver Ave | 0.17mi | 4/2.0 (+1) | 2,905 (+4%) | 23mo | $155,500 | $54 | 61 |
| 1750 W Morris St | 0.72mi | 4/2.0 (+1) | 2,376 (-14%) | 5mo | $24,900 | $10 | 33 |
Match score weights: distance 35% · size 25% · config 20% · recency 20%. Top-matched comps best support the ARV.
Projected returns pro-forma
-3.0% appreciation · 1.79% rent growth · sell at horizon
- IRR
- 23.1%
- Equity multiple
- 1.93×
- Total profit
- $50,898
- Equity at exit
- $29,075
- IRR
- 30.2%
- Equity multiple
- 3.55×
- Total profit
- $139,278
- Equity at exit
- $16,860
Cash invested: $54,600 (down + closing). Projections, not guarantees.
Landlord ↔ Tenant lean methodology
- Overall (STATE)
- 90 Strongly Landlord-Friendly
- State Indiana
- 90 Strongly Landlord-Friendly · R+11
- County
- — inherits STATE
- City
- — inherits STATE
ZIP-level market 46221
- Home prices YoY
- -23.7%
- Rents YoY
- 1.8%
- Active inventory
- 43
- Price-to-rent
- 4.6×
Monthly cashflow live
- Estimated rent
- $3,539 medium interval (Pro) →
- Mortgage (P&I)
- −$1,023
- Tax from tax record
- −$331 /mo · $3,976/yr
- Insurance
- −$81
- HOA
- −$0
- Vacancy / Maint / Mgmt
- −$743
- Net cashflow
- $1,360
Break-even live
UW: 25.0% down · 7.5% · 30yr · 1.5% tax · 5.0% vac · 8.0% maint · 8.0% mgmt
Financing live
Cash to close
- Down payment
- $48,750
- Closing costs
- $5,850
- Reserves months
- —
- Total cash needed
- —
Loan-product check · same deal, 3 products live
Conventional
25% down · 7.5% · 30yr
- Down + closing
- —
- Monthly P&I
- —
- Monthly cashflow
- —
- DSCR
- —
- Eligible?
- —
Personal DTI + credit; lowest rate.
DSCR
20% down · 8.5% · 30yr
- Down + closing
- —
- Monthly P&I
- —
- Monthly cashflow
- —
- DSCR
- —
- Eligible?
- —
No personal income docs; deal must DSCR.
Hard money
10% down · 12.0% · 12mo
- Down + closing
- —
- Monthly P&I
- —
- Monthly cashflow
- —
- DSCR
- —
- Eligible?
- —
Short-term bridge; refi at stabilization.
Rent comps 4 comps
| Address | Beds | Baths | Sqft | Rent | $/sqft | DOM | Units | Dist |
|---|---|---|---|---|---|---|---|---|
| 1551 W New York St Indianapolis, IN | 3.0 | 2.0 | 2619 | $1,600 | $0.61 | 7d | 1 | 1.09mi |
| 818 Union St Indianapolis, IN | 4.0 | 4.0 | 2624 | $3,900 | $1.49 | 23d | 1 | 1.24mi |
| 822 Union St Indianapolis, IN | 3.0 | 3.0 | 2384 | $3,700 | $1.55 | 23d | 1 | 1.24mi |
| 50 N Illinois St Unit 1534468P Indianapolis, IN | 1.0–5.0 | 1.5–4.0 | 1770 | $5,395 | $3.05 | 1d | 3 | 1.35mi |
Listing history 28 events
-
2026-06-18days on market $195,000 Active 44 DOM
-
2026-06-17days on market $195,000 Active 43 DOM
-
2026-06-16days on market $195,000 Active 42 DOM
-
2026-06-15price $195,000 Active 41 DOM
-
2026-06-15days on market $200,000 Active 41 DOM
-
2026-06-13days on market $200,000 Active 39 DOM
-
2026-06-13days on market $200,000 Active 38 DOM
-
2026-06-09days on market $200,000 Active 35 DOM
-
2026-06-08days on market $200,000 Active 34 DOM
-
2026-06-07days on market $200,000 Active 33 DOM
-
2026-06-03days on market $200,000 Active 29 DOM
-
2026-06-02days on market $200,000 Active 28 DOM
-
2026-06-01days on market $200,000 Active 27 DOM
-
2026-05-31days on market $200,000 Active 26 DOM
-
2026-05-13price $200,000 580-char remark
-
2026-05-04$210,000 Active 580-char remark
-
2020-10-02soldstatus $130,000 Sold 329-char remark
Show marketing remark (329 chars)
Welcome home to this completely remodeled move in ready gem! This spacious updated home includes 3 bedrooms plus one bonus room in the attic, two full luxuriously updated bathrooms, nice open concept, fully fenced back yard and a two car garage! Conveniently located minutes to i70, from Indy's down town and all it has to offer!
-
2020-09-20status Pending 329-char remark
Show marketing remark (329 chars)
Welcome home to this completely remodeled move in ready gem! This spacious updated home includes 3 bedrooms plus one bonus room in the attic, two full luxuriously updated bathrooms, nice open concept, fully fenced back yard and a two car garage! Conveniently located minutes to i70, from Indy's down town and all it has to offer!
-
2020-09-14historical 329-char remark
Show marketing remark (329 chars)
Welcome home to this completely remodeled move in ready gem! This spacious updated home includes 3 bedrooms plus one bonus room in the attic, two full luxuriously updated bathrooms, nice open concept, fully fenced back yard and a two car garage! Conveniently located minutes to i70, from Indy's down town and all it has to offer!
-
2020-08-21status Pending 329-char remark
Show marketing remark (329 chars)
Welcome home to this completely remodeled move in ready gem! This spacious updated home includes 3 bedrooms plus one bonus room in the attic, two full luxuriously updated bathrooms, nice open concept, fully fenced back yard and a two car garage! Conveniently located minutes to i70, from Indy's down town and all it has to offer!
-
2020-08-18status Pending 329-char remark
Show marketing remark (329 chars)
Welcome home to this completely remodeled move in ready gem! This spacious updated home includes 3 bedrooms plus one bonus room in the attic, two full luxuriously updated bathrooms, nice open concept, fully fenced back yard and a two car garage! Conveniently located minutes to i70, from Indy's down town and all it has to offer!
-
2020-08-13$130,000 Active 329-char remark
Show marketing remark (329 chars)
Welcome home to this completely remodeled move in ready gem! This spacious updated home includes 3 bedrooms plus one bonus room in the attic, two full luxuriously updated bathrooms, nice open concept, fully fenced back yard and a two car garage! Conveniently located minutes to i70, from Indy's down town and all it has to offer!
-
2019-09-18soldstatus $45,000 Sold
Show marketing remark (273 chars)
Large 3-4 bedroom home with excellent location close to downtown. The home is located within 2 blocks of the Biltwell Event Center and within 2 miles of Lucas Oil Stadium and the Indianapolis Zoo. This area is up and coming and the home will make an excellent investment.
-
2019-09-05status Pending
Show marketing remark (273 chars)
Large 3-4 bedroom home with excellent location close to downtown. The home is located within 2 blocks of the Biltwell Event Center and within 2 miles of Lucas Oil Stadium and the Indianapolis Zoo. This area is up and coming and the home will make an excellent investment.
-
2019-08-18$44,900 Active
Show marketing remark (273 chars)
Large 3-4 bedroom home with excellent location close to downtown. The home is located within 2 blocks of the Biltwell Event Center and within 2 miles of Lucas Oil Stadium and the Indianapolis Zoo. This area is up and coming and the home will make an excellent investment.
-
2006-12-29soldstatus $16,200
-
2006-08-17$19,900
-
2001-06-18soldstatus $48,013
ⓘ Source: listings_history table (triggers on properties + properties_extension) + one-shot
backfill from property_details.listing_events for pre-trigger history.
Tax reassessment forecast IN · Partial reset (capped growth)
- Current annual tax
- $3,976 · $331/mo
- Projected year-2 tax
- $3,976 · $331/mo
- Expected delta
- $0/yr ($0/mo · 0.0%)
ⓘ Screening estimate from a state-policy table — verify with the county assessor before closing.
Climate risk First Street
- Flood 4/10 Moderate FEMA zone X · 24% chance over 30 yrs
- Wildfire 1/10 Low
- Heat 4/10 Moderate 7 d/yr ≥101°F today · 19 d/yr by 30 yrs out
- Wind 2/10 Low 0% chance of damaging wind over 30 yrs
- Air quality 4/10 Moderate 5 unhealthy d/yr today · 7 by 30 yrs out
Nearby sold comps map
Loading sold comps map…
Walkable amenities ~0.75 mi
Loading nearby amenities…
Taxation est. · year 1
- Rental income
- $42,464
- − Mortgage interest
- −$10,923
- − Property taxes
- −$3,976
- − Insurance
- −$975
- − Repairs & maintenance
- −$3,397
- − Management
- −$3,397
- − Depreciation
- −$5,673
- Taxable income
- $14,124
- Est. tax owed @ 24.0%
- −$3,390
- After-tax cash flow
- $12,935/yr
For passive investors: Depreciation is non-cash, so a rental often shows a tax loss while cash-flowing — sheltering income. Rental losses are passive: they offset passive income freely, and up to $25,000/yr can offset ordinary (W-2) income if you actively participate and your MAGI is under $100k (phasing out to $0 by $150k); unused losses carry forward. On sale, claimed depreciation is recaptured at up to 25%, and gains may owe capital-gains tax (a 1031 exchange can defer both). Figures are a year-1 estimate at your 24.0% rate — not tax advice; consult a CPA.
Schools (NCES district)
- District
- Indianapolis Public Schools
- NCES district ID
- 1804770
- Math proficiency
- 14% ▼ -7.00%
- Reading proficiency
- 20% ▼ -3.00%
- Median HH income
- $32,034
- Composite
- 13.69/100
- National rank
- #9499
- State rank
- #286 of 301 in IN
Livability — Indianapolis city (balance)
No livability data for this city. (Only ~50 U.S. cities are tracked.)
Census & demographics
- Census place
- Indianapolis city (balance), IN
- County
- Marion County · 998,460 people
- City population
- 881,119
- Metro
- Indianapolis-Carmel-Anderson, IN
- Population (ZIP)
- 27,027
- Household income
- $65,280
- Rent vs Own
- Severe rent burden
- 1011.0
Population outlook (Marion County) Hauer SSP2
- Today (2025)
- 1,025,572 people
- By 2030
- 1,065,727 · +3.9%
- By 2040
- 1,141,577 · +11.3%
- By 2050
- 1,208,920 · +17.9%
- By 2075
- 1,367,288 · +33.3%
- By 2100
- 1,438,201 · +40.2%
Race, ethnicity, and origin ACS 2023
- Neighborhood character
- Predominantly White (69%)
- Race & ethnicity
- White 69% Black 13% Hispanic / Latino 13% Two or more races 7%
- Hispanic origin (detail)
- Mexican 7%
- Common ancestry
- Italian 2% Iranian 2% Lithuanian 2%
- Foreign-born
- 9% · Canada, China
- Languages at home
- 87% English-only · Spanish 9% Arabic 1%
Political lean MEDSL · Marion
- 2024 margin
- Strong D (+27.7) · D 63.0% · R 35.3% · Other 1.7%
- 2008→2024 swing
- -0.7pp no change · 2008: 28.4pp · 2024: 27.7pp
- All cycles
- 2024: D+27.7 2020: D+29.1 2016: D+22.8 2012: D+22.2 2008: D+28.4
Not yet ingested
- Civics
- —
Market trends
- HPI YoY
- ▼ -97.56%
- Current HPI
- 313.4711
- Rent YoY
- ▲ 1.79%
- Metro
- Indianapolis-Carmel-Anderson, IN
- State GDP YoY
- ▲ 2.90%
- F500 in state
- 18
Industry mix (Fortune 500 HQ in IN)
| Industry | F500 HQs | Revenue |
|---|---|---|
| Industrial Machinery | 2 | $37B |
|
||
| Healthcare | 1 | $177B |
|
||
| Pharmaceuticals | 1 | $45B |
|
||
| Metals / Steel | 1 | $18B |
|
||
| Agriculture | 1 | $17B |
|
||
| Packaging | 1 | $12B |
|
||
Price history
+306.1% since first listed15 events — show timeline
- 2026-06-15 Price Changed $195,000 MIBOR as Distributed by MLS Grid
- 2026-05-13 Price Changed $200,000 MIBOR as Distributed by MLS Grid
- 2026-05-04 Listed $210,000 MIBOR as Distributed by MLS Grid
- 2020-10-02 Sold (MLS) $130,000 MIBOR as Distributed by MLS Grid
- 2020-09-20 Pending — MIBOR as Distributed by MLS Grid
- 2020-09-14 Listing Removed — MIBOR as Distributed by MLS Grid
- 2020-08-21 Pending — MIBOR as Distributed by MLS Grid
- 2020-08-18 Pending — MIBOR as Distributed by MLS Grid
- 2020-08-13 Listed $130,000 MIBOR as Distributed by MLS Grid
- 2019-09-18 Sold (MLS) $45,000 MIBOR as Distributed by MLS Grid
- 2019-09-05 Pending — MIBOR as Distributed by MLS Grid
- 2019-08-18 Listed $44,900 MIBOR as Distributed by MLS Grid
- 2006-12-29 Sold (MLS) $16,200 MIBOR as Distributed by MLS Grid
- 2006-08-17 Listed $19,900 MIBOR as Distributed by MLS Grid
- 2001-06-18 Sold (Public Records) $48,013 Public Records
Property tax history
+14.9%/yrLatest (2025): $3,976 · +13.7% YoY. Source: county tax records.
Cash-flow waterfall
monthlySold comps — $/sqft
last 12 mo · ≤1 miLoading sold comps…