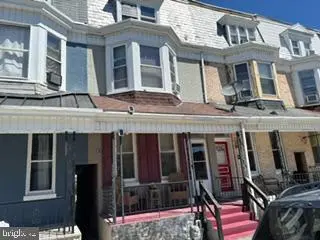
907 W Poplar St · York, PA
Flood risk 1/10 · Minimal
- FEMA flood zone
- X (unshaded)
- Chance of flooding over 30 yrs
- 0.0%
- Est. flood insurance / yr
- $473 – $860
Fire risk 1/10 · Minimal
- Est. fire insurance / yr
- $511 – $949
Heat risk 6/10 · Moderate
- Hot days now (above 103°F)
- 7 days/yr
- Hot days in 30 yrs
- 16 days/yr
Wind risk 4/10 · Minor
- Chance of severe wind over 30 yrs
- 10.0%
Air-quality risk 3/10 · Minor
- Unhealthy air days now
- 3 days/yr
- Unhealthy air days in 30 yrs
- 5 days/yr
Risk factors via First Street. Map © Google.
Why this score? — see what drove the B- grade
The composite is a weighted blend of 9 inputs, each scored 0–100. Each bar is that input's sub-score; the figure is the points it added to the 100-point composite (weight × sub-score).
- Cash flow +26.3/30.0
- ARV discount +13.6/15.0
- DSCR +8.9/10.0
- 1% rule +7.2/10.0
- Livability +3.8/5.0
- Rent growth +3.6/5.0
- Condition / age +2.5/5.0
- Schools +0.8/10.0
- Appreciation +0.0/10.0
$135,000
🖨 Deal sheet (PDF) 📄 Offer letter ✓ Due diligence
Listing remarks MLS
THIS IS AN EXCELLENT OPPORTUNITY FOR A 1ST TIME BUYER OR AN INVESTOR. THIS HOME NEEDS ONLY A LITTLE TLC & IT'S READY TO MOVE IN. |
Key facts
- Parking
- Built 1900
- Listed 6 days
Property features AI
Exterior
- Parking: One off-street parking space accessed via alley; Crushed stone parking surface; Total of one garage/parking space
- Utilities: Public water; Public sewer; Natural gas available; Electric available (100 amp service); Cable internet/TV available; Natural gas hot water
- Home design: Interior townhouse/rowhouse; Average condition; Fee simple ownership
- Construction: Brick construction; Stone foundation; Above- and below-grade structures
- Exterior features: Not in a federal flood zone; Municipal trash service; Pets allowed with no restrictions; Ground rent paid annually
Interior
- Kitchen: Kitchen (appliances not specified)
- Bedrooms: Two bedrooms on the first upper level; Two bedrooms on the second upper level
- Flooring: Vinyl flooring; Carpet flooring
- Bathrooms: One full bathroom
- Heating & cooling: Hot water heating (natural gas); Window cooling units (electric)
- Interior features: Finished above-grade living area per assessor; Basement with sump pump, unfinished
- Laundry & utility: Upper-floor laundry; Has laundry
Neighborhood map
What this means for you Summary
Snapshot
- This is a 5-bed/1.0-bath townhouse listed at $135k.
Deal economics
- At list price, monthly cash flow is $348 ($4k/yr) — positive.
- The deal already cash-flows at list — no discount required.
- Meets the 1% rule at list price ($2k rent vs $135k).
- Cap rate 9.4% vs local median 5.9% in York — top-decile yield for the area; either an underpriced asset or a hidden risk that comps aren't pricing in. Stress-test before assuming the spread holds.
Location & tenants
- Location reads 75/100 on livability (#427 in PA, #3,987 nationally) — a middle-class / working-renter tenant base. Strengths: cost of living A+, health & safety A+, housing A; Watch: amenities D+, crime F, employment F.
- York City SD (urban): math 4% / reading 16% proficiency, ranked #534 of 539 in PA (top 99%) — low school quality limits family demand, transient renter base, plan for 1-2y turnover; 72% free/reduced lunch — lower-income household profile, screen leases tightly.
- Zoned schools: Ferguson Sch (math 0% / reading 12%, grade F, #1,494 of 1,518 statewide, top 98%, 640 students, 100% FRL); Edgar Fahs Smith Steam Academy (math 7% / reading 35%, grade F, #432 of 512 statewide, top 85%, 240 students, 100% FRL); William Penn Shs (math 22% / reading 8%, grade F, #407 of 437 statewide, top 94%, 1,534 students, 100% FRL) — zoned schools average 100% FRL vs 72% district-wide (28 pts higher); higher-poverty schools than district average — tighter screening recommended.
- Market conditions: Rents rising fast (+4.4%/yr); 223 active listings in the ZIP; 11 comparable units currently listed for rent nearby; rentals at typical pace (median 23d on market — plan ~3-4 weeks tenant-placement turnaround); 45% of comp listings sitting > 30 days — soft ceiling on asking rent; solid renter incomes; 1,328 units permitted in York County in 2024 (338 in 5+ unit buildings).
Forward outlook
- Local home prices are declining (-3.0%/yr); year-one equity from $933 of loan paydown is wiped out by about $4k of value loss. Plan a longer hold.
- At projected returns (-3.0% appreciation + 4.4% rent growth), your $38k cash investment doubles in ~9 years — after that, you're playing with house money.
Negotiation context
- Only 6 days on market — expect competitive offers; lowballing is unlikely to land.
- 3 sale attempts since 26y ago with the ask held roughly flat each time — persistent listings suggest the price (not the market) is what's stuck; bring a comps-based counter.
- Current owner paid $37k; list at $135k implies a 265% gain — meaningful room to come down on a strong offer.
Risks & watch-outs
- Watch-outs: built in 1900 — expect roof / HVAC / electrical / plumbing capex.
- Climate carrying-cost: extreme-heat days projected 7→16/yr by 2055 (HVAC capex compounding) — expect insurance premiums to compound above CPI over the hold.
Questions for the listing agent
- Built in 1900 — when were the roof, HVAC, electrical panel, plumbing, and water heater last replaced?
- Is there a deadline driving the sale (1031 exchange, divorce, estate, relocation)? That informs how much negotiation room exists.
- Crime grade is F in this area — have there been break-ins, vandalism, or insurance claims at this property in the last 3 years? What carrier currently insures it and at what premium?
- What's the average days-on-market for RENTAL listings here right now (not sales)? A rising rental-DOM trend means longer vacancies and softer asking-rent achievability than the comps imply.
- What's the recent tenant-quality profile in this submarket — average credit score on applications, eviction rate, late-payment / NSF rate, and stable-employment percentage? A property-management company in the area should have these aggregated.
- How much new for-sale + rental construction is in the pipeline within 1–3 miles? Heavy new supply typically softens prices + rents 12–24 months out; constrained supply supports both.
Investment metrics
- 1% rule
- 1.22% ✓
- Cap rate
- 9.38%
- Cash-on-cash
- 11.03%
- DSCR
- 1.49
- GRM
- 6.8
CMA / ARV
- ARV (on-the-fly)
- $156,267
- Comps found
- 12
Show comp detail 12 sales within ~0.75 mi
| Address | Dist | Beds/Ba | Sqft | Sold | Price | $/sf | Match |
|---|---|---|---|---|---|---|---|
| 925 W College Ave | 0.16mi | 5/1.0 | 1,660 (+3%) | 3mo | $129,900 | $78 | 85 |
| 826 Fern Pl | 0.34mi | 5/1.0 | 1,572 (-2%) | 0mo | $128,000 | $81 | 80 |
| 1206 W Poplar St | 0.25mi | 5/1.5 | 1,572 (-2%) | 5mo | $135,000 | $86 | 78 |
| 818 W King St | 0.06mi | 5/1.5 | 1,824 (+13%) | 1mo | $203,000 | $111 | 72 |
| 1254 W Poplar St | 0.35mi | 4/1.0 (-1) | 1,536 (-5%) | 1mo | $192,000 | $125 | 70 |
| 132 N West St | 0.43mi | 4/1.0 (-1) | 1,560 (-3%) | 3mo | $145,000 | $93 | 68 |
| 429 W Princess St | 0.60mi | 4/1.0 (-1) | 1,604 (-0%) | 1mo | $125,000 | $78 | 66 |
| 1250 W King St | 0.36mi | 4/1.0 (-1) | 1,459 (-9%) | 5mo | $169,900 | $116 | 58 |
| 589 W Princess St | 0.32mi | 4/1.0 (-1) | 1,428 (-11%) | 4mo | $175,000 | $123 | 58 |
| 204 Park Pl | 0.72mi | 4/1.5 (-1) | 1,574 (-2%) | 2mo | $199,900 | $127 | 54 |
| 120 N Penn St | 0.70mi | 4/1.5 (-1) | 1,492 (-7%) | 5mo | $145,000 | $97 | 44 |
| 847 Florida Ave | 0.60mi | 4/1.0 (-1) | 1,843 (+14%) | 3mo | $154,000 | $84 | 40 |
Match score weights: distance 35% · size 25% · config 20% · recency 20%. Top-matched comps best support the ARV.
Projected returns pro-forma
-3.0% appreciation · 4.43% rent growth · sell at horizon
- IRR
- 1.8%
- Equity multiple
- 1.07×
- Total profit
- $2,708
- Equity at exit
- $20,129
- IRR
- 12.8%
- Equity multiple
- 2.09×
- Total profit
- $41,200
- Equity at exit
- $11,672
Cash invested: $37,800 (down + closing). Projections, not guarantees.
Landlord ↔ Tenant lean methodology
- Overall (STATE)
- 62 Landlord-Friendly
- State Pennsylvania
- 62 Landlord-Friendly · EVEN
- County
- — inherits STATE
- City
- — inherits STATE
ZIP-level market 17403
- Home prices YoY
- -26.9%
- Rents YoY
- 4.4%
- Active inventory
- 223
- Price-to-rent
- 6.8×
Monthly cashflow live
- Estimated rent
- $1,651 high interval (Pro) →
- Mortgage (P&I)
- −$708
- Tax from tax record
- −$192 /mo · $2,310/yr
- Insurance
- −$56
- HOA
- −$0
- Vacancy / Maint / Mgmt
- −$347
- Net cashflow
- $348
Break-even live
Sensitivity live
| Price | -10% $424 | -5% $386 | +0% $348 | +5% $309 | +10% $271 |
|---|---|---|---|---|---|
| Rent | -10% $217 | -5% $282 | +0% $348 | +5% $413 | +10% $478 |
| Rate | -1.0pp $416 | -0.5pp $382 | base $348 | +0.5pp $313 | +1.0pp $277 |
UW: 25.0% down · 7.5% · 30yr · 1.5% tax · 5.0% vac · 8.0% maint · 8.0% mgmt
Financing live
Cash to close
- Down payment
- $33,750
- Closing costs
- $4,050
- Reserves months
- —
- Total cash needed
- —
Loan-product check · same deal, 3 products live
Conventional
25% down · 7.5% · 30yr
- Down + closing
- —
- Monthly P&I
- —
- Monthly cashflow
- —
- DSCR
- —
- Eligible?
- —
Personal DTI + credit; lowest rate.
DSCR
20% down · 8.5% · 30yr
- Down + closing
- —
- Monthly P&I
- —
- Monthly cashflow
- —
- DSCR
- —
- Eligible?
- —
No personal income docs; deal must DSCR.
Hard money
10% down · 12.0% · 12mo
- Down + closing
- —
- Monthly P&I
- —
- Monthly cashflow
- —
- DSCR
- —
- Eligible?
- —
Short-term bridge; refi at stabilization.
Rent comps 11 comps
| Address | Beds | Baths | Sqft | Rent | $/sqft | DOM | Units | Dist |
|---|---|---|---|---|---|---|---|---|
| 925 W College Ave York, PA | 4.0 | 1.0 | 1660 | $1,425 | $0.86 | 15d | 1 | 0.15mi |
| 709 W Princess St York, PA | 5.0 | 1.0 | 1829 | $1,425 | $0.78 | 45d | 1 | 0.15mi |
| 121 S Belvidere Ave Unit 121 York, PA | 5.0 | 1.5 | 1846 | $1,450 | $0.79 | 45d | 1 | 0.17mi |
| 26 N West St York, PA | 6.0 | 2.0 | 2100 | $2,200 | $1.05 | 22d | 1 | 0.34mi |
| 132 N West St York, PA | 4.0 | 1.0 | 1560 | $1,600 | $1.03 | 15d | 1 | 0.42mi |
| 216 Park Pl York, PA | 4.0 | 1.0 | 1192 | $1,350 | $1.13 | 15d | 1 | 0.71mi |
| 330 Smyser St York, PA | 5.0 | 1.0 | 1634 | $1,425 | $0.87 | 45d | 1 | 0.82mi |
| 289 Union St York, PA | 4.0 | 1.0 | 1450 | $1,600 | $1.10 | 45d | 1 | 0.94mi |
| 213 Kurtz Ave York, PA | 5.0 | 1.0 | 1921 | $1,850 | $0.96 | 15d | 1 | 1.00mi |
| 119 W Jackson St York, PA | 4.0 | 1.0 | 1800 | $1,395 | $0.78 | 45d | 1 | 1.16mi |
| 113 Arch St York, PA | 4.0 | 1.0 | 1188 | $1,200 | $1.01 | 15d | 1 | 1.43mi |
Listing history 7 events
-
2026-06-21statusdays on market $135,000 Pending 6 DOM
-
2026-06-18days on market $135,000 Active 5 DOM
-
2026-06-17days on market $135,000 Active 4 DOM
-
2026-06-16days on market $135,000 Active 3 DOM
-
2026-06-15days on market $135,000 Active 2 DOM
-
2026-06-14remarks 360-char remark
-
2026-06-14$135,000 Active 1 DOM
ⓘ Source: listings_history table (triggers on properties + properties_extension) + one-shot
backfill from property_details.listing_events for pre-trigger history.
Tax reassessment forecast PA · Partial reset (capped growth)
- Current annual tax
- $2,310 · $192/mo
- Projected year-2 tax
- $2,310 · $192/mo
- Expected delta
- $0/yr ($0/mo · 0.0%)
ⓘ Screening estimate from a state-policy table — verify with the county assessor before closing.
Climate risk First Street
- Flood 1/10 Low FEMA zone X (unshaded) · 0% chance over 30 yrs
- Wildfire 1/10 Low
- Heat 6/10 Major 7 d/yr ≥103°F today · 16 d/yr by 30 yrs out
- Wind 4/10 Moderate 10% chance of damaging wind over 30 yrs
- Air quality 3/10 Moderate 3 unhealthy d/yr today · 5 by 30 yrs out
Nearby sold comps map
Loading sold comps map…
Walkable amenities ~0.75 mi
Loading nearby amenities…
Taxation est. · year 1
- Rental income
- $19,811
- − Mortgage interest
- −$7,562
- − Property taxes
- −$2,310
- − Insurance
- −$675
- − Repairs & maintenance
- −$1,585
- − Management
- −$1,585
- − Depreciation
- −$3,927
- Taxable income
- $2,167
- Est. tax owed @ 24.0%
- −$520
- After-tax cash flow
- $3,650/yr
For passive investors: Depreciation is non-cash, so a rental often shows a tax loss while cash-flowing — sheltering income. Rental losses are passive: they offset passive income freely, and up to $25,000/yr can offset ordinary (W-2) income if you actively participate and your MAGI is under $100k (phasing out to $0 by $150k); unused losses carry forward. On sale, claimed depreciation is recaptured at up to 25%, and gains may owe capital-gains tax (a 1031 exchange can defer both). Figures are a year-1 estimate at your 24.0% rate — not tax advice; consult a CPA.
Schools (NCES district)
- District
- York City SD
- NCES district ID
- 4226820
- Math proficiency
- 4% ▼ -7.00%
- Reading proficiency
- 16% ▼ -9.00%
- Median HH income
- $29,470
- Composite
- 7.61/100
- National rank
- #9943
- State rank
- #534 of 539 in PA
Livability — York
- Score
- 75/100
- State rank
- #427
- US rank
- #3987
Category grades
Schools grade is shown separately in the Schools card above.
Census & demographics
- Census place
- York, PA
- County
- York County · 278,806 people
- City population
- 184,764
- Metro
- York-Hanover, PA
- Population (ZIP)
- 40,287
- Household income
- $75,384
- Rent vs Own
- Severe rent burden
- 1305.0
Population outlook (York County) Hauer SSP2
- Today (2025)
- 454,205 people
- By 2030
- 457,407 · +0.7%
- By 2040
- 457,529 · +0.7%
- By 2050
- 448,261 · -1.3%
- By 2075
- 427,388 · -5.9%
- By 2100
- 384,218 · -15.4%
Race, ethnicity, and origin ACS 2023
- Neighborhood character
- Diverse neighborhood (Simpson 0.58)
- Race & ethnicity
- White 60% Hispanic / Latino 20% Black 12% Two or more races 9% Asian 3%
- Hispanic origin (detail)
- Mexican 3% Puerto Rican 10% Dominican 3%
- Common ancestry
- Romanian 3% Lithuanian 1% Slovak 1%
- Foreign-born
- 10% · Canada, Vietnam, Jamaica
- Languages at home
- 81% English-only · Spanish 14% Other Indo-European 1% Arabic 1%
Political lean MEDSL · York
- 2024 margin
- Strong R (+25.3) · D 36.9% · R 62.1%
- 2008→2024 swing
- -11.7pp toward R · 2008: -13.6pp · 2024: -25.3pp
- All cycles
- 2024: R+25.3 2020: R+24.6 2016: R+29.3 2012: R+21.2 2008: R+13.6
Not yet ingested
- Civics
- —
Market trends
- HPI YoY
- ▼ -104.51%
- Current HPI
- 284.0731
- Rent YoY
- ▲ 4.43%
- Metro
- York-Hanover, PA
- State GDP YoY
- ▲ 1.68%
- F500 in state
- 34
Industry mix (Fortune 500 HQ in PA)
| Industry | F500 HQs | Revenue |
|---|---|---|
| Healthcare | 2 | $309B |
|
||
| Insurance | 2 | $27B |
|
||
| Telecommunications / Media | 1 | $124B |
|
||
| Industrial Distribution | 1 | $22B |
|
||
| Financial Services | 1 | $20B |
|
||
| Chemicals / Materials | 1 | $18B |
|
||
Price history
+610.5% since first listed9 events — show timeline
- 2026-06-13 Listed $135,000 BRIGHT MLS
- 2010-11-01 Listing Removed — BRIGHT MLS
- 2010-04-12 Listed $49,900 BRIGHT MLS
- 2004-09-27 Sold (Public Records) $37,000 Public Records
- 2000-07-07 Sold (Public Records) $20,000 Public Records
- 2000-07-06 Sold (MLS) $20,000 BRIGHT MLS
- 2000-06-10 Listing Removed — BRIGHT MLS
- 2000-03-07 Listed $24,000 BRIGHT MLS
- 1987-09-15 Sold (Public Records) $19,000 Public Records
Property tax history
+0.8%/yrLatest (2026): $2,310 · +1.6% YoY. Source: county tax records.
Cash-flow waterfall
monthlySold comps — $/sqft
last 12 mo · ≤1 miLoading sold comps…