7371 Highway 64 · Hartman, AR
Flood risk 1/10 · Minimal
- FEMA flood zone
- X (unshaded)
- Chance of flooding over 30 yrs
- 0.0%
- Est. flood insurance / yr
- $507 – $1,088
Fire risk 5/10 · Moderate
- Est. fire insurance / yr
- $1,499 – $2,785
Heat risk 7/10 · Major
- Hot days now (above 111°F)
- 7 days/yr
- Hot days in 30 yrs
- 20 days/yr
Wind risk 2/10 · Minimal
- Chance of severe wind over 30 yrs
- 3.0%
Air-quality risk 1/10 · Minimal
- Unhealthy air days now
- 0 days/yr
- Unhealthy air days in 30 yrs
- 0 days/yr
Risk factors via First Street. Map © Google.
Why this score? — see what drove the B grade
The composite is a weighted blend of 9 inputs, each scored 0–100. Each bar is that input's sub-score; the figure is the points it added to the 100-point composite (weight × sub-score).
- Cash flow +24.8/30.0
- ARV discount +15.0/15.0
- Appreciation +8.6/10.0
- DSCR +8.0/10.0
- 1% rule +5.1/10.0
- Livability +2.7/5.0
- Rent growth +2.5/5.0
- Condition / age +2.5/5.0
- Schools +1.6/10.0
$110,000
🖨 Deal sheet 📄 Offer letter ✓ Due diligence
Listing remarks
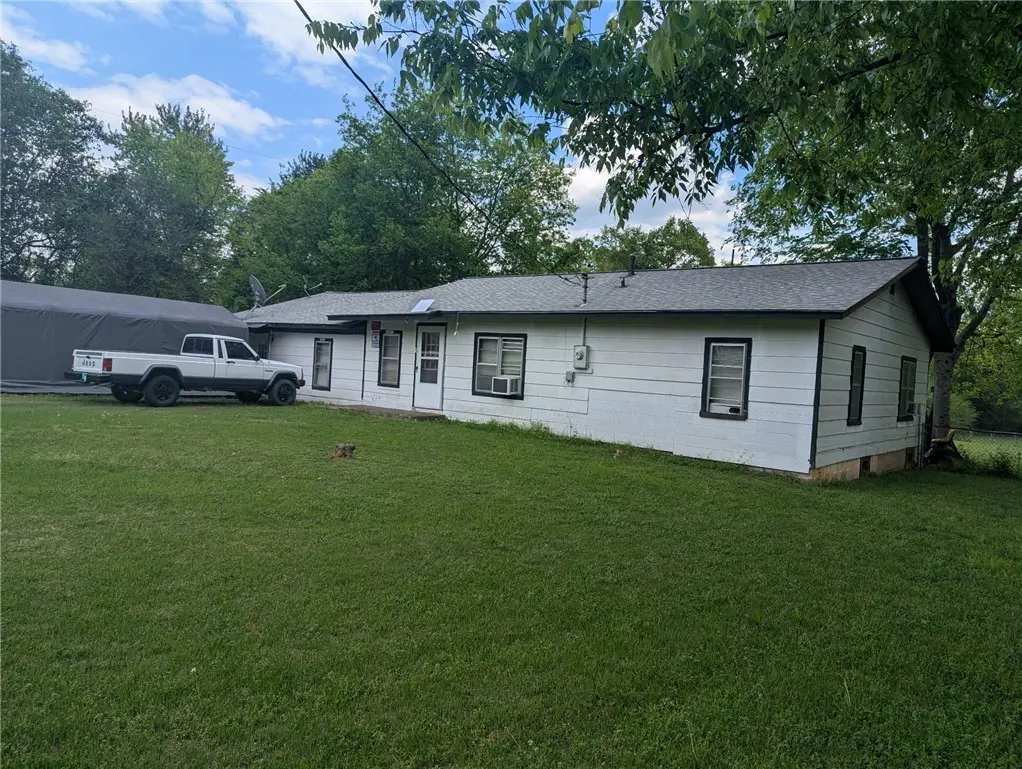
Enjoy country-style living on this 1-acre property featuring a 3-bedroom, 2-bath home with plenty of space inside and out. The large yard offers room for outdoor entertaining, hobbies, or expansion with a wet weather creek just beyond the chain link fence. With some updates and improvements, this home can truly shine. A great opportunity for buyers looking for space, privacy, and the chance to make it their own.
Key facts
- Wet weather creek
- Privacy
- Space for hobbies
Tags
Property features AI
Exterior
- Utilities: Septic
- Home design: Metal/vinyl siding
- Construction: Architectural shingle roof; Crawl space foundation; Metal/vinyl siding
- Exterior features: Level, cleared lot; Not in a subdivision; Paved road access
Interior
- Kitchen: Electric range; Refrigerator stays
- Flooring: Vinyl; Tile; Luxury vinyl
- Bathrooms: 2 full bathrooms
- Heating & cooling: Window units
- Interior features: Washer connection; Electric dryer connection; Electric water heater; Ceiling fans
- Laundry & utility: Washer connection; Electric dryer connection
Neighborhood map
What this means for you Summary
Snapshot
- This is a 3-bed/2.0-bath single-family listed at $110k.
Deal economics
- At list price, monthly cash flow is $231 ($3k/yr) — positive.
- The deal already cash-flows at list — no discount required.
- Meets the 1% rule at list price ($1k rent vs $110k).
- Recommended offer: $107k (3.0% below list) — sets the bar for market timing.
Location & tenants
- Location reads 54/100 on livability (#421 in AR) — a working-class tenant base; expect higher turnover. Strengths: cost of living A+, housing A+; Watch: schools F, crime F, amenities F.
- Westside School District (rural): math 20% / reading 19% proficiency, ranked #216 of 238 in AR (top 91%) — low school quality limits family demand, transient renter base, plan for 1-2y turnover; 99% free/reduced lunch — lower-income household profile, screen leases tightly.
- Market conditions: 24 active listings in the ZIP; 12 units permitted in Johnson County in 2024 (0 in 5+ unit buildings).
Forward outlook
- In year one you build about $9k of equity ($761 loan paydown + $8k appreciation (7.2% local appreciation)).
- Johnson County population projected at +8% by 2050 — modest demand growth; plan on rents tracking national, not racing it.
- At projected returns (7.2% appreciation + 3.0% rent growth), your $31k cash investment doubles in ~3 years — after that, you're playing with house money.
- By year 5, paydown + projected appreciation supports a ~$39k cash-out refi (75% LTV) — recoverable capital for the next deal without selling this one.
Negotiation context
- It's been on market 34 days — a 3% lower offer ($107k) is reasonable based on typical stale-listing flexibility.
- 2 sale attempts with the ask held roughly flat each time — persistent listings suggest the price (not the market) is what's stuck; bring a comps-based counter.
Risks & watch-outs
- Watch-outs: built in 1950 — expect roof / HVAC / electrical / plumbing capex.
- Climate carrying-cost: moderate wildfire risk; extreme-heat days projected 7→20/yr by 2055 (HVAC capex compounding) — expect insurance premiums to compound above CPI over the hold.
Questions for the listing agent
- It's been on market 34 days. Have you received any prior offers? Is the seller open to a 3% concession, seller financing, or rate buy-down credit?
- Built in 1950 — when were the roof, HVAC, electrical panel, plumbing, and water heater last replaced?
- Is there a deadline driving the sale (1031 exchange, divorce, estate, relocation)? That informs how much negotiation room exists.
- Schools are F-rated, which usually means shorter tenancies and higher turnover. Who's the typical renter profile here, and what's been the actual vacancy rate?
- Crime grade is F in this area — have there been break-ins, vandalism, or insurance claims at this property in the last 3 years? What carrier currently insures it and at what premium?
- What's the average days-on-market for RENTAL listings here right now (not sales)? A rising rental-DOM trend means longer vacancies and softer asking-rent achievability than the comps imply.
- What's the recent tenant-quality profile in this submarket — average credit score on applications, eviction rate, late-payment / NSF rate, and stable-employment percentage? A property-management company in the area should have these aggregated.
- How much new for-sale + rental construction is in the pipeline within 1–3 miles? Heavy new supply typically softens prices + rents 12–24 months out; constrained supply supports both.
Investment metrics
- 1% rule
- 1.01% ✓
- Cap rate
- 8.81%
- Cash-on-cash
- 9.00%
- DSCR
- 1.40
- GRM
- 8.3
CMA / ARV
- ARV (median comp)
- $169,300
- List price
- $110,000
- Delta
- -35.03%
- Verdict
- UNDERPRICED
- Comps
- 7 within 1.0 mi
Show comp detail 2 sales within ~0.75 mi
| Address | Dist | Beds/Ba | Sqft | Sold | Price | $/sf | Match |
|---|---|---|---|---|---|---|---|
| 7405 Hwy 64 | 0.27mi | 3/1.0 | 1,834 (+6%) | 18mo | $15,000 | $8 | 59 |
| 203 Pr 2233 | 0.50mi | 3/1.5 | 1,588 (-8%) | 3mo | $239,900 | $151 | 58 |
Match score weights: distance 35% · size 25% · config 20% · recency 20%. Top-matched comps best support the ARV.
Projected returns pro-forma
7.22% appreciation · 3.0% rent growth · sell at horizon
- IRR
- 25.3%
- Equity multiple
- 2.77×
- Total profit
- $54,570
- Equity at exit
- $77,818
- IRR
- 23.2%
- Equity multiple
- 5.78×
- Total profit
- $147,364
- Equity at exit
- $149,282
Cash invested: $30,800 (down + closing). Projections, not guarantees.
Landlord ↔ Tenant lean methodology
- Overall (STATE)
- 92 Strongly Landlord-Friendly
- State Arkansas
- 92 Strongly Landlord-Friendly · R+14
- County
- — inherits STATE
- City
- — inherits STATE
ZIP-level market 72840
- Home prices YoY
- 4.2%
- Active inventory
- 24
- Price-to-rent
- 8.3×
Monthly cashflow live
- Estimated rent
- $1,109 medium interval (Pro) →
- Mortgage (P&I)
- −$577
- Tax from tax record
- −$22 /mo · $269/yr
- Insurance
- −$46
- HOA
- −$0
- Vacancy / Maint / Mgmt
- −$233
- Net cashflow
- $231
Break-even live
UW: 25.0% down · 7.5% · 30yr · 1.5% tax · 5.0% vac · 8.0% maint · 8.0% mgmt
Financing live
Cash to close
- Down payment
- $27,500
- Closing costs
- $3,300
- Reserves months
- —
- Total cash needed
- —
Loan-product check · same deal, 3 products live
Conventional
25% down · 7.5% · 30yr
- Down + closing
- —
- Monthly P&I
- —
- Monthly cashflow
- —
- DSCR
- —
- Eligible?
- —
Personal DTI + credit; lowest rate.
DSCR
20% down · 8.5% · 30yr
- Down + closing
- —
- Monthly P&I
- —
- Monthly cashflow
- —
- DSCR
- —
- Eligible?
- —
No personal income docs; deal must DSCR.
Hard money
10% down · 12.0% · 12mo
- Down + closing
- —
- Monthly P&I
- —
- Monthly cashflow
- —
- DSCR
- —
- Eligible?
- —
Short-term bridge; refi at stabilization.
Listing history 13 events
-
2026-06-08days on market $110,000 Active 34 DOM
-
2026-06-07days on market $110,000 Active 33 DOM
-
2026-06-07days on market $110,000 Active 32 DOM
-
2026-06-04days on market $110,000 Active 29 DOM
-
2026-06-02days on market $110,000 Active 28 DOM
-
2026-06-01days on market $110,000 Active 27 DOM
-
2026-05-31days on market $110,000 Active 26 DOM
-
2026-05-31days on market $110,000 Active 25 DOM
-
2026-05-04$110,000 New Listing 415-char remark
-
2026-05-04$110,000 Active 415-char remark
-
2026-05-04$110,000 Active
-
2009-05-01soldstatus $104,000
-
2005-01-28soldstatus $49,500
ⓘ Source: listings_history table (triggers on properties + properties_extension) + one-shot
backfill from property_details.listing_events for pre-trigger history.
Tax reassessment forecast AR · Resets to sale price
- Current annual tax
- $269 · $22/mo
- Projected year-2 tax
- $704 · $59/mo
- Expected delta
- +$435/yr (+$36/mo · 161.2%)
ⓘ Screening estimate from a state-policy table — verify with the county assessor before closing.
Climate risk First Street
- Flood 1/10 Low FEMA zone X (unshaded) · 0% chance over 30 yrs
- Wildfire 5/10 Major
- Heat 7/10 Severe 7 d/yr ≥111°F today · 20 d/yr by 30 yrs out
- Wind 2/10 Low 3% chance of damaging wind over 30 yrs
- Air quality 1/10 Low 0 unhealthy d/yr today · 0 by 30 yrs out
Nearby sold comps map
Loading sold comps map…
Walkable amenities ~0.75 mi
Loading nearby amenities…
Taxation est. · year 1
- Rental income
- $13,310
- − Mortgage interest
- −$6,162
- − Property taxes
- −$269
- − Insurance
- −$550
- − Repairs & maintenance
- −$1,065
- − Management
- −$1,065
- − Depreciation
- −$3,200
- Taxable income
- $999
- Est. tax owed @ 24.0%
- −$240
- After-tax cash flow
- $2,533/yr
For passive investors: Depreciation is non-cash, so a rental often shows a tax loss while cash-flowing — sheltering income. Rental losses are passive: they offset passive income freely, and up to $25,000/yr can offset ordinary (W-2) income if you actively participate and your MAGI is under $100k (phasing out to $0 by $150k); unused losses carry forward. On sale, claimed depreciation is recaptured at up to 25%, and gains may owe capital-gains tax (a 1031 exchange can defer both). Figures are a year-1 estimate at your 24.0% rate — not tax advice; consult a CPA.
Schools (NCES district)
- District
- Westside School District
- NCES district ID
- 0514020
- Math proficiency
- 20% ▼ -7.00%
- Reading proficiency
- 19% ▼ -8.00%
- Median HH income
- $32,160
- Composite
- 15.81/100
- National rank
- #9265
- State rank
- #216 of 238 in AR
Livability — Hartman
- Score
- 54/100
- State rank
- #421
- US rank
- #23986
Category grades
Schools grade is shown separately in the Schools card above.
Census & demographics
- Population (ZIP)
- 2,399
Population outlook (Johnson County) Hauer SSP2
- Today (2025)
- 27,452 people
- By 2030
- 28,003 · +2.0%
- By 2040
- 28,960 · +5.5%
- By 2050
- 29,627 · +7.9%
- By 2075
- 31,000 · +12.9%
- By 2100
- 31,173 · +13.6%
Race, ethnicity, and origin ACS 2023
- Neighborhood character
- Predominantly White (80%)
- Race & ethnicity
- White 80% Hispanic / Latino 12% Two or more races 8% Asian 4%
- Hispanic origin (detail)
- Mexican 8% Puerto Rican 3%
- Common ancestry
- Lithuanian 3% Serbian 2% Portuguese 1%
- Foreign-born
- 8% · Canada
- Languages at home
- 87% English-only · Spanish 13%
Political lean MEDSL · Johnson
- 2024 margin
- Solid R (+51.4) · D 23.3% · R 74.7% · Other 2.0%
- 2008→2024 swing
- -28.4pp toward R · 2008: -23.1pp · 2024: -51.4pp
- All cycles
- 2024: R+51.4 2020: R+49.0 2016: R+40.6 2012: R+28.0 2008: R+23.1
Not yet ingested
- Civics
- —
Market trends
- HPI YoY
- ▲ 7.22%
- Current HPI
- 178.524
- Rent YoY
- —
- Metro
- —
- State GDP YoY
- ▲ 3.80%
- F500 in state
- 10
Industry mix (Fortune 500 HQ in AR)
| Industry | F500 HQs | Revenue |
|---|---|---|
| Retail | 1 | $681B |
|
||
| Food / Agriculture | 1 | $53B |
|
||
| Retail / Energy | 1 | $22B |
|
||
| Transportation / Logistics | 1 | $12B |
|
||
| Energy | 1 | $4B |
|
||
Price history
+122.2% since first listed5 events — show timeline
- 2026-06-08 Listing Removed — CARMLS
- 2026-05-04 Listed $110,000 CARMLS
- 2026-05-04 Listed $110,000 WRVBOR
- 2009-05-01 Sold (Public Records) $104,000 Public Records
- 2005-01-28 Sold (Public Records) $49,500 Public Records
Property tax history
+8.7%/yrLatest (2025): $269 · -18.3% YoY. Source: county tax records.
Cash-flow waterfall
monthlySold comps — $/sqft
last 12 mo · ≤1 miLoading sold comps…