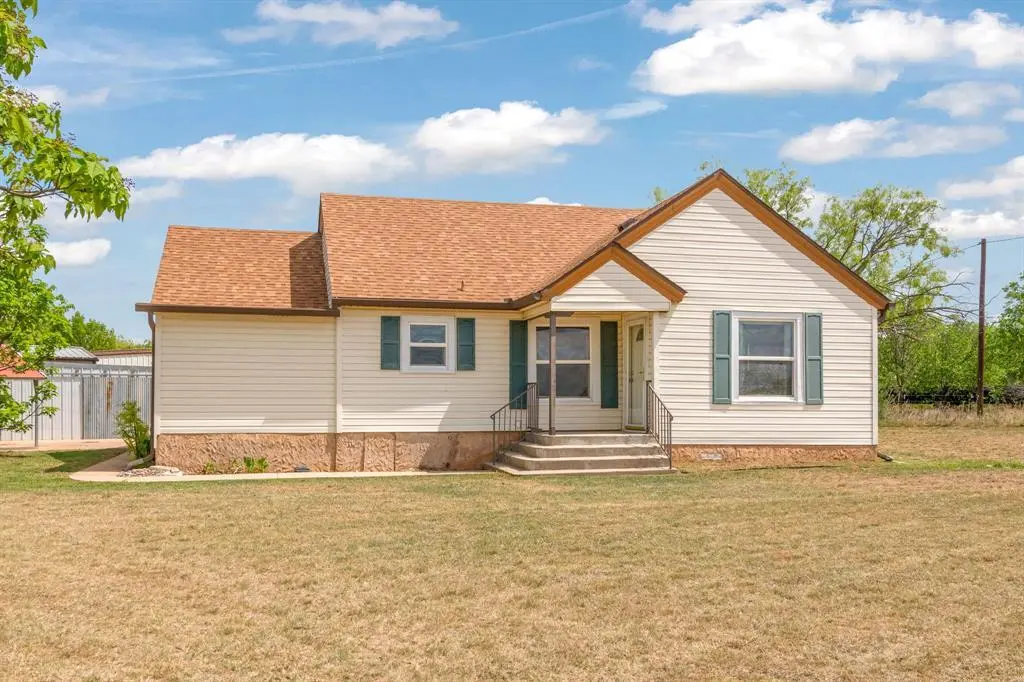
617 Neas Rd · Abilene, TX
Flood risk 5/10 · Moderate
- FEMA flood zone
- A
- Chance of flooding over 30 yrs
- 0.24%
- Est. flood insurance / yr
- $1,009 – $1,996
Fire risk 7/10 · Major
- Est. fire insurance / yr
- $1,222 – $2,270
Heat risk 7/10 · Major
- Hot days now (above 104°F)
- 7 days/yr
- Hot days in 30 yrs
- 23 days/yr
Wind risk 4/10 · Minor
- Chance of severe wind over 30 yrs
- 16.0%
Air-quality risk 1/10 · Minimal
- Unhealthy air days now
- 0 days/yr
- Unhealthy air days in 30 yrs
- 0 days/yr
Risk factors via First Street. Map © Google.
Why this score? — see what drove the B- grade
The composite is a weighted blend of 9 inputs, each scored 0–100. Each bar is that input's sub-score; the figure is the points it added to the 100-point composite (weight × sub-score).
- Cash flow +25.7/30.0
- ARV discount +15.0/15.0
- DSCR +8.6/10.0
- 1% rule +6.2/10.0
- Rent growth +5.0/5.0
- Livability +3.8/5.0
- Schools +2.8/10.0
- Condition / age +2.5/5.0
- Appreciation +0.0/10.0
$225,000
🖨 Deal sheet 📄 Offer letter ✓ Due diligence
Listing remarks MLS
Bedroom 2 Full Bath, 2 Living Areas, 43'x10' finished attic space vented, many versatile additions to this home that could easily make it several more bedrooms if needed. Some hardwood floors. Recently installed Roof, Energy Efficient Windows and Heating and Air. Covered Parking, Storage, 30ft x 40ft concrete slab ready for a great workshop! . 76 Acre Lot, Convenient and close to Hospital, DR's and Abilene's newest dining, shopping, and growth!
Key facts
- Open-concept design
- Large windows
- Sleek countertops
Tags
Neighborhood map
What this means for you Summary
Snapshot
- This is a 2-bed/2.0-bath single-family listed at $225k.
Deal economics
- At list price, monthly cash flow is $412 ($5k/yr) — positive.
- The deal already cash-flows at list — no discount required.
- Meets the 1% rule at list price ($3k rent vs $225k).
- Cap rate 9.2% vs local median 6.7% in Abilene — top-decile yield for the area; either an underpriced asset or a hidden risk that comps aren't pricing in. Stress-test before assuming the spread holds.
Location & tenants
- Location reads 75/100 on livability (#142 in TX, #4,037 nationally) — a middle-class / working-renter tenant base. Strengths: cost of living A+, housing A+, health & safety A+; Watch: schools D+, crime D, commute F.
- Abilene ISD (urban): math 32% / reading 34% proficiency, ranked #575 of 826 in TX (top 70%) — families likely to look elsewhere, expect single-tenant / working-renter base with shorter leases.
- Market conditions: Rents rising fast (+43.4%/yr); 195 active listings in the ZIP; 3 comparable units currently listed for rent nearby; rentals lingering (median 44d on market — plan ~5-8 weeks vacancy on turnover, expect pricing pressure); 100% of comp listings sitting > 30 days — soft ceiling on asking rent; 508 units permitted in Taylor County in 2024 (0 in 5+ unit buildings).
- At $2,528/mo this rent would consume 57% of the median local household income ($54k/yr) (locally 1240% of renters already pay >50% of income on rent) — very limited rent-growth headroom before tenants either downsize or default.
Forward outlook
- Local home prices are declining (-3.0%/yr); year-one equity from $2k of loan paydown is wiped out by about $7k of value loss. Plan a longer hold.
- Taylor County population projected at +16% by 2050 — long-run rental-demand tailwind backs the buy-and-hold thesis.
- At projected returns (-3.0% appreciation + 8.0% rent growth), your $63k cash investment doubles in ~8 years — after that, you're playing with house money.
Negotiation context
- Only 12 days on market — expect competitive offers; lowballing is unlikely to land.
- 3 sale attempts since 10y ago with the ask held roughly flat each time — persistent listings suggest the price (not the market) is what's stuck; bring a comps-based counter.
Risks & watch-outs
- Watch-outs: flood insurance adds $125/mo; built in 1959 — expect roof / HVAC / electrical / plumbing capex.
- Climate carrying-cost: in FEMA flood zone A (mandatory federal flood insurance); major wildfire risk; extreme-heat days projected 7→23/yr by 2055 (HVAC capex compounding) — expect insurance premiums to compound above CPI over the hold.
Questions for the listing agent
- Built in 1959 — when were the roof, HVAC, electrical panel, plumbing, and water heater last replaced?
- What's the actual annual flood-insurance premium (NFIP or private), and is the property in a SFHA with mandatory coverage?
- Is there a deadline driving the sale (1031 exchange, divorce, estate, relocation)? That informs how much negotiation room exists.
- Schools are D-rated, which usually means shorter tenancies and higher turnover. Who's the typical renter profile here, and what's been the actual vacancy rate?
- Crime grade is D in this area — have there been break-ins, vandalism, or insurance claims at this property in the last 3 years? What carrier currently insures it and at what premium?
- What's the average days-on-market for RENTAL listings here right now (not sales)? A rising rental-DOM trend means longer vacancies and softer asking-rent achievability than the comps imply.
- What's the recent tenant-quality profile in this submarket — average credit score on applications, eviction rate, late-payment / NSF rate, and stable-employment percentage? A property-management company in the area should have these aggregated.
- How much new for-sale + rental construction is in the pipeline within 1–3 miles? Heavy new supply typically softens prices + rents 12–24 months out; constrained supply supports both.
Investment metrics
- 1% rule
- 1.12% ✓
- Cap rate
- 9.16%
- Cash-on-cash
- 10.24%
- DSCR
- 1.46
- GRM
- 7.4
CMA / ARV
- ARV (on-the-fly)
- $343,000
- Comps found
- 8
Show comp detail 8 sales within ~0.75 mi
| Address | Dist | Beds/Ba | Sqft | Sold | Price | $/sf | Match |
|---|---|---|---|---|---|---|---|
| 617 Neas Rd | 0.00mi | 2/2.0 | 1,688 (-4%) | 1mo | $225,000 | $133 | 93 |
| 4308 Ranger Rd | 0.46mi | 3/2.0 (+1) | 1,639 (-6%) | 0mo | $314,900 | $192 | 63 |
| 4214 Ranger Rd | 0.46mi | 3/2.0 (+1) | 1,635 (-7%) | 7mo | $310,900 | $190 | 57 |
| 4226 Ranger Rd | 0.46mi | 3/2.0 (+1) | 1,639 (-6%) | 7mo | $314,900 | $192 | 57 |
| 4302 Ranger Rd | 0.46mi | 3/2.0 (+1) | 1,578 (-10%) | 7mo | $308,900 | $196 | 52 |
| 4208 Ranger Rd | 0.46mi | 3/2.0 (+1) | 1,578 (-10%) | 7mo | $308,900 | $196 | 52 |
| 4101 Ranger Rd | 0.54mi | 3/2.0 (+1) | 1,585 (-9%) | 6mo | $314,900 | $199 | 49 |
| 4220 Ranger Rd | 0.46mi | 3/2.0 (+1) | 1,537 (-12%) | 7mo | $307,900 | $200 | 48 |
Match score weights: distance 35% · size 25% · config 20% · recency 20%. Top-matched comps best support the ARV.
Projected returns pro-forma
-3.0% appreciation · 8.0% rent growth · sell at horizon
- IRR
- 1.3%
- Equity multiple
- 1.05×
- Total profit
- $3,219
- Equity at exit
- $33,548
- IRR
- 15.4%
- Equity multiple
- 2.55×
- Total profit
- $97,661
- Equity at exit
- $19,454
Cash invested: $63,000 (down + closing). Projections, not guarantees.
Landlord ↔ Tenant lean methodology
- Overall (STATE)
- 87 Strongly Landlord-Friendly
- State Texas
- 87 Strongly Landlord-Friendly · R+5
- County
- — inherits STATE
- City
- — inherits STATE
ZIP-level market 79601
- Home prices YoY
- -22.8%
- Rents YoY
- 43.4%
- Active inventory
- 195
- Price-to-rent
- 7.4×
Monthly cashflow live
- Estimated rent
- $2,528 medium interval (Pro) →
- Mortgage (P&I)
- −$1,180
- Tax from tax record
- −$186 /mo · $2,233/yr
- Insurance
- −$94
- Flood insurance flood zone
- −$125 /mo · $1,502/yr
- HOA
- −$0
- Vacancy / Maint / Mgmt
- −$531
- Net cashflow
- $412
Break-even live
UW: 25.0% down · 7.5% · 30yr · 1.5% tax · 5.0% vac · 8.0% maint · 8.0% mgmt
Financing live
Cash to close
- Down payment
- $56,250
- Closing costs
- $6,750
- Reserves months
- —
- Total cash needed
- —
Loan-product check · same deal, 3 products live
Conventional
25% down · 7.5% · 30yr
- Down + closing
- —
- Monthly P&I
- —
- Monthly cashflow
- —
- DSCR
- —
- Eligible?
- —
Personal DTI + credit; lowest rate.
DSCR
20% down · 8.5% · 30yr
- Down + closing
- —
- Monthly P&I
- —
- Monthly cashflow
- —
- DSCR
- —
- Eligible?
- —
No personal income docs; deal must DSCR.
Hard money
10% down · 12.0% · 12mo
- Down + closing
- —
- Monthly P&I
- —
- Monthly cashflow
- —
- DSCR
- —
- Eligible?
- —
Short-term bridge; refi at stabilization.
Rent comps 3 comps
| Address | Beds | Baths | Sqft | Rent | $/sqft | DOM | Units | Dist |
|---|---|---|---|---|---|---|---|---|
| 527 Colorado St Abilene, TX | 3.0 | 2.0 | 1337 | $2,750 | $2.06 | 43d | 1 | 0.32mi |
| 4225 Ranger Rd Abilene, TX | 3.0 | 2.0 | 1337 | $2,749 | $2.06 | 43d | 1 | 0.47mi |
| 4217 Ranger Rd Abilene, TX | 3.0 | 2.0 | 1337 | $2,749 | $2.06 | 43d | 1 | 0.48mi |
Listing history 14 events
-
2026-04-22status Pending
-
2026-04-14historical Active Option Contract
-
2026-04-08$225,000 Active
-
2021-08-06soldstatus
-
2017-03-29soldstatus
-
2017-03-21soldstatus Sold 448-char remark
Show marketing remark (448 chars)
Bedroom 2 Full Bath, 2 Living Areas, 43'x10' finished attic space vented, many versatile additions to this home that could easily make it several more bedrooms if needed. Some hardwood floors. Recently installed Roof, Energy Efficient Windows and Heating and Air. Covered Parking, Storage, 30ft x 40ft concrete slab ready for a great workshop! . 76 Acre Lot, Convenient and close to Hospital, DR's and Abilene's newest dining, shopping, and growth!
-
2017-03-13status Pending 448-char remark
Show marketing remark (448 chars)
Bedroom 2 Full Bath, 2 Living Areas, 43'x10' finished attic space vented, many versatile additions to this home that could easily make it several more bedrooms if needed. Some hardwood floors. Recently installed Roof, Energy Efficient Windows and Heating and Air. Covered Parking, Storage, 30ft x 40ft concrete slab ready for a great workshop! . 76 Acre Lot, Convenient and close to Hospital, DR's and Abilene's newest dining, shopping, and growth!
-
2017-03-03historical Active Option Contract 448-char remark
Show marketing remark (448 chars)
Bedroom 2 Full Bath, 2 Living Areas, 43'x10' finished attic space vented, many versatile additions to this home that could easily make it several more bedrooms if needed. Some hardwood floors. Recently installed Roof, Energy Efficient Windows and Heating and Air. Covered Parking, Storage, 30ft x 40ft concrete slab ready for a great workshop! . 76 Acre Lot, Convenient and close to Hospital, DR's and Abilene's newest dining, shopping, and growth!
-
2017-01-11$89,900 Active 448-char remark
Show marketing remark (448 chars)
Bedroom 2 Full Bath, 2 Living Areas, 43'x10' finished attic space vented, many versatile additions to this home that could easily make it several more bedrooms if needed. Some hardwood floors. Recently installed Roof, Energy Efficient Windows and Heating and Air. Covered Parking, Storage, 30ft x 40ft concrete slab ready for a great workshop! . 76 Acre Lot, Convenient and close to Hospital, DR's and Abilene's newest dining, shopping, and growth!
-
2017-01-01historical
-
2016-08-07price $105,000
-
2016-06-28$110,000 Active
-
2005-05-31soldstatus
-
1999-11-17soldstatus
ⓘ Source: listings_history table (triggers on properties + properties_extension) + one-shot
backfill from property_details.listing_events for pre-trigger history.
Tax reassessment forecast TX · Resets to sale price
- Current annual tax
- $2,233 · $186/mo
- Projected year-2 tax
- $4,118 · $343/mo
- Expected delta
- +$1,885/yr (+$157/mo · 84.4%)
ⓘ Screening estimate from a state-policy table — verify with the county assessor before closing.
Climate risk First Street
- Flood 5/10 Major FEMA zone A · 24% chance over 30 yrs
- Wildfire 7/10 Severe
- Heat 7/10 Severe 7 d/yr ≥104°F today · 23 d/yr by 30 yrs out
- Wind 4/10 Moderate 16% chance of damaging wind over 30 yrs
- Air quality 1/10 Low 0 unhealthy d/yr today · 0 by 30 yrs out
Nearby sold comps map
Loading sold comps map…
Walkable amenities ~0.75 mi
Loading nearby amenities…
Taxation est. · year 1
- Rental income
- $30,339
- − Mortgage interest
- −$12,603
- − Property taxes
- −$2,233
- − Insurance
- −$2,628
- − Repairs & maintenance
- −$2,427
- − Management
- −$2,427
- − Depreciation
- −$6,545
- Taxable income
- $1,475
- Est. tax owed @ 24.0%
- −$354
- After-tax cash flow
- $4,594/yr
For passive investors: Depreciation is non-cash, so a rental often shows a tax loss while cash-flowing — sheltering income. Rental losses are passive: they offset passive income freely, and up to $25,000/yr can offset ordinary (W-2) income if you actively participate and your MAGI is under $100k (phasing out to $0 by $150k); unused losses carry forward. On sale, claimed depreciation is recaptured at up to 25%, and gains may owe capital-gains tax (a 1031 exchange can defer both). Figures are a year-1 estimate at your 24.0% rate — not tax advice; consult a CPA.
Schools (NCES district)
- District
- Abilene ISD
- NCES district ID
- 4807440
- Math proficiency
- 32% ▼ -11.00%
- Reading proficiency
- 34% ▼ -5.00%
- Median HH income
- $39,782
- Composite
- 27.71/100
- National rank
- #6909
- State rank
- #575 of 826 in TX
Livability — Abilene
- Score
- 75/100
- State rank
- #142
- US rank
- #4037
Category grades
Schools grade is shown separately in the Schools card above.
Census & demographics
- County
- Taylor County · 136,672 people
- City population
- 136,672
- Metro
- Abilene, TX
- Population (ZIP)
- 28,050
- Household income
- $53,631
- Rent vs Own
- Severe rent burden
- 1240.0
Population outlook (Taylor County) Hauer SSP2
- Today (2025)
- 145,270 people
- By 2030
- 150,050 · +3.3%
- By 2040
- 159,417 · +9.7%
- By 2050
- 168,883 · +16.3%
- By 2075
- 194,436 · +33.8%
- By 2100
- 203,163 · +39.9%
Race, ethnicity, and origin ACS 2023
- Neighborhood character
- Diverse neighborhood (Simpson 0.61)
- Race & ethnicity
- White 55% Hispanic / Latino 25% Black 13% Two or more races 13% Asian 3%
- Hispanic origin (detail)
- Mexican 21%
- Common ancestry
- Italian 2% Lithuanian 2% Serbian 1%
- Foreign-born
- 7% · Canada, Vietnam
- Languages at home
- 81% English-only · Spanish 15% French/Haitian/Cajun 1% Vietnamese 1%
Political lean MEDSL · Taylor
- 2024 margin
- Solid R (+49.8) · D 24.6% · R 74.4% · Other 1.0%
- 2008→2024 swing
- -4.2pp toward R · 2008: -45.6pp · 2024: -49.8pp
- All cycles
- 2024: R+49.8 2020: R+45.3 2016: R+51.1 2012: R+53.6 2008: R+45.6
Not yet ingested
- Civics
- —
Market trends
- HPI YoY
- ▼ -63.17%
- Current HPI
- 214.4372
- Rent YoY
- ▲ 43.38%
- Metro
- Abilene, TX
- State GDP YoY
- ▲ 3.95%
- F500 in state
- 110
Industry mix (Fortune 500 HQ in TX)
| Industry | F500 HQs | Revenue |
|---|---|---|
| Energy | 16 | $1,198B |
|
||
| Technology | 5 | $198B |
|
||
| Engineering / Construction | 4 | $72B |
|
||
| Energy Services | 3 | $60B |
|
||
| Utilities | 3 | $41B |
|
||
| Healthcare | 2 | $330B |
|
||
Price history
+104.5% since first listed14 events — show timeline
- 2026-04-22 Pending — NTREIS
- 2026-04-14 Contingent — NTREIS
- 2026-04-08 Listed $225,000 NTREIS
- 2021-08-06 Sold (Public Records) — Public Records
- 2017-03-29 Sold (Public Records) — Public Records
- 2017-03-21 Sold (MLS) — NTREIS
- 2017-03-13 Pending — NTREIS
- 2017-03-03 Contingent — NTREIS
- 2017-01-11 Listed $89,900 NTREIS
- 2017-01-01 Listing Removed — NTREIS
- 2016-08-07 Price Changed $105,000 NTREIS
- 2016-06-28 Listed $110,000 NTREIS
- 2005-05-31 Sold (Public Records) — Public Records
- 1999-11-17 Sold (Public Records) — Public Records
Property tax history
+8.1%/yrLatest (2025): $2,233 · +6.1% YoY. Source: county tax records.
Cash-flow waterfall
monthlySold comps — $/sqft
last 12 mo · ≤1 miLoading sold comps…