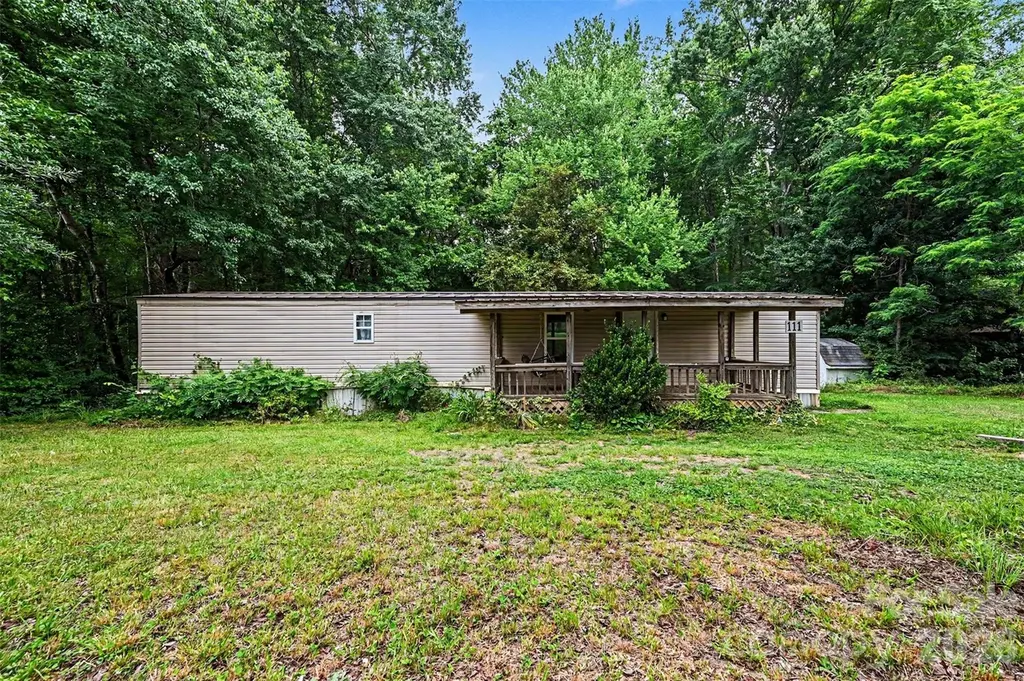
111 Oak Brook Dr · Mooresville, NC
Flood risk 1/10 · Minimal
- FEMA flood zone
- X (unshaded)
- Chance of flooding over 30 yrs
- 0.0%
- Est. flood insurance / yr
- $507 – $1,088
Fire risk 4/10 · Minor
- Est. fire insurance / yr
- $906 – $1,684
Heat risk 5/10 · Moderate
- Hot days now (above 103°F)
- 7 days/yr
- Hot days in 30 yrs
- 16 days/yr
Wind risk 4/10 · Minor
- Chance of severe wind over 30 yrs
- 10.0%
Air-quality risk 2/10 · Minimal
- Unhealthy air days now
- 1 days/yr
- Unhealthy air days in 30 yrs
- 2 days/yr
Risk factors via First Street. Map © Google.
Why this score? — see what drove the B- grade
The composite is a weighted blend of 9 inputs, each scored 0–100. Each bar is that input's sub-score; the figure is the points it added to the 100-point composite (weight × sub-score).
- Cash flow +29.9/30.0
- DSCR +10.0/10.0
- ARV discount +7.5/15.0
- 1% rule +7.1/10.0
- Schools +4.6/10.0
- Livability +3.7/5.0
- Rent growth +2.9/5.0
- Condition / age +2.5/5.0
- Appreciation +0.0/10.0
$160,000
🖨 Deal sheet 📄 Offer letter ✓ Due diligence
Listing remarks MLS
The split floor plan maximizes privacy in this open, 2-bedroom, 1.5-bathroom ranch style home. Butcher block countertops, breakfast bar or gathering spot for entertaining. Unwind on the covered front porch with hanging swing, perfect for quiet evenings. Back deck with views of the nearly 1.5 acres, plus two outbuildings, and fire pit. Highly desirable location convenient to amenities and shopping centers.
Key facts
- 1.23 acre lot
- Garage
- Built 1983
Property features AI
Finance
- HOA & community: No HOA
Exterior
- Parking: Driveway; Attached/main-level garage with 1 garage space
- Utilities: City water; Public sewer
- Home design: Single-family residence; One story; Site-built
- Construction: Vinyl exterior; Aluminum roof; Crawl space foundation; Built on site (site built)
- Exterior features: Deck; Front porch; Fire pit; Private lot; Gravel road access (publicly maintained)
Interior
- Kitchen: Dishwasher; Electric range; Microwave; Refrigerator
- Bedrooms: 2 bedrooms on the main level
- Bathrooms: 1 full bath; 1 half bath
- Heating & cooling: Electric forced-air heating; ENERGY STAR qualified equipment; Window unit(s) for cooling
- Interior features: Attic with pull-down stairs; Garden tub; Pantry; 6 total rooms
- Laundry & utility: In-unit laundry
Neighborhood map
What this means for you Summary
Snapshot
- This is a 3-bed/2.0-bath manufactured listed at $160k.
Deal economics
- At list price, monthly cash flow is $590 ($7k/yr) — positive.
- The deal already cash-flows at list — no discount required.
- Meets the 1% rule at list price ($2k rent vs $160k).
- Cap rate 10.7% vs local median 2.9% in Mooresville — top-decile yield for the area; either an underpriced asset or a hidden risk that comps aren't pricing in. Stress-test before assuming the spread holds.
Location & tenants
- Location reads 73/100 on livability (#66 in NC) — a middle-class / working-renter tenant base. Strengths: housing A+, health & safety A+, employment A-; Watch: amenities F, commute F.
- Mooresville Graded School District (other): math 51% / reading 55% proficiency, ranked #49 of 178 in NC (top 28%) — acceptable for families but not a draw, mixed tenant base, ~2y average lease.
- Market conditions: Rents rising (+1.6%/yr); 488 active listings in the ZIP; 1 comparable units currently listed for rent nearby; solid renter incomes; 1,955 units permitted in Iredell County in 2024 (128 in 5+ unit buildings).
Forward outlook
- Local home prices are declining (-3.0%/yr); year-one equity from $1k of loan paydown is wiped out by about $5k of value loss. Plan a longer hold.
- Iredell County population projected at +26% by 2050 — long-run rental-demand tailwind backs the buy-and-hold thesis.
- At projected returns (-3.0% appreciation + 1.6% rent growth), your $45k cash investment doubles in ~9 years — after that, you're playing with house money.
Negotiation context
- Only 13 days on market — expect competitive offers; lowballing is unlikely to land.
- 2 sale attempts since 3y ago; this cycle's ask has dropped $10k (6%) from the opening price — seller is motivated, your offer sets the floor, not the list.
- Current owner paid $120k; 33% above their basis — modest negotiation headroom, anchor on the comps not their cost.
Risks & watch-outs
- Climate carrying-cost: extreme-heat days projected 7→16/yr by 2055 (HVAC capex compounding) — expect insurance premiums to compound above CPI over the hold.
Questions for the listing agent
- Is there a deadline driving the sale (1031 exchange, divorce, estate, relocation)? That informs how much negotiation room exists.
- Schools are B-rated — typically a magnet for longer-tenancy family renters. What's the average tenant stay here, and is there a school-zone premium baked into asking?
- What's the average days-on-market for RENTAL listings here right now (not sales)? A rising rental-DOM trend means longer vacancies and softer asking-rent achievability than the comps imply.
- What's the recent tenant-quality profile in this submarket — average credit score on applications, eviction rate, late-payment / NSF rate, and stable-employment percentage? A property-management company in the area should have these aggregated.
- How much new for-sale + rental construction is in the pipeline within 1–3 miles? Heavy new supply typically softens prices + rents 12–24 months out; constrained supply supports both.
Investment metrics
- 1% rule
- 1.21% ✓
- Cap rate
- 10.72%
- Cash-on-cash
- 15.82%
- DSCR
- 1.70
- GRM
- 6.9
CMA / ARV
No comps found within radius.
Projected returns pro-forma
-3.0% appreciation · 1.58% rent growth · sell at horizon
- IRR
- 5.2%
- Equity multiple
- 1.20×
- Total profit
- $8,877
- Equity at exit
- $23,857
- IRR
- 13.4%
- Equity multiple
- 2.00×
- Total profit
- $44,975
- Equity at exit
- $13,834
Cash invested: $44,800 (down + closing). Projections, not guarantees.
Landlord ↔ Tenant lean methodology
- Overall (STATE)
- 85 Strongly Landlord-Friendly
- State North Carolina
- 85 Strongly Landlord-Friendly · R+3
- County
- — inherits STATE
- City
- — inherits STATE
ZIP-level market 28115
- Rents YoY
- 1.6%
- Active inventory
- 488
- Price-to-rent
- 6.9×
Monthly cashflow live
- Estimated rent
- $1,937 medium interval (Pro) →
- Mortgage (P&I)
- −$839
- Tax from tax record
- −$34 /mo · $405/yr
- Insurance
- −$67
- HOA
- −$0
- Vacancy / Maint / Mgmt
- −$407
- Net cashflow
- $590
Break-even live
UW: 25.0% down · 7.5% · 30yr · 1.5% tax · 5.0% vac · 8.0% maint · 8.0% mgmt
Financing live
Cash to close
- Down payment
- $40,000
- Closing costs
- $4,800
- Reserves months
- —
- Total cash needed
- —
Loan-product check · same deal, 3 products live
Conventional
25% down · 7.5% · 30yr
- Down + closing
- —
- Monthly P&I
- —
- Monthly cashflow
- —
- DSCR
- —
- Eligible?
- —
Personal DTI + credit; lowest rate.
DSCR
20% down · 8.5% · 30yr
- Down + closing
- —
- Monthly P&I
- —
- Monthly cashflow
- —
- DSCR
- —
- Eligible?
- —
No personal income docs; deal must DSCR.
Hard money
10% down · 12.0% · 12mo
- Down + closing
- —
- Monthly P&I
- —
- Monthly cashflow
- —
- DSCR
- —
- Eligible?
- —
Short-term bridge; refi at stabilization.
Rent comps 1 comps
| Address | Beds | Baths | Sqft | Rent | $/sqft | DOM | Units | Dist |
|---|---|---|---|---|---|---|---|---|
| 102 Kennedy Ridge Way Mooresville, NC | 1.0–3.0 | 1.0–2.0 | 1051 | $2,186 | $2.08 | 1d | 68 | 1.24mi |
Listing history 11 events
-
2026-06-18days on market $160,000 Active 13 DOM
-
2026-06-17days on market $160,000 Active 12 DOM
-
2026-06-16days on market $160,000 Active 11 DOM
-
2026-06-15price $160,000 Active 10 DOM
-
2026-06-15days on market $170,000 Active 10 DOM
-
2026-06-13days on market $170,000 Active 8 DOM
-
2026-06-13days on market $170,000 Active 7 DOM
-
2026-06-09days on market $170,000 Active 4 DOM
-
2026-06-08days on market $170,000 Active 3 DOM
-
2026-06-07remarks 157-char remark
-
2026-06-07$170,000 Active 2 DOM
ⓘ Source: listings_history table (triggers on properties + properties_extension) + one-shot
backfill from property_details.listing_events for pre-trigger history.
Tax reassessment forecast NC · Resets to sale price
- Current annual tax
- $405 · $34/mo
- Projected year-2 tax
- $1,312 · $109/mo
- Expected delta
- +$907/yr (+$76/mo · 223.6%)
ⓘ Screening estimate from a state-policy table — verify with the county assessor before closing.
Climate risk First Street
- Flood 1/10 Low FEMA zone X (unshaded) · 0% chance over 30 yrs
- Wildfire 4/10 Moderate
- Heat 5/10 Major 7 d/yr ≥103°F today · 16 d/yr by 30 yrs out
- Wind 4/10 Moderate 10% chance of damaging wind over 30 yrs
- Air quality 2/10 Low 1 unhealthy d/yr today · 2 by 30 yrs out
Nearby sold comps map
Loading sold comps map…
Walkable amenities ~0.75 mi
Loading nearby amenities…
Taxation est. · year 1
- Rental income
- $23,240
- − Mortgage interest
- −$8,962
- − Property taxes
- −$405
- − Insurance
- −$800
- − Repairs & maintenance
- −$1,859
- − Management
- −$1,859
- − Depreciation
- −$4,655
- Taxable income
- $4,699
- Est. tax owed @ 24.0%
- −$1,128
- After-tax cash flow
- $5,957/yr
For passive investors: Depreciation is non-cash, so a rental often shows a tax loss while cash-flowing — sheltering income. Rental losses are passive: they offset passive income freely, and up to $25,000/yr can offset ordinary (W-2) income if you actively participate and your MAGI is under $100k (phasing out to $0 by $150k); unused losses carry forward. On sale, claimed depreciation is recaptured at up to 25%, and gains may owe capital-gains tax (a 1031 exchange can defer both). Figures are a year-1 estimate at your 24.0% rate — not tax advice; consult a CPA.
Schools (NCES district)
- District
- Mooresville Graded School District
- NCES district ID
- 3703120
- Math proficiency
- 51% ▼ -3.00%
- Reading proficiency
- 55% ▬ 0.00%
- Median HH income
- $54,800
- Composite
- 45.72/100
- National rank
- #2574
- State rank
- #49 of 178 in NC
Livability — Mooresville
- Score
- 73/100
- State rank
- #66
- US rank
- #5026
Category grades
Schools grade is shown separately in the Schools card above.
Census & demographics
- County
- Iredell County · 182,638 people
- City population
- 92,370
- Metro
- Charlotte-Concord-Gastonia, NC-SC
- Population (ZIP)
- 43,544
- Household income
- $87,787
- Rent vs Own
- Severe rent burden
- 803.0
Population outlook (Iredell County) Hauer SSP2
- Today (2025)
- 194,510 people
- By 2030
- 206,171 · +6.0%
- By 2040
- 227,781 · +17.1%
- By 2050
- 245,102 · +26.0%
- By 2075
- 280,896 · +44.4%
- By 2100
- 294,375 · +51.3%
Race, ethnicity, and origin ACS 2023
- Neighborhood character
- Predominantly White (77%)
- Race & ethnicity
- White 77% Black 10% Hispanic / Latino 6% Two or more races 6% Asian 2%
- Hispanic origin (detail)
- Mexican 2% Puerto Rican 1%
- Common ancestry
- Iranian 3% Lithuanian 3% Romanian 3%
- Foreign-born
- 6% · Canada, Vietnam
- Languages at home
- 93% English-only · Spanish 4% Other Asian/Pacific 1% Vietnamese 1%
Political lean MEDSL · Iredell
- 2024 margin
- Solid R (+32.6) · D 33.2% · R 65.8%
- 2008→2024 swing
- -8.2pp toward R · 2008: -24.4pp · 2024: -32.6pp
- All cycles
- 2024: R+32.6 2020: R+32.4 2016: R+36.8 2012: R+30.5 2008: R+24.4
Not yet ingested
- Civics
- —
Market trends
- HPI YoY
- ▼ -135.96%
- Current HPI
- 246.6181
- Rent YoY
- ▲ 1.58%
- Metro
- Charlotte-Concord-Gastonia, NC-SC
- State GDP YoY
- ▲ 3.28%
- F500 in state
- 26
Industry mix (Fortune 500 HQ in NC)
| Industry | F500 HQs | Revenue |
|---|---|---|
| Financial Services | 2 | $213B |
|
||
| Retail | 2 | $95B |
|
||
| Industrial Conglomerate | 1 | $38B |
|
||
| Metals / Steel | 1 | $35B |
|
||
| Utilities | 1 | $30B |
|
||
| Industrial Machinery | 1 | $19B |
|
||
Price history
+1378.3% since first listed9 events — show timeline
- 2026-06-05 Listed $170,000 CANOPYMLS as Distributed by MLS Grid
- 2023-09-07 Sold (Public Records) $120,000 Public Records
- 2023-09-07 Sold (MLS) $119,900 CANOPYMLS as Distributed by MLS Grid
- 2023-09-06 Pending — CANOPYMLS as Distributed by MLS Grid
- 2023-07-24 Contingent — CANOPYMLS as Distributed by MLS Grid
- 2023-07-19 Price Changed $119,900 CANOPYMLS as Distributed by MLS Grid
- 2023-07-07 Listed $149,900 CANOPYMLS as Distributed by MLS Grid
- 2022-03-10 Sold (Public Records) $13,000 Public Records
- 1993-07-01 Sold (Public Records) $11,500 Public Records
Property tax history
+15.2%/yrLatest (2025): $405 · +0.0% YoY. Source: county tax records.
Cash-flow waterfall
monthlySold comps — $/sqft
last 12 mo · ≤1 miLoading sold comps…