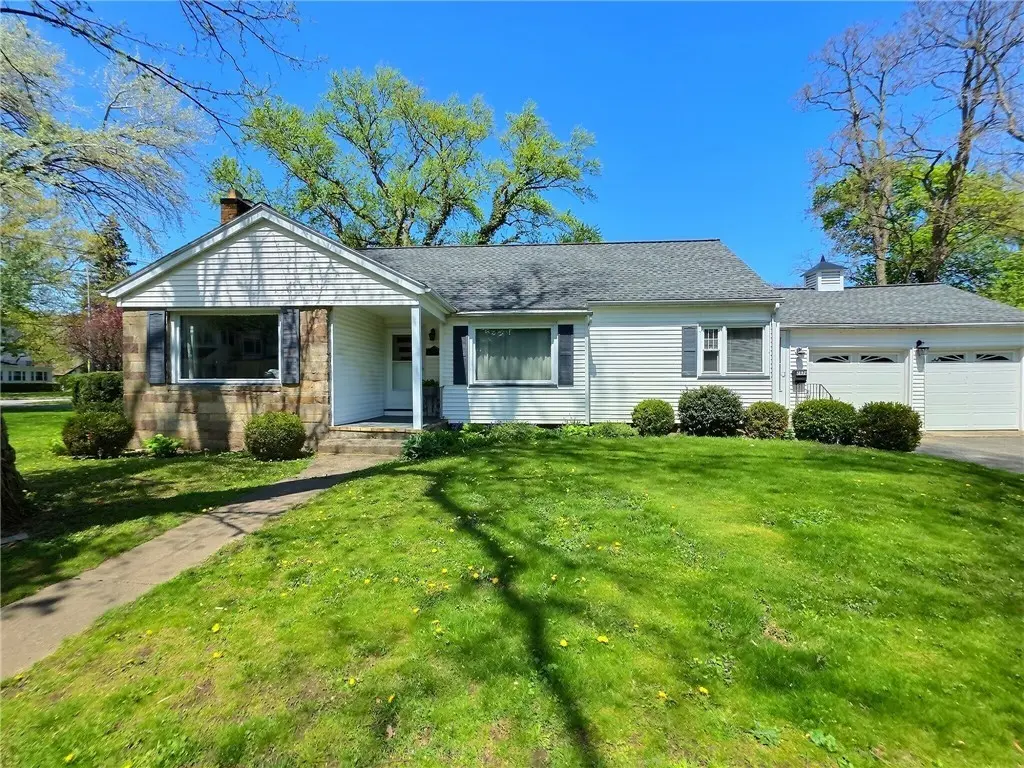
2826 Saint Paul Blvd · Irondequoit, NY
Flood risk 1/10 · Minimal
- FEMA flood zone
- X (unshaded)
- Chance of flooding over 30 yrs
- 0.0%
- Est. flood insurance / yr
- $473 – $860
Fire risk 1/10 · Minimal
- Est. fire insurance / yr
- $691 – $1,283
Heat risk 2/10 · Minimal
- Hot days now (above 96°F)
- 7 days/yr
- Hot days in 30 yrs
- 15 days/yr
Wind risk 1/10 · Minimal
- Chance of severe wind over 30 yrs
- —
Air-quality risk 2/10 · Minimal
- Unhealthy air days now
- 1 days/yr
- Unhealthy air days in 30 yrs
- 2 days/yr
Risk factors via First Street. Map © Google.
Why this score? — see what drove the D+ grade
The composite is a weighted blend of 9 inputs, each scored 0–100. Each bar is that input's sub-score; the figure is the points it added to the 100-point composite (weight × sub-score).
- ARV discount +15.0/15.0
- Cash flow +11.4/30.0
- Schools +6.2/10.0
- 1% rule +4.8/10.0
- Livability +4.0/5.0
- DSCR +3.3/10.0
- Rent growth +2.5/5.0
- Condition / age +2.5/5.0
- Appreciation +0.0/10.0
$234,900
🖨 Deal sheet (PDF) 📄 Offer letter ✓ Due diligence
Listing remarks MLS
Meticulously maintained for your move-in pleasure! Prof appraised 6/21/2011 for $130,700. Square footage increased with remodeled den and addition of 2nd floor bdrm. Here's a list of NEW improvements: Tear-off roof, gutters, cupola, driveway, thermopane windows, glass block bsmt windows, deck with vinyl privacy fence, garage doors, exterior storm doors, 150 amp circuit breakers, interior 6-panel doors, exterior lights, kitchen floor, countertops, backsplash, sink, faucet & plumbing, bathroom vanity, faucet, plumbing & ceramic floor, and foyer ceramic floor. Basic star $777.90. Be the proud owner!
Key facts
- Front sunroom
- Large living room
- Hardwood floors
Tags
Property features AI
Exterior
- Parking: Attached 2-car garage with garage door opener
- Utilities: Electricity connected (circuit breakers); Public water connected; Sewer connected
- Home design: Single-story home; Resale property; Shingle roof with asphalt architectural shingles
- Construction: Vinyl siding; Block foundation; Copper plumbing; Blown-in insulation; Insulated attic/crawl hatchway(s)
- Exterior features: Blacktop driveway; Deck; Corner lot; Rectangular lot (approx. 72 x 220, 0.33 acre)
Interior
- Kitchen: Electric cooktop; Electric oven; Electric range; Dishwasher; Refrigerator; Eat-in kitchen
- Bedrooms: Two main-level bedrooms
- Flooring: Hardwood; Laminate; Varies
- Bathrooms: Two full bathrooms (both on the main level)
- Heating & cooling: Gas heating; Central air conditioning
- Interior features: Ceiling fans; Entrance foyer; Eat-in kitchen; Separate/formal living room; Main level primary bedroom; Bath in primary bedroom; Workshop; Thermal windows
- Laundry & utility: Washer and dryer; Laundry in basement
Neighborhood map
What this means for you Summary
Snapshot
- This is a 3-bed/1.0-bath single-family listed at $235k.
Deal economics
- At list price, monthly cash flow is $-82 ($-979/yr) — negative.
- To cash-flow at today's rent, offer at most $220k (6.1% below list).
- To meet the 1% rule (rent ≥ 1% of price), the offer needs to be $229k (2.3% below list).
- Recommended offer: $220k (6.1% below list) — sets the bar for cash-flow.
- Cap rate 5.9% vs local median 4.5% in Irondequoit — top-decile yield for the area; either an underpriced asset or a hidden risk that comps aren't pricing in. Stress-test before assuming the spread holds.
Location & tenants
- Location reads 81/100 on livability (#92 in NY, #1,414 nationally) — a professional / high-income tenant draw. Strengths: housing A+, health & safety A+, crime B+; Watch: amenities F.
- West Irondequoit Central School District (suburban): math 73% / reading 70% proficiency, ranked #126 of 590 in NY (top 21%) — strong family-tenant draw, lease renewals of 3-5y typical; only 18% free/reduced lunch — higher-income household profile.
- Zoned schools: Irondequoit High School (math 96% / reading 64%, grade A, #509 of 1,100 statewide, top 46%, 1,163 students, 33% FRL).
- Market conditions: 104 active listings in the ZIP; 7 comparable units currently listed for rent nearby; rentals leasing fast (median 5d on market — plan ~1-2 weeks tenant-placement turnaround); solid renter incomes; 1,169 units permitted in Monroe County in 2024 (591 in 5+ unit buildings).
- This rent runs 31% of the median local income ($90k/yr) — at the standard rent-burdened threshold; future hikes will face affordability resistance.
Forward outlook
- Local home prices are declining (-3.0%/yr); year-one equity from $2k of loan paydown is wiped out by about $7k of value loss. Plan a longer hold.
- Monroe County population projected to shrink 6% by 2050 — rents likely to lag national; underwrite the cash flow, not the appreciation.
Negotiation context
- Only 13 days on market — expect competitive offers; lowballing is unlikely to land.
- 2 sale attempts since 14y ago with the ask held roughly flat each time — persistent listings suggest the price (not the market) is what's stuck; bring a comps-based counter.
- Current owner paid $130k; list at $235k implies a 81% gain — meaningful room to come down on a strong offer.
Risks & watch-outs
- Watch-outs: property tax is 2.9% of price; built in 1951 — expect roof / HVAC / electrical / plumbing capex.
Questions for the listing agent
- What do current leases actually rent for vs. the listed asking? Can we see a recent rent roll and the last 12 months of T-12 income?
- Built in 1951 — when were the roof, HVAC, electrical panel, plumbing, and water heater last replaced?
- Property tax is high relative to price — has the assessment been appealed recently, and will the sale trigger a re-assessment?
- Is there a deadline driving the sale (1031 exchange, divorce, estate, relocation)? That informs how much negotiation room exists.
- Schools are B-rated — typically a magnet for longer-tenancy family renters. What's the average tenant stay here, and is there a school-zone premium baked into asking?
- The area grade is low — what's the realistic commute time and amenity access for the typical tenant pool here? Any planned neighborhood developments (good or bad) we should know about?
- What's the average days-on-market for RENTAL listings here right now (not sales)? A rising rental-DOM trend means longer vacancies and softer asking-rent achievability than the comps imply.
- What's the recent tenant-quality profile in this submarket — average credit score on applications, eviction rate, late-payment / NSF rate, and stable-employment percentage? A property-management company in the area should have these aggregated.
- How much new for-sale + rental construction is in the pipeline within 1–3 miles? Heavy new supply typically softens prices + rents 12–24 months out; constrained supply supports both.
Investment metrics
- 1% rule
- 0.98% ✗
- Cap rate
- 5.88%
- Cash-on-cash
- -1.49%
- DSCR
- 0.93
- GRM
- 8.5
CMA / ARV
- ARV (on-the-fly)
- $304,857
- Comps found
- 12
Show comp detail 12 sales within ~0.75 mi
| Address | Dist | Beds/Ba | Sqft | Sold | Price | $/sf | Match |
|---|---|---|---|---|---|---|---|
| 105 Carol Dr | 0.58mi | 3/1.5 | 1,602 (-1%) | 1mo | $250,000 | $156 | 69 |
| 361 Barry Rd | 0.59mi | 3/1.5 | 1,630 (+1%) | 1mo | $317,500 | $195 | 68 |
| 79 Maplehurst Rd | 0.45mi | 3/1.5 | 1,520 (-6%) | 1mo | $250,000 | $164 | 67 |
| 163 Rawlinson Rd | 0.46mi | 3/1.0 | 1,474 (-9%) | 2mo | $290,000 | $197 | 63 |
| 56 Northwick Dr | 0.66mi | 3/2.5 | 1,613 (0%) | 2mo | $360,000 | $223 | 61 |
| 650 Winona Blvd | 0.49mi | 4/2.0 (+1) | 1,692 (+5%) | 2mo | $275,000 | $163 | 59 |
| 112 Maplehurst Rd | 0.39mi | 3/1.5 | 1,386 (-14%) | 1mo | $255,000 | $184 | 55 |
| 226 Barry Rd | 0.51mi | 4/2.0 (+1) | 1,460 (-10%) | 1mo | $300,000 | $205 | 51 |
| 44 Maplehurst Rd | 0.47mi | 2/1.0 (-1) | 1,415 (-12%) | 2mo | $267,000 | $189 | 51 |
| 556 Wimbledon Rd | 0.62mi | 3/2.5 | 1,420 (-12%) | 1mo | $325,000 | $229 | 44 |
| 197 Barry Rd | 0.53mi | 4/1.5 (+1) | 1,382 (-14%) | 0mo | $235,000 | $170 | 44 |
| 2036 N Clinton Ave | 0.69mi | 3/2.0 | 1,816 (+13%) | 1mo | $275,000 | $151 | 42 |
Match score weights: distance 35% · size 25% · config 20% · recency 20%. Top-matched comps best support the ARV.
Projected returns pro-forma
-3.0% appreciation · 3.0% rent growth · sell at horizon
- IRR
- -18.6%
- Equity multiple
- 0.35×
- Total profit
- $-43,059
- Equity at exit
- $35,024
- IRR
- -10.9%
- Equity multiple
- 0.34×
- Total profit
- $-43,368
- Equity at exit
- $20,310
Cash invested: $65,772 (down + closing). Projections, not guarantees.
Landlord ↔ Tenant lean methodology
- Overall (STATE)
- 15 Strongly Tenant-Friendly
- State New York
- 15 Strongly Tenant-Friendly · D+10
- County
- — inherits STATE
- City
- — inherits STATE
ZIP-level market 14617
- Active inventory
- 104
- Price-to-rent
- 8.5×
Monthly cashflow live
- Estimated rent
- $2,295 high interval (Pro) →
- Mortgage (P&I)
- −$1,232
- Tax from tax record
- −$565 /mo · $6,778/yr
- Insurance
- −$98
- HOA
- −$0
- Vacancy / Maint / Mgmt
- −$482
- Net cashflow
- $-82
Break-even live
Sensitivity live
| Price | -10% $51 | -5% $-15 | +0% $-82 | +5% $-148 | +10% $-215 |
|---|---|---|---|---|---|
| Rent | -10% $-263 | -5% $-172 | +0% $-82 | +5% $9 | +10% $100 |
| Rate | -1.0pp $37 | -0.5pp $-22 | base $-82 | +0.5pp $-142 | +1.0pp $-204 |
UW: 25.0% down · 7.5% · 30yr · 1.5% tax · 5.0% vac · 8.0% maint · 8.0% mgmt
Financing live
Cash to close
- Down payment
- $58,725
- Closing costs
- $7,047
- Reserves months
- —
- Total cash needed
- —
Loan-product check · same deal, 3 products live
Conventional
25% down · 7.5% · 30yr
- Down + closing
- —
- Monthly P&I
- —
- Monthly cashflow
- —
- DSCR
- —
- Eligible?
- —
Personal DTI + credit; lowest rate.
DSCR
20% down · 8.5% · 30yr
- Down + closing
- —
- Monthly P&I
- —
- Monthly cashflow
- —
- DSCR
- —
- Eligible?
- —
No personal income docs; deal must DSCR.
Hard money
10% down · 12.0% · 12mo
- Down + closing
- —
- Monthly P&I
- —
- Monthly cashflow
- —
- DSCR
- —
- Eligible?
- —
Short-term bridge; refi at stabilization.
Rent comps 7 comps
| Address | Beds | Baths | Sqft | Rent | $/sqft | DOM | Units | Dist |
|---|---|---|---|---|---|---|---|---|
| 38 Elgrove Rd Rochester, NY | 4.0 | 1.5 | 1600 | $2,295 | $1.43 | 23d | 1 | 0.43mi |
| 83 Navarre Rd Rochester, NY | 3.0 | 2.0 | 1322 | $2,250 | $1.70 | 4d | 1 | 0.71mi |
| 148 Chestnut Hill Dr Rochester, NY | 3.0 | 2.0 | 1659 | $2,250 | $1.36 | 4d | 1 | 0.72mi |
| 39 Chelsea Rd Rochester, NY | 3.0 | 1.5 | 1108 | $2,350 | $2.12 | 25d | 1 | 0.86mi |
| 58 Fairview Cres Rochester, NY | 4.0 | 1.5 | 2194 | $3,600 | $1.64 | 4d | 1 | 1.26mi |
| 248 Flower City Park Rochester, NY | 3.0 | 1.0 | 1350 | $1,800 | $1.33 | 5d | 1 | 1.36mi |
| 235 Flower City Park Rochester, NY | 3.0 | 1.0 | 2000 | $1,360 | $0.68 | 45d | 1 | 1.38mi |
Listing history 7 events
-
2026-05-21status Pending
-
2026-05-18price $234,900
-
2026-05-07$244,900 Active
-
2013-02-20soldstatus $129,600
-
2013-02-19soldstatus $129,600 615-char remark
Show marketing remark (615 chars)
Meticulously maintained for your move-in pleasure! Prof appraised 6/21/2011 for $130,700. Square footage increased with remodeled den and addition of 2nd floor bdrm. Here's a list of NEW improvements: Tear-off roof, gutters, cupola, driveway, thermopane windows, glass block bsmt windows, deck with vinyl privacy fence, garage doors, exterior storm doors, 150 amp circuit breakers, interior 6-panel doors, exterior lights, kitchen floor, countertops, backsplash, sink, faucet & plumbing, bathroom vanity, faucet, plumbing & ceramic floor, and foyer ceramic floor. Basic star $777.90. Be the proud owner!
-
2012-12-04$129,900 615-char remark
Show marketing remark (615 chars)
Meticulously maintained for your move-in pleasure! Prof appraised 6/21/2011 for $130,700. Square footage increased with remodeled den and addition of 2nd floor bdrm. Here's a list of NEW improvements: Tear-off roof, gutters, cupola, driveway, thermopane windows, glass block bsmt windows, deck with vinyl privacy fence, garage doors, exterior storm doors, 150 amp circuit breakers, interior 6-panel doors, exterior lights, kitchen floor, countertops, backsplash, sink, faucet & plumbing, bathroom vanity, faucet, plumbing & ceramic floor, and foyer ceramic floor. Basic star $777.90. Be the proud owner!
-
1997-07-30soldstatus $71,500
ⓘ Source: listings_history table (triggers on properties + properties_extension) + one-shot
backfill from property_details.listing_events for pre-trigger history.
Tax reassessment forecast NY · Partial reset (capped growth)
- Current annual tax
- $6,778 · $565/mo
- Projected year-2 tax
- $6,778 · $565/mo
- Expected delta
- $0/yr ($0/mo · 0.0%)
ⓘ Screening estimate from a state-policy table — verify with the county assessor before closing.
Climate risk First Street
- Flood 1/10 Low FEMA zone X (unshaded) · 0% chance over 30 yrs
- Wildfire 1/10 Low
- Heat 2/10 Low 7 d/yr ≥96°F today · 15 d/yr by 30 yrs out
- Wind 1/10 Low
- Air quality 2/10 Low 1 unhealthy d/yr today · 2 by 30 yrs out
Nearby sold comps map
Loading sold comps map…
Walkable amenities ~0.75 mi
Loading nearby amenities…
Taxation est. · year 1
- Rental income
- $27,538
- − Mortgage interest
- −$13,158
- − Property taxes
- −$6,778
- − Insurance
- −$1,174
- − Repairs & maintenance
- −$2,203
- − Management
- −$2,203
- − Depreciation
- −$6,833
- Taxable loss
- −$4,812
- Est. tax savings @ 24.0%
- +$1,155
- After-tax cash flow
- $176/yr
For passive investors: Depreciation is non-cash, so a rental often shows a tax loss while cash-flowing — sheltering income. Rental losses are passive: they offset passive income freely, and up to $25,000/yr can offset ordinary (W-2) income if you actively participate and your MAGI is under $100k (phasing out to $0 by $150k); unused losses carry forward. On sale, claimed depreciation is recaptured at up to 25%, and gains may owe capital-gains tax (a 1031 exchange can defer both). Figures are a year-1 estimate at your 24.0% rate — not tax advice; consult a CPA.
Schools (NCES district)
- District
- West Irondequoit Central School District
- NCES district ID
- 3615390
- Math proficiency
- 73% ▲ 3.00%
- Reading proficiency
- 70% ▲ 5.00%
- Median HH income
- $60,218
- Composite
- 61.61/100
- National rank
- #748
- State rank
- #126 of 590 in NY
Livability — Irondequoit
- Score
- 81/100
- State rank
- #92
- US rank
- #1414
Category grades
Schools grade is shown separately in the Schools card above.
Census & demographics
- Census place
- Irondequoit, NY
- County
- Monroe County · 674,131 people
- City population
- 74,252
- Metro
- Rochester, NY
- Population (ZIP)
- 21,788
- Household income
- $90,192
- Rent vs Own
- Severe rent burden
- 426.0
Population outlook (Monroe County) Hauer SSP2
- Today (2025)
- 759,460 people
- By 2030
- 757,154 · -0.3%
- By 2040
- 740,644 · -2.5%
- By 2050
- 714,443 · -5.9%
- By 2075
- 645,883 · -15.0%
- By 2100
- 547,084 · -28.0%
Race, ethnicity, and origin ACS 2023
- Neighborhood character
- Predominantly White (85%)
- Race & ethnicity
- White 85% Hispanic / Latino 8% Two or more races 6% Black 4%
- Hispanic origin (detail)
- Puerto Rican 4%
- Common ancestry
- Romanian 6% Iranian 3% Lithuanian 3%
- Foreign-born
- 4% · Canada
- Languages at home
- 93% English-only · Spanish 4% Other Indo-European 1% Russian/Polish/Slavic 1%
Political lean MEDSL · Monroe
- 2024 margin
- D (+19.1) · D 59.5% · R 40.5%
- 2008→2024 swing
- +1.4pp toward D · 2008: 17.7pp · 2024: 19.1pp
- All cycles
- 2024: D+19.1 2020: D+21.0 2016: D+14.1 2012: D+17.4 2008: D+17.7
Not yet ingested
- Civics
- —
Market trends
- HPI YoY
- ▼ -148.22%
- Current HPI
- 263.9973
- Rent YoY
- —
- Metro
- Rochester, NY
- State GDP YoY
- ▲ 2.60%
- F500 in state
- 92
Industry mix (Fortune 500 HQ in NY)
| Industry | F500 HQs | Revenue |
|---|---|---|
| Financial Services | 10 | $950B |
|
||
| Consumer Goods | 9 | $162B |
|
||
| Insurance | 4 | $225B |
|
||
| Telecommunications | 2 | $144B |
|
||
| Pharmaceuticals | 2 | $112B |
|
||
| Media / Entertainment | 2 | $69B |
|
||
Price history
+228.5% since first listed7 events — show timeline
- 2026-05-21 Pending — UNYREIS
- 2026-05-18 Price Changed $234,900 UNYREIS
- 2026-05-07 Listed $244,900 UNYREIS
- 2013-02-20 Sold (Public Records) $129,600 Public Records
- 2013-02-19 Sold (MLS) $129,600 UNYREIS
- 2012-12-04 Listed $129,900 UNYREIS
- 1997-07-30 Sold (Public Records) $71,500 Public Records
Property tax history
+2.2%/yrLatest (2025): $6,778 · +1.3% YoY. Source: county tax records.
Cash-flow waterfall
monthlySold comps — $/sqft
last 12 mo · ≤1 miLoading sold comps…