327 Bluebell Way · Moncks Corner, SC
Flood risk No data
- FEMA flood zone
- —
- Chance of flooding over 30 yrs
- —
- Est. flood insurance / yr
- —
Fire risk No data
- Est. fire insurance / yr
- —
Heat risk No data
- Hot days now (above threshold)
- —
- Hot days in 30 yrs
- —
Wind risk No data
- Chance of severe wind over 30 yrs
- —
Air-quality risk No data
- Unhealthy air days now
- —
- Unhealthy air days in 30 yrs
- —
Risk factors via First Street. Map © Google.
Why this score? — see what drove the F grade
The composite is a weighted blend of 9 inputs, each scored 0–100. Each bar is that input's sub-score; the figure is the points it added to the 100-point composite (weight × sub-score).
- Cash flow +8.5/30.0
- ARV discount +7.5/15.0
- Schools +3.6/10.0
- Livability +3.4/5.0
- Rent growth +3.2/5.0
- 1% rule +2.6/10.0
- Condition / age +2.5/5.0
- DSCR +2.3/10.0
- Appreciation +0.0/10.0
$310,300
🖨 Deal sheet 📄 Offer letter ✓ Due diligence
Listing remarks
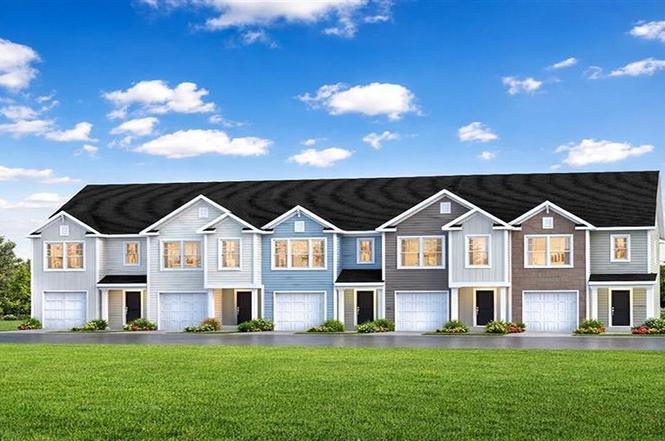
Special Interest Rate with Closing Cost Assistance paid for by BuilderWelcome to 327 Bluebell Way, located in the Carolina Groves community of Moncks Corner a neighborhood known for its quiet streets, natural surroundings, and welcoming atmosphere. Here, life moves at a comfortable pace while still keeping you close to everyday essentials, local schools, and convenient access to surrounding areas. This home features the Davis a thoughtfully designed two-story home offering 3 bedrooms, 2.5 bathrooms, and a 1-car garage with a bright, open-concept layout perfect for modern living. The main level features a spacious family room that flows seamlessly into the dining area and kitchen, creating a
Key facts
- 2 garage spots
- Built 2025
- Listed 65 days
Property features AI
Finance
- HOA & community: Association fees billed annually
Exterior
- Parking: 2-car garage
- Utilities: Public sewer
- Home design: Residential townhouse; Two levels; New construction; Single-family attached
- Construction: Townhouse construction; New construction
- Exterior features: Pond or pond site; Lot under 0.5 acre; Fiberglass roof
Interior
- Kitchen: Dishwasher; Gas range; Microwave; Pantry; Kitchen island; Eat-in kitchen
- Bedrooms: 3 bedrooms with the primary bedroom on the lower level
- Flooring: Vinyl
- Bathrooms: 2.5 bathrooms
- Heating & cooling: Natural gas heating; Central air conditioning
- Interior features: Smooth ceilings; Kitchen island; Walk-in closets; Eat-in kitchen; Family room; Living/dining combo; Pantry
- Laundry & utility: Washer hookup; Tankless water heater
Neighborhood map
What this means for you Summary
Snapshot
- This is a 3-bed/2.5-bath land listed at $310k.
Deal economics
- At list price, monthly cash flow is $-272 ($-3k/yr) — negative.
- To cash-flow at today's rent, offer at most $271k (12.7% below list).
- To meet the 1% rule (rent ≥ 1% of price), the offer needs to be $237k (23.6% below list).
- Recommended offer: $237k (23.6% below list) — sets the bar for 1% rule.
- Cap rate 5.2% vs local median 4.3% in Moncks Corner — meaningfully above typical; check what's discounted (condition, days-on-market, listing class) to confirm the premium yield is real.
Location & tenants
- Location reads 67/100 on livability (#99 in SC) — a middle-class / working-renter tenant base. Strengths: housing A+, health & safety A+, cost of living A; Watch: crime C-, amenities F, commute F.
- Berkeley 01 (suburban): math 35% / reading 48% proficiency, ranked #30 of 80 in SC (top 38%) — families likely to look elsewhere, expect single-tenant / working-renter base with shorter leases.
- Zoned schools: Whitesville Elementary (math 34% / reading 39%, grade F, #328 of 597 statewide, top 55%, 1,031 students, 62% FRL); Berkeley Middle (math 19% / reading 32%, grade F, #162 of 229 statewide, top 71%, 1,403 students, 57% FRL); Berkeley High (math 36% / reading 83%, grade C+, #110 of 196 statewide, top 58%, 1,776 students, 50% FRL).
- Market conditions: Rents rising (+2.8%/yr); 642 active listings in the ZIP; 7 comparable units currently listed for rent nearby; rentals at typical pace (median 14d on market — plan ~3-4 weeks tenant-placement turnaround); solid renter incomes; 3,183 units permitted in Berkeley County in 2024 (580 in 5+ unit buildings).
- This rent runs 34% of the median local income ($83k/yr) — at the standard rent-burdened threshold; future hikes will face affordability resistance.
Forward outlook
- Local home prices are declining (-3.0%/yr); year-one equity from $2k of loan paydown is wiped out by about $9k of value loss. Plan a longer hold.
- Berkeley County population projected at +48% by 2050 — long-run rental-demand tailwind backs the buy-and-hold thesis.
Negotiation context
- It's been on market 65 days — a 6% lower offer ($292k) is reasonable based on typical stale-listing flexibility.
- 2 sale attempts with the ask held roughly flat each time — persistent listings suggest the price (not the market) is what's stuck; bring a comps-based counter.
Questions for the listing agent
- What do current leases actually rent for vs. the listed asking? Can we see a recent rent roll and the last 12 months of T-12 income?
- It's been on market 65 days. Have you received any prior offers? Is the seller open to a 24% concession, seller financing, or rate buy-down credit?
- Why hasn't it sold? Are there any deal-killer items the seller is aware of (foundation, flood, title, zoning, code violations)?
- Is there a deadline driving the sale (1031 exchange, divorce, estate, relocation)? That informs how much negotiation room exists.
- Schools are D-rated, which usually means shorter tenancies and higher turnover. Who's the typical renter profile here, and what's been the actual vacancy rate?
- The area grade is low — what's the realistic commute time and amenity access for the typical tenant pool here? Any planned neighborhood developments (good or bad) we should know about?
- What's the average days-on-market for RENTAL listings here right now (not sales)? A rising rental-DOM trend means longer vacancies and softer asking-rent achievability than the comps imply.
- What's the recent tenant-quality profile in this submarket — average credit score on applications, eviction rate, late-payment / NSF rate, and stable-employment percentage? A property-management company in the area should have these aggregated.
- How much new for-sale + rental construction is in the pipeline within 1–3 miles? Heavy new supply typically softens prices + rents 12–24 months out; constrained supply supports both.
Investment metrics
- 1% rule
- 0.76% ✗
- Cap rate
- 5.24%
- Cash-on-cash
- -3.76%
- DSCR
- 0.83
- GRM
- 10.9
CMA / ARV
No comps found within radius.
Projected returns pro-forma
-3.0% appreciation · 2.77% rent growth · sell at horizon
- IRR
- -22.9%
- Equity multiple
- 0.22×
- Total profit
- $-68,129
- Equity at exit
- $46,267
- IRR
- -17.8%
- Equity multiple
- 0.04×
- Total profit
- $-83,739
- Equity at exit
- $26,829
Cash invested: $86,884 (down + closing). Projections, not guarantees.
Landlord ↔ Tenant lean methodology
- Overall (STATE)
- 90 Strongly Landlord-Friendly
- State South Carolina
- 90 Strongly Landlord-Friendly · R+6
- County
- — inherits STATE
- City
- — inherits STATE
ZIP-level market 29461
- Home prices YoY
- -13.9%
- Rents YoY
- 2.8%
- Active inventory
- 642
- Price-to-rent
- 10.9×
Monthly cashflow live
- Estimated rent
- $2,370 high interval (Pro) →
- Mortgage (P&I)
- −$1,627
- Tax est. 1.5%
- −$388 /mo · $4,654/yr
- Insurance
- −$129
- HOA
- −$0
- Vacancy / Maint / Mgmt
- −$498
- Net cashflow
- $-272
Break-even live
UW: 25.0% down · 7.5% · 30yr · 1.5% tax · 5.0% vac · 8.0% maint · 8.0% mgmt
Financing live
Cash to close
- Down payment
- $77,575
- Closing costs
- $9,309
- Reserves months
- —
- Total cash needed
- —
Loan-product check · same deal, 3 products live
Conventional
25% down · 7.5% · 30yr
- Down + closing
- —
- Monthly P&I
- —
- Monthly cashflow
- —
- DSCR
- —
- Eligible?
- —
Personal DTI + credit; lowest rate.
DSCR
20% down · 8.5% · 30yr
- Down + closing
- —
- Monthly P&I
- —
- Monthly cashflow
- —
- DSCR
- —
- Eligible?
- —
No personal income docs; deal must DSCR.
Hard money
10% down · 12.0% · 12mo
- Down + closing
- —
- Monthly P&I
- —
- Monthly cashflow
- —
- DSCR
- —
- Eligible?
- —
Short-term bridge; refi at stabilization.
Rent comps 7 comps
| Address | Beds | Baths | Sqft | Rent | $/sqft | DOM | Units | Dist |
|---|---|---|---|---|---|---|---|---|
| 174 Yarrow Way Moncks Corner, SC | 3.0 | 2.5 | 1524 | $2,000 | $1.31 | 14d | 1 | 0.07mi |
| 214 Wild Strawberry Ln Moncks Corner, SC | 4.0 | 2.5 | 2164 | $2,495 | $1.15 | 14d | 1 | 0.18mi |
| 214 Wild Strawberry Ln Moncks Corner, SC | 4.0 | 2.5 | 2164 | $2,495 | $1.15 | 10d | 1 | 0.18mi |
| 204 Wild Strawberry Ln Moncks Corner, SC | 4.0 | 2.5 | 2164 | $2,400 | $1.11 | 23d | 1 | 0.19mi |
| 191 Emerald Isle Dr Moncks Corner, SC | 3.0 | 2.5 | 1614 | $2,149 | $1.33 | 23d | 1 | 0.86mi |
| 121 Marigny St Moncks Corner, SC | 3.0–4.0 | 2.5 | 1875 | $2,230 | $1.19 | 2d | 9 | 1.36mi |
| 391 State Road S-8-978 Moncks Corner, SC | 1.0–3.0 | 1.0–2.0 | 1061 | $1,626 | $1.53 | 23d | 1 | 1.47mi |
Listing history 22 events
-
2026-06-18days on market $310,300 Active 65 DOM
-
2026-06-17days on market $310,300 Active 64 DOM
-
2026-06-16days on market $310,300 Active 63 DOM
-
2026-06-15days on market $310,300 Active 62 DOM
-
2026-06-13days on market $310,300 Active 60 DOM
-
2026-06-13days on market $310,300 Active 59 DOM
-
2026-06-10days on market $310,300 Active 57 DOM
-
2026-06-09days on market $310,300 Active 56 DOM
-
2026-06-08days on market $310,300 Active 55 DOM
-
2026-06-07days on market $310,300 Active 54 DOM
-
2026-06-05days on market $310,300 Active 51 DOM
-
2026-06-03days on market $310,300 Active 50 DOM
-
2026-06-03days on market $310,300 Active 49 DOM
-
2026-06-01days on market $310,300 Active 48 DOM
-
2026-05-31days on market $310,300 Active 47 DOM
-
2026-05-18price $310,300
-
2026-05-03price $323,740
-
2026-04-16price $321,995
-
2026-04-14status Active
-
2026-01-13historical
-
2026-01-13$319,965
-
2024-05-28soldstatus $8,265,000
ⓘ Source: listings_history table (triggers on properties + properties_extension) + one-shot
backfill from property_details.listing_events for pre-trigger history.
Nearby sold comps map
Loading sold comps map…
Walkable amenities ~0.75 mi
Loading nearby amenities…
Taxation est. · year 1
- Rental income
- $28,439
- − Mortgage interest
- −$17,382
- − Property taxes
- −$4,654
- − Insurance
- −$1,552
- − Repairs & maintenance
- −$2,275
- − Management
- −$2,275
- − Depreciation
- −$9,027
- Taxable loss
- −$8,726
- Est. tax savings @ 24.0%
- +$2,094
- After-tax cash flow
- $-1,172/yr
For passive investors: Depreciation is non-cash, so a rental often shows a tax loss while cash-flowing — sheltering income. Rental losses are passive: they offset passive income freely, and up to $25,000/yr can offset ordinary (W-2) income if you actively participate and your MAGI is under $100k (phasing out to $0 by $150k); unused losses carry forward. On sale, claimed depreciation is recaptured at up to 25%, and gains may owe capital-gains tax (a 1031 exchange can defer both). Figures are a year-1 estimate at your 24.0% rate — not tax advice; consult a CPA.
Schools (NCES district)
- District
- Berkeley 01
- NCES district ID
- 4501170
- Math proficiency
- 35% ▼ -8.00%
- Reading proficiency
- 48% ▼ -2.00%
- Median HH income
- $52,724
- Composite
- 35.95/100
- National rank
- #4799
- State rank
- #30 of 80 in SC
Livability — Moncks Corner
- Score
- 67/100
- State rank
- #99
- US rank
- #10812
Category grades
Schools grade is shown separately in the Schools card above.
Census & demographics
- Census place
- Moncks Corner, SC
- County
- Berkeley County · 198,768 people
- City population
- 43,816
- Metro
- Charleston-North Charleston, SC
- Population (ZIP)
- 43,816
- Household income
- $82,666
- Rent vs Own
- Severe rent burden
- 815.0
Population outlook (Berkeley County) Hauer SSP2
- Today (2025)
- 254,184 people
- By 2030
- 279,677 · +10.0%
- By 2040
- 329,379 · +29.6%
- By 2050
- 375,557 · +47.8%
- By 2075
- 476,740 · +87.6%
- By 2100
- 535,945 · +110.8%
Race, ethnicity, and origin ACS 2023
- Neighborhood character
- Majority White (61%)
- Race & ethnicity
- White 61% Black 29% Hispanic / Latino 6% Two or more races 5%
- Hispanic origin (detail)
- Mexican 2% Puerto Rican 2%
- Common ancestry
- Lithuanian 1% Slovak 1% Romanian 1%
- Foreign-born
- 3% · Canada
- Languages at home
- 96% English-only · Spanish 3%
Political lean MEDSL · Berkeley
- 2024 margin
- R (+16.3) · D 41.1% · R 57.4% · Other 1.4%
- 2008→2024 swing
- -3.2pp toward R · 2008: -13.1pp · 2024: -16.3pp
- All cycles
- 2024: R+16.3 2020: R+11.7 2016: R+17.4 2012: R+18.9 2008: R+13.1
Not yet ingested
- Civics
- —
Market trends
- HPI YoY
- ▼ -52.95%
- Current HPI
- 328.7212
- Rent YoY
- ▲ 2.77%
- Metro
- Charleston-North Charleston, SC
- State GDP YoY
- ▲ 4.51%
- F500 in state
- 2
Industry mix (Fortune 500 HQ in SC)
| Industry | F500 HQs | Revenue |
|---|---|---|
| Packaging | 1 | $7B |
|
||
Price history
-96.2% since first listed7 events — show timeline
- 2026-05-18 Price Changed $310,300 Charleston Trident MLS
- 2026-05-03 Price Changed $323,740 Charleston Trident MLS
- 2026-04-16 Price Changed $321,995 Charleston Trident MLS
- 2026-04-14 Relisted — Charleston Trident MLS
- 2026-01-13 Listing Removed — Charleston Trident MLS
- 2026-01-13 Listed $319,965 Charleston Trident MLS
- 2024-05-28 Sold (Public Records) $8,265,000 Public Records
Cash-flow waterfall
monthlySold comps — $/sqft
last 12 mo · ≤1 miLoading sold comps…