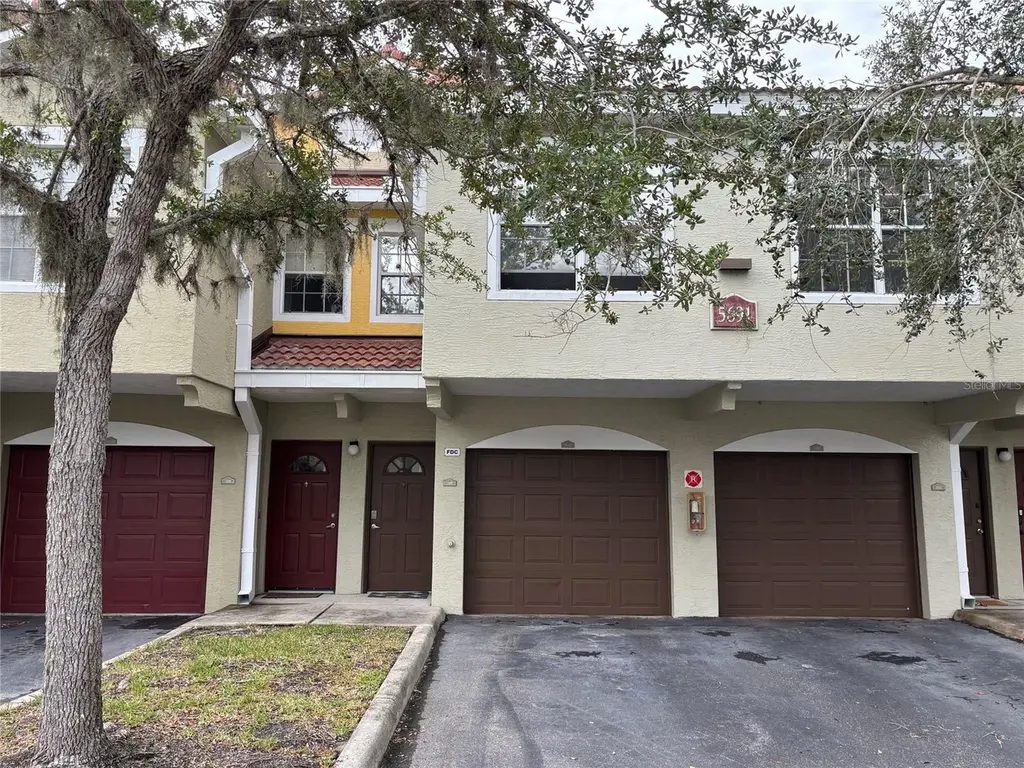
5691 Bentgrass Dr Unit 15-209 · The Meadows, FL
Flood risk 1/10 · Minimal
- FEMA flood zone
- X (unshaded)
- Chance of flooding over 30 yrs
- 0.0%
- Est. flood insurance / yr
- $507 – $1,088
Fire risk 4/10 · Minor
- Est. fire insurance / yr
- $947 – $1,759
Heat risk 10/10 · Severe
- Hot days now (above 107°F)
- 7 days/yr
- Hot days in 30 yrs
- 31 days/yr
Wind risk 10/10 · Severe
- Chance of severe wind over 30 yrs
- 99.0%
Air-quality risk 2/10 · Minimal
- Unhealthy air days now
- 1 days/yr
- Unhealthy air days in 30 yrs
- 1 days/yr
Risk factors via First Street. Map © Google.
Why this score? — see what drove the D- grade
The composite is a weighted blend of 9 inputs, each scored 0–100. Each bar is that input's sub-score; the figure is the points it added to the 100-point composite (weight × sub-score).
- ARV discount +14.2/15.0
- Schools +5.4/10.0
- Cash flow +5.3/30.0
- Rent growth +4.9/5.0
- 1% rule +3.5/10.0
- Livability +3.5/5.0
- Condition / age +2.5/5.0
- DSCR +0.0/10.0
- Appreciation +0.0/10.0
$259,000
🖨 Deal sheet (PDF) 📄 Offer letter ✓ Due diligence
Listing remarks MLS
LOCATION - LOCATION - LOCATION -- Granite counter tops, upgraded appliances, private wooded view from the 2nd floor lanai are just a few of the features that compliment this multi story townhouse style condo with a 1 car attached garage. Las Palmas is a resort style community located adjacent to Nathan Benderson Recreational Lake Park and the UTC MALL. The community offers 2 clubhouses, 2 heated pools, hot tub, gas grills, tennis court, playground and RV/Boat parking onsite. Easy I-75 access and abundant upscale shopping, dining and entertainment within 1 mile of community.
Key facts
- 2 clubhouses
- 2 heated pools
- Granite counter tops
Tags
Neighborhood map
What this means for you Summary
Snapshot
- This is a 2-bed/2.0-bath condo listed at $259k.
Deal economics
- At list price, monthly cash flow is $-575 ($-7k/yr) — negative.
- To cash-flow at today's rent, offer at most $158k (39.2% below list).
- To meet the 1% rule (rent ≥ 1% of price), the offer needs to be $221k (14.7% below list).
- Recommended offer: $158k (39.2% below list) — sets the bar for cash-flow.
Location & tenants
- Location reads 69/100 on livability (#465 in FL) — a middle-class / working-renter tenant base. Strengths: crime A+, housing A; Watch: amenities F, commute F, health & safety F.
- Sarasota (urban): math 63% / reading 63% proficiency, ranked #7 of 73 in FL (top 10%) — acceptable for families but not a draw, mixed tenant base, ~2y average lease.
- Market conditions: Rents rising fast (+9.7%/yr); 227 active listings in the ZIP; solid renter incomes; 7,466 units permitted in Sarasota County in 2024 (2,138 in 5+ unit buildings).
- This rent runs 34% of the median local income ($79k/yr) — at the standard rent-burdened threshold; future hikes will face affordability resistance.
Forward outlook
- Local home prices are declining (-3.0%/yr); year-one equity from $2k of loan paydown is wiped out by about $8k of value loss. Plan a longer hold.
- Sarasota County population projected at +20% by 2050 — long-run rental-demand tailwind backs the buy-and-hold thesis.
Negotiation context
- It's been on market 150 days — a 12% lower offer ($228k) is reasonable based on typical stale-listing flexibility.
- 2 sale attempts with the ask held roughly flat each time — persistent listings suggest the price (not the market) is what's stuck; bring a comps-based counter.
Risks & watch-outs
- Watch-outs: HOA is 28% of rent.
- Climate carrying-cost: severe wind risk, 99% chance of damaging wind over 30y; extreme-heat days projected 7→31/yr by 2055 (HVAC capex compounding) — expect insurance premiums to compound above CPI over the hold.
Questions for the listing agent
- What do current leases actually rent for vs. the listed asking? Can we see a recent rent roll and the last 12 months of T-12 income?
- It's been on market 150 days. Have you received any prior offers? Is the seller open to a 39% concession, seller financing, or rate buy-down credit?
- What does the HOA fee cover, when was the last increase, and are there any pending special assessments or reserve-fund shortfalls?
- Any open or pending special assessments — roof, HVAC, plumbing, elevator, façade? What's the per-unit balance and payoff schedule, and is the seller paying it off at close or rolling it to the buyer?
- Why hasn't it sold? Are there any deal-killer items the seller is aware of (foundation, flood, title, zoning, code violations)?
- Is there a deadline driving the sale (1031 exchange, divorce, estate, relocation)? That informs how much negotiation room exists.
- The area grade is low — what's the realistic commute time and amenity access for the typical tenant pool here? Any planned neighborhood developments (good or bad) we should know about?
- What's the average days-on-market for RENTAL listings here right now (not sales)? A rising rental-DOM trend means longer vacancies and softer asking-rent achievability than the comps imply.
- What's the recent tenant-quality profile in this submarket — average credit score on applications, eviction rate, late-payment / NSF rate, and stable-employment percentage? A property-management company in the area should have these aggregated.
- How much new apartment / multifamily construction is in the pipeline within 1–3 miles? Heavy new supply (>2% of stock underway) typically softens rents 12–24 months out; light construction supports rent growth.
Investment metrics
- 1% rule
- 0.85% ✗
- Cap rate
- 3.63%
- Cash-on-cash
- -9.51%
- DSCR
- 0.58
- GRM
- 9.8
CMA / ARV
- ARV (median comp)
- $304,005
- List price
- $259,000
- Delta
- -14.80%
- Verdict
- UNDERPRICED
- Comps
- 20 within 2.0 mi
Projected returns pro-forma
-3.0% appreciation · 8.0% rent growth · sell at horizon
- IRR
- -25.7%
- Equity multiple
- 0.08×
- Total profit
- $-66,527
- Equity at exit
- $38,618
- IRR
- -8.8%
- Equity multiple
- 0.30×
- Total profit
- $-50,456
- Equity at exit
- $22,394
Cash invested: $72,520 (down + closing). Projections, not guarantees.
Landlord ↔ Tenant lean methodology
- Overall (STATE)
- 87 Strongly Landlord-Friendly
- State Florida
- 87 Strongly Landlord-Friendly · R+3
- County
- — inherits STATE
- City
- — inherits STATE
ZIP-level market 34235
- Rents YoY
- 9.7%
- Active inventory
- 227
- Price-to-rent
- 9.8×
Monthly cashflow live
- Estimated rent
- $2,209 medium interval (Pro) →
- Mortgage (P&I)
- −$1,358
- Tax from tax record
- −$238 /mo · $2,861/yr
- Insurance
- −$108
- HOA
- −$615
- Vacancy / Maint / Mgmt
- −$464
- Net cashflow
- $-575
Break-even live
Sensitivity live
| Price | -10% $-428 | -5% $-501 | +0% $-575 | +5% $-648 | +10% $-721 |
|---|---|---|---|---|---|
| Rent | -10% $-749 | -5% $-662 | +0% $-575 | +5% $-487 | +10% $-400 |
| Rate | -1.0pp $-444 | -0.5pp $-509 | base $-575 | +0.5pp $-642 | +1.0pp $-710 |
UW: 25.0% down · 7.5% · 30yr · 1.5% tax · 5.0% vac · 8.0% maint · 8.0% mgmt
Financing live
Cash to close
- Down payment
- $64,750
- Closing costs
- $7,770
- Reserves months
- —
- Total cash needed
- —
Loan-product check · same deal, 3 products live
Conventional
25% down · 7.5% · 30yr
- Down + closing
- —
- Monthly P&I
- —
- Monthly cashflow
- —
- DSCR
- —
- Eligible?
- —
Personal DTI + credit; lowest rate.
DSCR
20% down · 8.5% · 30yr
- Down + closing
- —
- Monthly P&I
- —
- Monthly cashflow
- —
- DSCR
- —
- Eligible?
- —
No personal income docs; deal must DSCR.
Hard money
10% down · 12.0% · 12mo
- Down + closing
- —
- Monthly P&I
- —
- Monthly cashflow
- —
- DSCR
- —
- Eligible?
- —
Short-term bridge; refi at stabilization.
HOA detail condo
- Monthly dues
- $615 · $7,380/yr
- Likely covers
- gaspool
- Assessments
- None detected in remarks — confirm with the listing agent.
Listing history 21 events
-
2026-06-18days on market $259,000 Active 150 DOM
-
2026-06-17days on market $259,000 Active 149 DOM
-
2026-06-16days on market $259,000 Active 148 DOM
-
2026-06-15days on market $259,000 Active 147 DOM
-
2026-06-13days on market $259,000 Active 145 DOM
-
2026-06-13days on market $259,000 Active 144 DOM
-
2026-06-10days on market $259,000 Active 142 DOM
-
2026-06-09days on market $259,000 Active 141 DOM
-
2026-06-08days on market $259,000 Active 140 DOM
-
2026-06-08days on market $259,000 Active 139 DOM
-
2026-06-05days on market $259,000 Active 136 DOM
-
2026-06-03days on market $259,000 Active 135 DOM
-
2026-06-02days on market $259,000 Active 134 DOM
-
2026-06-01days on market $259,000 Active 133 DOM
-
2026-05-31days on market $259,000 Active 132 DOM
-
2026-03-01historical $1,995
-
2026-01-19$259,000 Active 580-char remark
Show marketing remark (580 chars)
LOCATION - LOCATION - LOCATION -- Granite counter tops, upgraded appliances, private wooded view from the 2nd floor lanai are just a few of the features that compliment this multi story townhouse style condo with a 1 car attached garage. Las Palmas is a resort style community located adjacent to Nathan Benderson Recreational Lake Park and the UTC MALL. The community offers 2 clubhouses, 2 heated pools, hot tub, gas grills, tennis court, playground and RV/Boat parking onsite. Easy I-75 access and abundant upscale shopping, dining and entertainment within 1 mile of community.
-
2025-12-29price $1,995
-
2025-12-10$2,095
-
2022-12-14historical
-
2004-09-23soldstatus $34,951,328
ⓘ Source: listings_history table (triggers on properties + properties_extension) + one-shot
backfill from property_details.listing_events for pre-trigger history.
Tax reassessment forecast FL · Resets to sale price
- Current annual tax
- $2,861 · $238/mo
- Projected year-2 tax
- $2,861 · $238/mo
- Expected delta
- $0/yr ($0/mo · 0.0%)
ⓘ Screening estimate from a state-policy table — verify with the county assessor before closing.
Climate risk First Street
- Flood 1/10 Low FEMA zone X (unshaded) · 0% chance over 30 yrs
- Wildfire 4/10 Moderate
- Heat 10/10 Extreme 7 d/yr ≥107°F today · 31 d/yr by 30 yrs out
- Wind 10/10 Extreme 99% chance of damaging wind over 30 yrs
- Air quality 2/10 Low 1 unhealthy d/yr today · 1 by 30 yrs out
Nearby sold comps map
Loading sold comps map…
Walkable amenities ~0.75 mi
Loading nearby amenities…
Taxation est. · year 1
- Rental income
- $26,508
- − Mortgage interest
- −$14,508
- − Property taxes
- −$2,861
- − Insurance
- −$1,295
- − Repairs & maintenance
- −$2,121
- − Management
- −$2,121
- − HOA
- −$7,380
- − Depreciation
- −$7,535
- Taxable loss
- −$11,313
- Est. tax savings @ 24.0%
- +$2,715
- After-tax cash flow
- $-4,179/yr
For passive investors: Depreciation is non-cash, so a rental often shows a tax loss while cash-flowing — sheltering income. Rental losses are passive: they offset passive income freely, and up to $25,000/yr can offset ordinary (W-2) income if you actively participate and your MAGI is under $100k (phasing out to $0 by $150k); unused losses carry forward. On sale, claimed depreciation is recaptured at up to 25%, and gains may owe capital-gains tax (a 1031 exchange can defer both). Figures are a year-1 estimate at your 24.0% rate — not tax advice; consult a CPA.
Schools (NCES district)
- District
- Sarasota
- NCES district ID
- 1201680
- Math proficiency
- 63% ▼ -8.00%
- Reading proficiency
- 63% ▼ -3.00%
- Median HH income
- $51,167
- Composite
- 53.68/100
- National rank
- #1428
- State rank
- #7 of 73 in FL
Livability — The Meadows
- Score
- 69/100
- State rank
- #465
- US rank
- #8393
Category grades
Schools grade is shown separately in the Schools card above.
Census & demographics
- County
- Sarasota County · 448,376 people
- City population
- 15,114
- Metro
- North Port-Sarasota-Bradenton, FL
- Population (ZIP)
- 15,146
- Household income
- $78,958
- Rent vs Own
- Severe rent burden
- 512.0
Population outlook (Sarasota County) Hauer SSP2
- Today (2025)
- 452,380 people
- By 2030
- 474,175 · +4.8%
- By 2040
- 511,577 · +13.1%
- By 2050
- 541,467 · +19.7%
- By 2075
- 604,947 · +33.7%
- By 2100
- 621,965 · +37.5%
Race, ethnicity, and origin ACS 2023
- Neighborhood character
- Predominantly White (73%)
- Race & ethnicity
- White 73% Hispanic / Latino 22% Two or more races 18% Black 2%
- Hispanic origin (detail)
- Mexican 12% Puerto Rican 2% Cuban 4%
- Common ancestry
- Romanian 5% Slovak 3% Scotch-Irish 2%
- Foreign-born
- 19% · Canada, Jamaica
- Languages at home
- 76% English-only · Spanish 18% Other Indo-European 2% Russian/Polish/Slavic 1%
Political lean MEDSL · Sarasota
- 2024 margin
- R (+18.2) · D 40.5% · R 58.7%
- 2008→2024 swing
- -18.1pp toward R · 2008: -0.1pp · 2024: -18.2pp
- All cycles
- 2024: R+18.2 2020: R+10.4 2016: R+11.6 2012: R+7.4 2008: R+0.1
Not yet ingested
- Civics
- —
Market trends
- HPI YoY
- ▼ -307.37%
- Current HPI
- 253.3964
- Rent YoY
- ▲ 9.68%
- Metro
- North Port-Sarasota-Bradenton, FL
- State GDP YoY
- ▲ 3.28%
- F500 in state
- 36
Industry mix (Fortune 500 HQ in FL)
| Industry | F500 HQs | Revenue |
|---|---|---|
| Industrial Technology | 2 | $29B |
|
||
| Insurance | 2 | $17B |
|
||
| Retail | 1 | $60B |
|
||
| Technology Distribution | 1 | $58B |
|
||
| Homebuilding | 1 | $35B |
|
||
| Technology Manufacturing | 1 | $35B |
|
||
Price history
-100.0% since first listed6 events — show timeline
- 2026-03-01 Rental Removed $1,995 STELLARMLS
- 2026-01-19 Listed $259,000 Stellar MLS as Distributed by MLS Grid
- 2025-12-29 Price Changed $1,995 STELLARMLS
- 2025-12-10 Listed for Rent $2,095 STELLARMLS
- 2022-12-14 Rental Removed — STELLARMLS
- 2004-09-23 Sold (Public Records) $34,951,328 Public Records
Property tax history
+9.2%/yrLatest (2025): $2,861 · -2.5% YoY. Source: county tax records.
Cash-flow waterfall
monthlySold comps — $/sqft
last 12 mo · ≤1 miLoading sold comps…