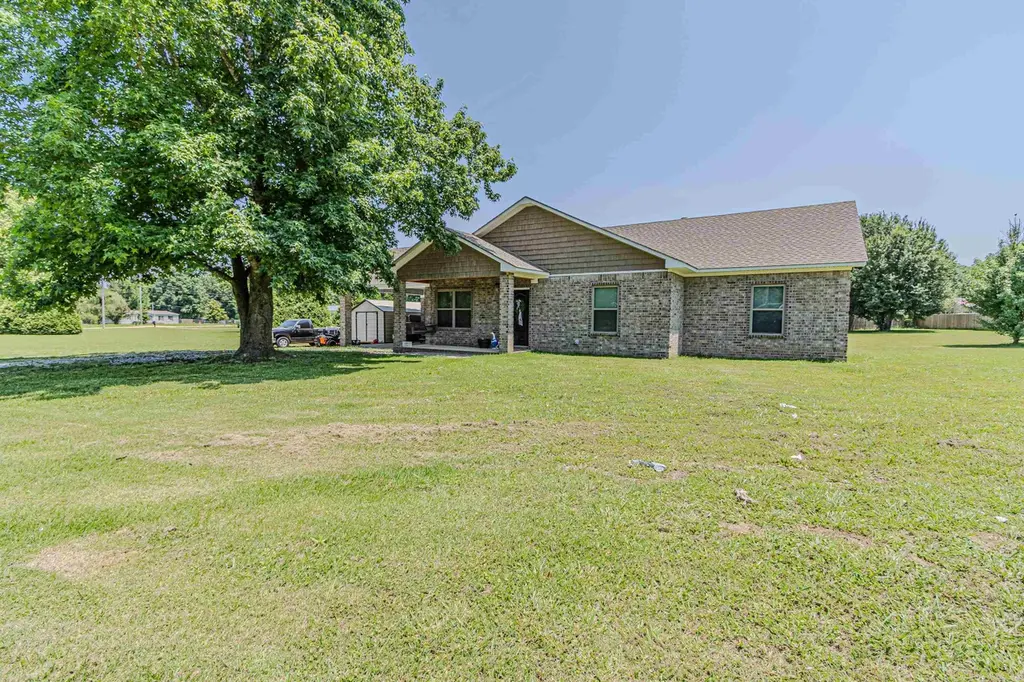
279 Cr 7922 · Brookland, AR
Flood risk 6/10 · Moderate
- FEMA flood zone
- X
- Chance of flooding over 30 yrs
- 0.69%
- Est. flood insurance / yr
- $507 – $1,088
Fire risk 5/10 · Moderate
- Est. fire insurance / yr
- $1,499 – $2,785
Heat risk 5/10 · Moderate
- Hot days now (above 108°F)
- 7 days/yr
- Hot days in 30 yrs
- 21 days/yr
Wind risk 4/10 · Minor
- Chance of severe wind over 30 yrs
- 8.0%
Air-quality risk 1/10 · Minimal
- Unhealthy air days now
- 0 days/yr
- Unhealthy air days in 30 yrs
- 0 days/yr
Risk factors via First Street. Map © Google.
Why this score? — see what drove the F grade
The composite is a weighted blend of 9 inputs, each scored 0–100. Each bar is that input's sub-score; the figure is the points it added to the 100-point composite (weight × sub-score).
- Appreciation +10.0/10.0
- Cash flow +6.7/30.0
- Schools +3.6/10.0
- Livability +3.5/5.0
- ARV discount +3.4/15.0
- Rent growth +2.5/5.0
- Condition / age +2.5/5.0
- DSCR +1.0/10.0
- 1% rule +0.6/10.0
$264,900
🖨 Deal sheet 📄 Offer letter ✓ Due diligence
Listing remarks MLS
Country living at its bestjust minutes from town and located in the sought-after Brookland School District! Built in 2023, this beautiful all-brick 3 bedroom, 2 bath home sits on a gorgeous 1-acre lot and offers the open-concept layout today's buyers want. The spacious living area flows seamlessly into the kitchen and dining space, making it perfect for everyday living and entertaining. Enjoy newer construction peace of mind, modern finishes, and plenty of room to spread outinside and out. Step outside and take in the wide-open space, ideal for a shop, garden, pool, animals, or just enjoying the quiet. If you've been looking for a nearly-new home with land in Brookland, this one is a must-see!
Key facts
- Newer construction
- Wide-open space
- Gorgeous 1-acre lot
Tags
Property features AI
Exterior
- Parking: Carport
- Utilities: Public water
- Home design: Brick exterior
- Construction: Architectural shingle roof; Slab foundation
- Exterior features: Level lot; Gravel road access; Public water
Interior
- Kitchen: Free-standing stove
- Flooring: Tile; Luxury vinyl
- Bathrooms: 2 full bathrooms
- Heating & cooling: Central electric heating; Central electric cooling
- Interior features: Tile and luxury vinyl flooring; Free-standing stove
Neighborhood map
What this means for you Summary
Snapshot
- This is a 3-bed/2.0-bath single-family listed at $265k.
Deal economics
- At list price, monthly cash flow is $-419 ($-5k/yr) — negative.
- To cash-flow at today's rent, offer at most $191k (27.9% below list).
- To meet the 1% rule (rent ≥ 1% of price), the offer needs to be $147k (44.3% below list).
- Recommended offer: $147k (44.3% below list) — sets the bar for 1% rule.
Location & tenants
- Location reads 70/100 on livability (#57 in AR) — a middle-class / working-renter tenant base. Strengths: cost of living A+, housing A+, health & safety A; Watch: crime D, amenities F, commute F.
- Brookland School District (suburban): math 45% / reading 39% proficiency, ranked #47 of 238 in AR (top 20%) — families likely to look elsewhere, expect single-tenant / working-renter base with shorter leases.
- Market conditions: 117 active listings in the ZIP; 926 units permitted in Craighead County in 2024 (69 in 5+ unit buildings).
Forward outlook
- In year one you build about $28k of equity ($2k loan paydown + $26k appreciation (10.0% local appreciation)).
- Craighead County population projected at +38% by 2050 — long-run rental-demand tailwind backs the buy-and-hold thesis.
- By year 2, paydown + projected appreciation supports a ~$46k cash-out refi (75% LTV) — recoverable capital for the next deal without selling this one.
Negotiation context
- It's been on market 17 days — a 2% lower offer ($261k) is reasonable based on typical stale-listing flexibility.
- 4 sale attempts since 3y ago with the ask held roughly flat each time — persistent listings suggest the price (not the market) is what's stuck; bring a comps-based counter.
- Current owner paid $225k; 18% above their basis — modest negotiation headroom, anchor on the comps not their cost.
Risks & watch-outs
- Climate carrying-cost: major flood risk; moderate wildfire risk; extreme-heat days projected 7→21/yr by 2055 (HVAC capex compounding) — expect insurance premiums to compound above CPI over the hold.
Questions for the listing agent
- What do current leases actually rent for vs. the listed asking? Can we see a recent rent roll and the last 12 months of T-12 income?
- Is there a deadline driving the sale (1031 exchange, divorce, estate, relocation)? That informs how much negotiation room exists.
- Crime grade is D in this area — have there been break-ins, vandalism, or insurance claims at this property in the last 3 years? What carrier currently insures it and at what premium?
- The area grade is low — what's the realistic commute time and amenity access for the typical tenant pool here? Any planned neighborhood developments (good or bad) we should know about?
- What's the average days-on-market for RENTAL listings here right now (not sales)? A rising rental-DOM trend means longer vacancies and softer asking-rent achievability than the comps imply.
- What's the recent tenant-quality profile in this submarket — average credit score on applications, eviction rate, late-payment / NSF rate, and stable-employment percentage? A property-management company in the area should have these aggregated.
- How much new for-sale + rental construction is in the pipeline within 1–3 miles? Heavy new supply typically softens prices + rents 12–24 months out; constrained supply supports both.
Investment metrics
- 1% rule
- 0.56% ✗
- Cap rate
- 4.40%
- Cash-on-cash
- -6.78%
- DSCR
- 0.70
- GRM
- 15.0
CMA / ARV
- ARV (on-the-fly)
- $242,720
- Comps found
- 2
Show comp detail 2 sales within ~0.75 mi
| Address | Dist | Beds/Ba | Sqft | Sold | Price | $/sf | Match |
|---|---|---|---|---|---|---|---|
| 70 County Road 7922 | 0.20mi | 3/2.0 | 1,403 (-5%) | 6mo | $230,000 | $164 | 77 |
| 110 County Road 7922 | 0.16mi | 3/2.0 | 1,650 (+12%) | 6mo | $270,000 | $164 | 68 |
Match score weights: distance 35% · size 25% · config 20% · recency 20%. Top-matched comps best support the ARV.
Projected returns pro-forma
10.0% appreciation · 3.0% rent growth · sell at horizon
- IRR
- 19.5%
- Equity multiple
- 2.58×
- Total profit
- $117,461
- Equity at exit
- $238,643
- IRR
- 17.9%
- Equity multiple
- 5.94×
- Total profit
- $366,628
- Equity at exit
- $514,642
Cash invested: $74,172 (down + closing). Projections, not guarantees.
Landlord ↔ Tenant lean methodology
- Overall (STATE)
- 92 Strongly Landlord-Friendly
- State Arkansas
- 92 Strongly Landlord-Friendly · R+14
- County
- — inherits STATE
- City
- — inherits STATE
ZIP-level market 72417
- Home prices YoY
- 20.6%
- Active inventory
- 117
- Price-to-rent
- 15.0×
Monthly cashflow live
- Estimated rent
- $1,474 medium interval (Pro) →
- Mortgage (P&I)
- −$1,389
- Tax from tax record
- −$84 /mo · $1,010/yr
- Insurance
- −$110
- HOA
- −$0
- Vacancy / Maint / Mgmt
- −$310
- Net cashflow
- $-419
Break-even live
UW: 25.0% down · 7.5% · 30yr · 1.5% tax · 5.0% vac · 8.0% maint · 8.0% mgmt
Financing live
Cash to close
- Down payment
- $66,225
- Closing costs
- $7,947
- Reserves months
- —
- Total cash needed
- —
Loan-product check · same deal, 3 products live
Conventional
25% down · 7.5% · 30yr
- Down + closing
- —
- Monthly P&I
- —
- Monthly cashflow
- —
- DSCR
- —
- Eligible?
- —
Personal DTI + credit; lowest rate.
DSCR
20% down · 8.5% · 30yr
- Down + closing
- —
- Monthly P&I
- —
- Monthly cashflow
- —
- DSCR
- —
- Eligible?
- —
No personal income docs; deal must DSCR.
Hard money
10% down · 12.0% · 12mo
- Down + closing
- —
- Monthly P&I
- —
- Monthly cashflow
- —
- DSCR
- —
- Eligible?
- —
Short-term bridge; refi at stabilization.
Listing history 14 events
-
2026-06-19days on market $264,900 Active 17 DOM
-
2026-06-18days on market $264,900 Active 16 DOM
-
2026-06-17days on market $264,900 Active 15 DOM
-
2026-06-16days on market $264,900 Active 14 DOM
-
2026-06-15days on market $264,900 Active 13 DOM
-
2026-06-14days on market $264,900 Active 11 DOM
-
2026-06-13days on market $264,900 Active 10 DOM
-
2026-06-10days on market $264,900 Active 8 DOM
-
2026-06-09statusdays on market $264,900 Active 7 DOM
-
2026-06-08days on market $264,900 New Listing 6 DOM
-
2026-06-07days on market $264,900 New Listing 5 DOM
-
2026-06-05days on market $264,900 New Listing 2 DOM
-
2026-06-03remarks 675-char remark
-
2026-06-03$264,900 New Listing 1 DOM
ⓘ Source: listings_history table (triggers on properties + properties_extension) + one-shot
backfill from property_details.listing_events for pre-trigger history.
Tax reassessment forecast AR · Resets to sale price
- Current annual tax
- $1,010 · $84/mo
- Projected year-2 tax
- $1,695 · $141/mo
- Expected delta
- +$685/yr (+$57/mo · 67.8%)
ⓘ Screening estimate from a state-policy table — verify with the county assessor before closing.
Climate risk First Street
- Flood 6/10 Major FEMA zone X · 69% chance over 30 yrs
- Wildfire 5/10 Major
- Heat 5/10 Major 7 d/yr ≥108°F today · 21 d/yr by 30 yrs out
- Wind 4/10 Moderate 8% chance of damaging wind over 30 yrs
- Air quality 1/10 Low 0 unhealthy d/yr today · 0 by 30 yrs out
Nearby sold comps map
Loading sold comps map…
Walkable amenities ~0.75 mi
Loading nearby amenities…
Taxation est. · year 1
- Rental income
- $17,693
- − Mortgage interest
- −$14,839
- − Property taxes
- −$1,010
- − Insurance
- −$1,324
- − Repairs & maintenance
- −$1,415
- − Management
- −$1,415
- − Depreciation
- −$7,706
- Taxable loss
- −$10,017
- Est. tax savings @ 24.0%
- +$2,404
- After-tax cash flow
- $-2,623/yr
For passive investors: Depreciation is non-cash, so a rental often shows a tax loss while cash-flowing — sheltering income. Rental losses are passive: they offset passive income freely, and up to $25,000/yr can offset ordinary (W-2) income if you actively participate and your MAGI is under $100k (phasing out to $0 by $150k); unused losses carry forward. On sale, claimed depreciation is recaptured at up to 25%, and gains may owe capital-gains tax (a 1031 exchange can defer both). Figures are a year-1 estimate at your 24.0% rate — not tax advice; consult a CPA.
Schools (NCES district)
- District
- Brookland School District
- NCES district ID
- 0503640
- Math proficiency
- 45% ▼ -15.00%
- Reading proficiency
- 39% ▼ -16.00%
- Median HH income
- $52,226
- Composite
- 36.4/100
- National rank
- #4678
- State rank
- #47 of 238 in AR
Livability — Brookland
- Score
- 70/100
- State rank
- #57
- US rank
- #7817
Category grades
Schools grade is shown separately in the Schools card above.
Census & demographics
- County
- Craighead County · 97,185 people
- City population
- 5,940
- Metro
- Jonesboro, AR
- Population (ZIP)
- 5,940
- Household income
- $61,964
- Rent vs Own
- Severe rent burden
- 152.0
Population outlook (Craighead County) Hauer SSP2
- Today (2025)
- 122,235 people
- By 2030
- 131,338 · +7.4%
- By 2040
- 149,862 · +22.6%
- By 2050
- 168,034 · +37.5%
- By 2075
- 208,094 · +70.2%
- By 2100
- 233,251 · +90.8%
Race, ethnicity, and origin ACS 2023
- Neighborhood character
- Predominantly White (91%)
- Race & ethnicity
- White 91% Two or more races 5% Black 2% Hispanic / Latino 2%
- Common ancestry
- Slovak 3% Italian 3%
- Foreign-born
- 1% · Canada, South Korea
Political lean MEDSL · Craighead
- 2024 margin
- Solid R (+37.4) · D 30.1% · R 67.5% · Other 2.4%
- 2008→2024 swing
- -12.9pp toward R · 2008: -24.5pp · 2024: -37.4pp
- All cycles
- 2024: R+37.4 2020: R+35.4 2016: R+35.2 2012: R+31.1 2008: R+24.5
Not yet ingested
- Civics
- —
Market trends
- HPI YoY
- ▲ 56.75%
- Current HPI
- 331.5025
- Rent YoY
- —
- Metro
- Jonesboro, AR
- State GDP YoY
- ▲ 3.80%
- F500 in state
- 10
Industry mix (Fortune 500 HQ in AR)
| Industry | F500 HQs | Revenue |
|---|---|---|
| Retail | 1 | $681B |
|
||
| Food / Agriculture | 1 | $53B |
|
||
| Retail / Energy | 1 | $22B |
|
||
| Transportation / Logistics | 1 | $12B |
|
||
| Energy | 1 | $4B |
|
||
Price history
+488.7% since first listed14 events — show timeline
- 2026-06-02 Listed $264,900 CARMLS
- 2026-06-02 Listed $264,900 NEABOR MLS
- 2024-04-01 Sold (Public Records) $225,000 Public Records
- 2024-03-31 Sold (MLS) $225,000 NEABOR MLS
- 2024-03-31 Sold (MLS) $225,000 CARMLS
- 2024-03-07 Delisted — NEABOR MLS
- 2024-03-07 Pending — CARMLS
- 2024-02-21 Price Changed $229,900 CARMLS
- 2024-02-21 Price Changed $229,900 NEABOR MLS
- 2024-01-28 Price Changed $234,900 CARMLS
- 2024-01-28 Price Changed $234,900 NEABOR MLS
- 2023-11-26 Listed $239,900 CARMLS
- 2023-11-24 Listed $239,900 NEABOR MLS
- 2023-01-13 Sold (Public Records) $45,000 Public Records
Property tax history
+20.0%/yrLatest (2025): $1,010 · +361.3% YoY. Source: county tax records.
Cash-flow waterfall
monthlySold comps — $/sqft
last 12 mo · ≤1 miLoading sold comps…