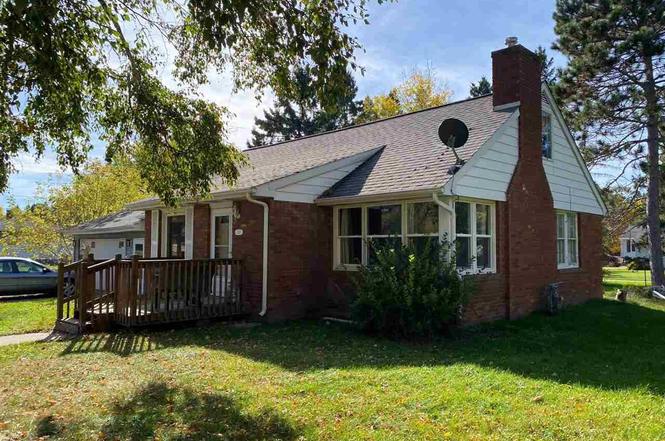
213 S 2nd St St W · Aurora, MN
Flood risk 1/10 · Minimal
- FEMA flood zone
- X
- Chance of flooding over 30 yrs
- 0.0%
- Est. flood insurance / yr
- $473 – $860
Fire risk 5/10 · Moderate
- Est. fire insurance / yr
- $888 – $1,650
Heat risk 1/10 · Minimal
- Hot days now (above 91°F)
- 7 days/yr
- Hot days in 30 yrs
- 13 days/yr
Wind risk 1/10 · Minimal
- Chance of severe wind over 30 yrs
- —
Air-quality risk 2/10 · Minimal
- Unhealthy air days now
- 0 days/yr
- Unhealthy air days in 30 yrs
- 1 days/yr
Risk factors via First Street. Map © Google.
Why this score? — see what drove the D- grade
The composite is a weighted blend of 9 inputs, each scored 0–100. Each bar is that input's sub-score; the figure is the points it added to the 100-point composite (weight × sub-score).
- Cash flow +10.7/30.0
- ARV discount +5.6/15.0
- Livability +3.6/5.0
- Schools +3.2/10.0
- DSCR +3.1/10.0
- 1% rule +2.7/10.0
- Appreciation +2.5/10.0
- Rent growth +2.5/5.0
- Condition / age +2.5/5.0
$155,000
🖨 Deal sheet (PDF) 📄 Offer letter ✓ Due diligence
Listing remarks
3 bedroom 1 bath home complete with attached 20x26 garage sitting on a large 125x150 lot near the edge of town in Aurora. This home features 2 main level bedrooms along with a full bath and a spacious living room/ dining room area and a front porch. Upstairs features a 3rd bedroom while the lower level has a den, office area, and laundry room. Roof replaced in 2007 and 200 amp electrical service.
Key facts
- Attached garage
- Front porch
- Large lot
Tags
Neighborhood map
What this means for you Summary
Snapshot
- This is a 3-bed/2.0-bath single-family listed at $155k.
Deal economics
- At list price, monthly cash flow is $-73 ($-873/yr) — negative.
- To cash-flow at today's rent, offer at most $142k (8.3% below list).
- To meet the 1% rule (rent ≥ 1% of price), the offer needs to be $120k (22.7% below list).
- Recommended offer: $120k (22.7% below list) — sets the bar for 1% rule.
Location & tenants
- Location reads 71/100 on livability (#312 in MN) — a middle-class / working-renter tenant base. Strengths: crime A+, cost of living A+, health & safety A+; Watch: amenities F, commute F, employment F.
- Mesabi East School District (rural): math 27% / reading 47% proficiency, ranked #240 of 301 in MN (top 80%) — families likely to look elsewhere, expect single-tenant / working-renter base with shorter leases.
- Zoned schools: Mesabi East Elementary (math 33% / reading 47%, grade F, #600 of 857 statewide, top 70%, 474 students, 51% FRL); Mesabi East Secondary (math 12% / reading 47%, grade F, #354 of 471 statewide, top 77%, 415 students, 43% FRL).
- Market conditions: 25 active listings in the ZIP; 639 units permitted in St. Louis County in 2024 (338 in 5+ unit buildings).
Forward outlook
- Local home prices are declining (-3.0%/yr); year-one equity from $1k of loan paydown is wiped out by about $5k of value loss. Plan a longer hold.
Negotiation context
- It's been on market 189 days — a 12% lower offer ($136k) is reasonable based on typical stale-listing flexibility.
- Current owner paid $75k; list at $155k implies a 107% gain — meaningful room to come down on a strong offer.
Risks & watch-outs
- Watch-outs: built in 1957 — expect roof / HVAC / electrical / plumbing capex.
- Climate carrying-cost: moderate wildfire risk — expect insurance premiums to compound above CPI over the hold.
Questions for the listing agent
- What do current leases actually rent for vs. the listed asking? Can we see a recent rent roll and the last 12 months of T-12 income?
- It's been on market 189 days. Have you received any prior offers? Is the seller open to a 23% concession, seller financing, or rate buy-down credit?
- Built in 1957 — when were the roof, HVAC, electrical panel, plumbing, and water heater last replaced?
- Why hasn't it sold? Are there any deal-killer items the seller is aware of (foundation, flood, title, zoning, code violations)?
- Is there a deadline driving the sale (1031 exchange, divorce, estate, relocation)? That informs how much negotiation room exists.
- The area grade is low — what's the realistic commute time and amenity access for the typical tenant pool here? Any planned neighborhood developments (good or bad) we should know about?
- What's the average days-on-market for RENTAL listings here right now (not sales)? A rising rental-DOM trend means longer vacancies and softer asking-rent achievability than the comps imply.
- What's the recent tenant-quality profile in this submarket — average credit score on applications, eviction rate, late-payment / NSF rate, and stable-employment percentage? A property-management company in the area should have these aggregated.
- How much new for-sale + rental construction is in the pipeline within 1–3 miles? Heavy new supply typically softens prices + rents 12–24 months out; constrained supply supports both.
Investment metrics
- 1% rule
- 0.77% ✗
- Cap rate
- 5.73%
- Cash-on-cash
- -2.01%
- DSCR
- 0.91
- GRM
- 10.8
CMA / ARV
- ARV (on-the-fly)
- $148,730
- Comps found
- 12
Show comp detail 12 sales within ~0.75 mi
| Address | Dist | Beds/Ba | Sqft | Sold | Price | $/sf | Match |
|---|---|---|---|---|---|---|---|
| 313 S 2nd St St W | 0.10mi | 3/1.5 | 1,373 (-1%) | 4mo | $125,000 | $91 | 88 |
| 312 S 2nd ST St W | 0.10mi | 2/2.0 (-1) | 1,476 (+6%) | 1mo | $197,000 | $133 | 79 |
| 313 S 2nd St St E | 0.32mi | 3/1.8 | 1,388 (-0%) | 9mo | $120,000 | $86 | 77 |
| 306 W 1st Ave N | 0.34mi | 3/2.0 | 1,410 (+1%) | 15mo | $154,000 | $109 | 69 |
| 306 S 2nd St W | 0.06mi | 2/1.0 (-1) | 1,200 (-14%) | 4mo | $139,900 | $117 | 62 |
| 313 S 1st St St E | 0.24mi | 2/1.0 (-1) | 1,368 (-2%) | 21mo | $106,000 | $77 | 60 |
| 711 Maple Dr | 0.66mi | 3/1.2 | 1,365 (-2%) | 14mo | $187,500 | $137 | 52 |
| 45 S Erie St | 0.59mi | 3/1.5 | 1,335 (-4%) | 15mo | $160,000 | $120 | 51 |
| 27 W 4th Ave N | 0.45mi | 3/1.8 | 1,248 (-10%) | 12mo | $134,000 | $107 | 51 |
| 114 W 3rd Ave Ave N | 0.41mi | 3/1.8 | 1,188 (-14%) | 9mo | $49,400 | $42 | 48 |
| 212 3rd Ave Ave N | 0.57mi | 2/1.2 (-1) | 1,277 (-8%) | 12mo | $99,450 | $78 | 41 |
| 705 Arrowhead St | 0.55mi | 3/1.0 | 1,540 (+11%) | 21mo | $138,000 | $90 | 35 |
Match score weights: distance 35% · size 25% · config 20% · recency 20%. Top-matched comps best support the ARV.
Projected returns pro-forma
-3.0% appreciation · 3.0% rent growth · sell at horizon
- IRR
- -19.6%
- Equity multiple
- 0.31×
- Total profit
- $-29,766
- Equity at exit
- $23,111
- IRR
- -12.5%
- Equity multiple
- 0.26×
- Total profit
- $-31,945
- Equity at exit
- $13,402
Cash invested: $43,400 (down + closing). Projections, not guarantees.
Landlord ↔ Tenant lean methodology
- Overall (STATE)
- 46 Balanced
- State Minnesota
- 46 Balanced · D+2
- County
- — inherits STATE
- City
- — inherits STATE
ZIP-level market 55705
- Home prices YoY
- -1.8%
- Active inventory
- 25
- Price-to-rent
- 10.8×
Monthly cashflow live
- Estimated rent
- $1,198 medium interval (Pro) →
- Mortgage (P&I)
- −$813
- Tax from tax record
- −$142 /mo · $1,702/yr
- Insurance
- −$65
- HOA
- −$0
- Vacancy / Maint / Mgmt
- −$252
- Net cashflow
- $-73
Break-even live
Sensitivity live
| Price | -10% $15 | -5% $-29 | +0% $-73 | +5% $-117 | +10% $-161 |
|---|---|---|---|---|---|
| Rent | -10% $-167 | -5% $-120 | +0% $-73 | +5% $-25 | +10% $22 |
| Rate | -1.0pp $5 | -0.5pp $-33 | base $-73 | +0.5pp $-113 | +1.0pp $-154 |
UW: 25.0% down · 7.5% · 30yr · 1.5% tax · 5.0% vac · 8.0% maint · 8.0% mgmt
Financing live
Cash to close
- Down payment
- $38,750
- Closing costs
- $4,650
- Reserves months
- —
- Total cash needed
- —
Loan-product check · same deal, 3 products live
Conventional
25% down · 7.5% · 30yr
- Down + closing
- —
- Monthly P&I
- —
- Monthly cashflow
- —
- DSCR
- —
- Eligible?
- —
Personal DTI + credit; lowest rate.
DSCR
20% down · 8.5% · 30yr
- Down + closing
- —
- Monthly P&I
- —
- Monthly cashflow
- —
- DSCR
- —
- Eligible?
- —
No personal income docs; deal must DSCR.
Hard money
10% down · 12.0% · 12mo
- Down + closing
- —
- Monthly P&I
- —
- Monthly cashflow
- —
- DSCR
- —
- Eligible?
- —
Short-term bridge; refi at stabilization.
Listing history 5 events
-
2026-04-21status Pending
-
2025-10-14$155,000 Active
-
2011-12-21soldstatus $75,000
-
2009-08-18soldstatus $75,000
-
2004-04-01soldstatus $51,000
ⓘ Source: listings_history table (triggers on properties + properties_extension) + one-shot
backfill from property_details.listing_events for pre-trigger history.
Tax reassessment forecast MN · Partial reset (capped growth)
- Current annual tax
- $1,702 · $142/mo
- Projected year-2 tax
- $1,719 · $143/mo
- Expected delta
- +$17/yr (+$1/mo · 1.0%)
ⓘ Screening estimate from a state-policy table — verify with the county assessor before closing.
Climate risk First Street
- Flood 1/10 Low FEMA zone X · 0% chance over 30 yrs
- Wildfire 5/10 Major
- Heat 1/10 Low 7 d/yr ≥91°F today · 13 d/yr by 30 yrs out
- Wind 1/10 Low
- Air quality 2/10 Low 0 unhealthy d/yr today · 1 by 30 yrs out
Nearby sold comps map
Loading sold comps map…
Walkable amenities ~0.75 mi
Loading nearby amenities…
Taxation est. · year 1
- Rental income
- $14,377
- − Mortgage interest
- −$8,682
- − Property taxes
- −$1,702
- − Insurance
- −$775
- − Repairs & maintenance
- −$1,150
- − Management
- −$1,150
- − Depreciation
- −$4,509
- Taxable loss
- −$3,592
- Est. tax savings @ 24.0%
- +$862
- After-tax cash flow
- $-11/yr
For passive investors: Depreciation is non-cash, so a rental often shows a tax loss while cash-flowing — sheltering income. Rental losses are passive: they offset passive income freely, and up to $25,000/yr can offset ordinary (W-2) income if you actively participate and your MAGI is under $100k (phasing out to $0 by $150k); unused losses carry forward. On sale, claimed depreciation is recaptured at up to 25%, and gains may owe capital-gains tax (a 1031 exchange can defer both). Figures are a year-1 estimate at your 24.0% rate — not tax advice; consult a CPA.
Schools (NCES district)
- District
- Mesabi East School District
- NCES district ID
- 2791450
- Math proficiency
- 27% ▼ -17.00%
- Reading proficiency
- 47% ▼ -8.00%
- Median HH income
- $47,546
- Composite
- 31.69/100
- National rank
- #5922
- State rank
- #240 of 301 in MN
Livability — Aurora
- Score
- 71/100
- State rank
- #312
- US rank
- #6901
Category grades
Schools grade is shown separately in the Schools card above.
Census & demographics
- Census place
- Aurora, MN
- Population (ZIP)
- 3,248
Population outlook (St. Louis County) Hauer SSP2
- Today (2025)
- 202,411 people
- By 2030
- 203,234 · +0.4%
- By 2040
- 202,520 · +0.1%
- By 2050
- 200,853 · -0.8%
- By 2075
- 200,943 · -0.7%
- By 2100
- 192,058 · -5.1%
Race, ethnicity, and origin ACS 2023
- Neighborhood character
- Predominantly White (95%)
- Race & ethnicity
- White 95% Native American 2% Two or more races 2%
- Common ancestry
- Portuguese 12% Slovak 5% Iranian 4%
- Foreign-born
- 2% · Canada
- Languages at home
- 97% English-only · Other Indo-European 1% Russian/Polish/Slavic 1% Spanish 1%
Political lean MEDSL · St. Louis
- 2024 margin
- D (+13.7) · D 55.9% · R 42.2% · Other 1.8%
- 2008→2024 swing
- -18.8pp toward R · 2008: 32.5pp · 2024: 13.7pp
- All cycles
- 2024: D+13.7 2020: D+15.6 2016: D+11.8 2012: D+29.6 2008: D+32.5
Not yet ingested
- Civics
- —
Market trends
- HPI YoY
- ▼ -4.93%
- Current HPI
- 266.5875
- Rent YoY
- —
- Metro
- —
- State GDP YoY
- ▲ 2.41%
- F500 in state
- 34
Industry mix (Fortune 500 HQ in MN)
| Industry | F500 HQs | Revenue |
|---|---|---|
| Healthcare | 2 | $407B |
|
||
| Retail | 2 | $150B |
|
||
| Consumer Goods | 2 | $32B |
|
||
| Industrial Machinery | 2 | $6B |
|
||
| Agriculture | 1 | $40B |
|
||
| Healthcare / Medical Devices | 1 | $32B |
|
||
Price history
+203.9% since first listed5 events — show timeline
- 2026-04-21 Pending — RAOR
- 2025-10-14 Listed $155,000 RAOR
- 2011-12-21 Sold (Public Records) $75,000 Public Records
- 2009-08-18 Sold (Public Records) $75,000 Public Records
- 2004-04-01 Sold (Public Records) $51,000 Public Records
Property tax history
+12.3%/yrLatest (2025): $1,702 · -8.2% YoY. Source: county tax records.
Cash-flow waterfall
monthlySold comps — $/sqft
last 12 mo · ≤1 miLoading sold comps…