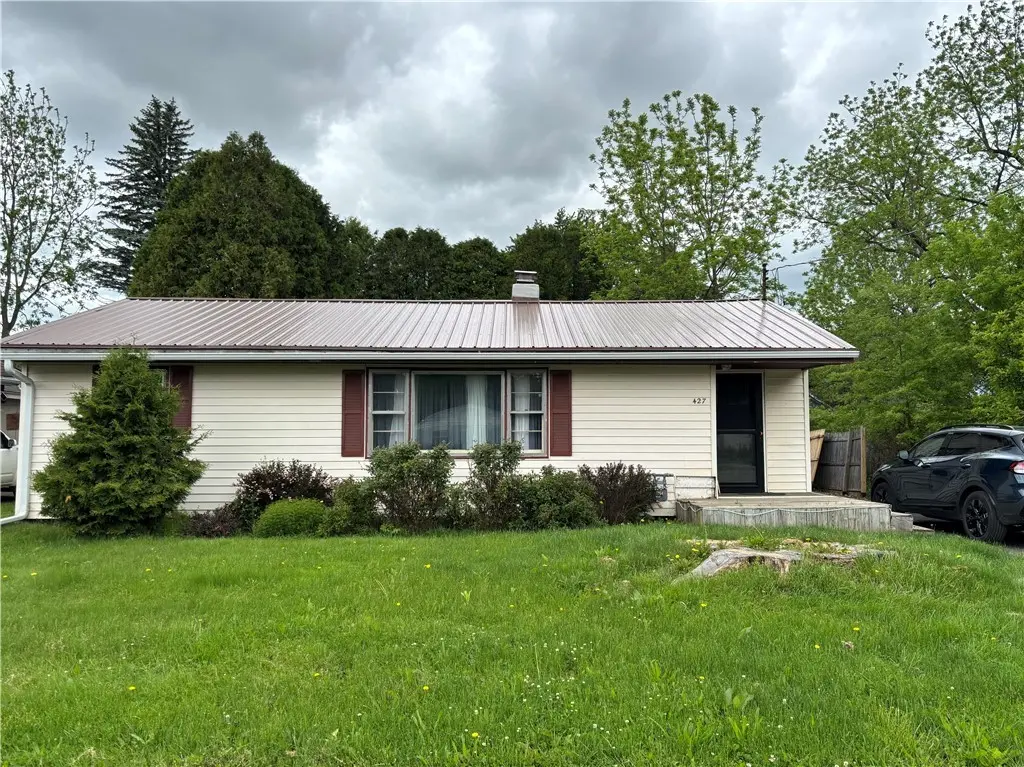
427 Schuyler Ave · Southport, NY
Flood risk 4/10 · Minor
- FEMA flood zone
- X
- Chance of flooding over 30 yrs
- 0.21%
- Est. flood insurance / yr
- $473 – $860
Fire risk 1/10 · Minimal
- Est. fire insurance / yr
- $691 – $1,283
Heat risk 3/10 · Minor
- Hot days now (above 96°F)
- 7 days/yr
- Hot days in 30 yrs
- 16 days/yr
Wind risk 2/10 · Minimal
- Chance of severe wind over 30 yrs
- 1.0%
Air-quality risk 1/10 · Minimal
- Unhealthy air days now
- 0 days/yr
- Unhealthy air days in 30 yrs
- 0 days/yr
Risk factors via First Street. Map © Google.
Why this score? — see what drove the D- grade
The composite is a weighted blend of 9 inputs, each scored 0–100. Each bar is that input's sub-score; the figure is the points it added to the 100-point composite (weight × sub-score).
- Cash flow +16.4/30.0
- DSCR +5.1/10.0
- 1% rule +4.6/10.0
- Livability +3.2/5.0
- Rent growth +2.5/5.0
- Condition / age +2.5/5.0
- Schools +2.4/10.0
- ARV discount +0.0/15.0
- Appreciation +0.0/10.0
$129,900
🖨 Deal sheet (PDF) 📄 Offer letter ✓ Due diligence
Listing remarks MLS
Check out this cozy affordable ranch home just outside the city limit, yet still in town (still has public water and sewer). This home has some newer updates of flooring, paint and handmade bar in back room. This home boasts large addition on the back of the house which can be used as a 2nd living room, gathering area or recreation area for children. Efficiency is what you get with this home and there is a private back yard area and a 1 car detached garage for extra storage. Located on a side street with minimal traffic. Home is being sold "As Is".
Key facts
- Hot water tank
- Recent updates
- New roof
Tags
Property features AI
Exterior
- Parking: Detached garage; One garage space
- Utilities: Public water (connected); Sewer connected
- Home design: Single-story home; Existing/resale property; Vinyl siding
- Construction: Block foundation
- Exterior features: Blacktop driveway; Rectangular residential lot (approx. 65 x 120)
Interior
- Kitchen: Electric oven; Electric range; Refrigerator
- Bedrooms: Three bedrooms on the main level
- Flooring: Carpet; Laminate; Vinyl; Varies
- Bathrooms: One full bathroom on the main level
- Heating & cooling: Gas forced-air heating
- Interior features: Eat-in kitchen; Bedroom on main level; Partially finished basement
- Laundry & utility: Gas water heater
Neighborhood map
What this means for you Summary
Snapshot
- This is a 2-bed/1.0-bath single-family listed at $130k.
Deal economics
- At list price, monthly cash flow is $73 ($878/yr) — positive.
- The deal already cash-flows at list — no discount required.
- To meet the 1% rule (rent ≥ 1% of price), the offer needs to be $125k (3.7% below list).
- Recommended offer: $125k (3.7% below list) — sets the bar for 1% rule.
Location & tenants
- Location reads 65/100 on livability (#690 in NY) — a middle-class / working-renter tenant base. Strengths: cost of living A+, housing A; Watch: employment D, health & safety D, crime D-.
- Elmira City School District (urban): math 23% / reading 35% proficiency, ranked #580 of 590 in NY (top 98%) — low school quality limits family demand, transient renter base, plan for 1-2y turnover.
- Zoned schools: Ernie Davis Academy (math 5% / reading 31%, grade F, #691 of 729 statewide, top 95%, 802 students, 66% FRL).
- Market conditions: 104 active listings in the ZIP; 5 comparable units currently listed for rent nearby; rentals lingering (median 46d on market — plan ~5-8 weeks vacancy on turnover, expect pricing pressure); 100% of comp listings sitting > 30 days — soft ceiling on asking rent; 91 units permitted in Chemung County in 2024 (63 in 5+ unit buildings).
Forward outlook
- Local home prices are declining (-3.0%/yr); year-one equity from $898 of loan paydown is wiped out by about $4k of value loss. Plan a longer hold.
- Chemung County population projected at -17% by 2050 — secular population decline; favor cash flow + early exit over multi-decade hold.
Negotiation context
- It's been on market 23 days — a 2% lower offer ($128k) is reasonable based on typical stale-listing flexibility.
- 3 sale attempts since 5y ago; this cycle's ask has dropped $10k (7%) from the opening price — seller is motivated, your offer sets the floor, not the list.
- Current owner paid $65k; list at $130k implies a 100% gain — meaningful room to come down on a strong offer.
Risks & watch-outs
- Watch-outs: built in 1955 — expect roof / HVAC / electrical / plumbing capex.
Questions for the listing agent
- Built in 1955 — when were the roof, HVAC, electrical panel, plumbing, and water heater last replaced?
- Is there a deadline driving the sale (1031 exchange, divorce, estate, relocation)? That informs how much negotiation room exists.
- Schools are D-rated, which usually means shorter tenancies and higher turnover. Who's the typical renter profile here, and what's been the actual vacancy rate?
- Crime grade is D in this area — have there been break-ins, vandalism, or insurance claims at this property in the last 3 years? What carrier currently insures it and at what premium?
- The area grade is low — what's the realistic commute time and amenity access for the typical tenant pool here? Any planned neighborhood developments (good or bad) we should know about?
- What's the average days-on-market for RENTAL listings here right now (not sales)? A rising rental-DOM trend means longer vacancies and softer asking-rent achievability than the comps imply.
- What's the recent tenant-quality profile in this submarket — average credit score on applications, eviction rate, late-payment / NSF rate, and stable-employment percentage? A property-management company in the area should have these aggregated.
- How much new for-sale + rental construction is in the pipeline within 1–3 miles? Heavy new supply typically softens prices + rents 12–24 months out; constrained supply supports both.
Investment metrics
- 1% rule
- 0.96% ✗
- Cap rate
- 6.97%
- Cash-on-cash
- 2.41%
- DSCR
- 1.11
- GRM
- 8.7
CMA / ARV
- ARV (on-the-fly)
- $101,971
- Comps found
- 12
Show comp detail 12 sales within ~0.75 mi
| Address | Dist | Beds/Ba | Sqft | Sold | Price | $/sf | Match |
|---|---|---|---|---|---|---|---|
| 543 Schuyler Ave | 0.28mi | 1/1.0 (-1) | 928 (-3%) | 2mo | $81,000 | $87 | 76 |
| 509 Race St | 0.16mi | 2/1.0 | 815 (-14%) | 0mo | $87,500 | $107 | 68 |
| 207 Morrow St | 0.44mi | 3/1.0 (+1) | 976 (+2%) | 8mo | $96,900 | $99 | 64 |
| 242 Home St | 0.50mi | 2/1.0 | 888 (-7%) | 7mo | $75,000 | $84 | 60 |
| 561 Post St | 0.55mi | 2/1.0 | 1,004 (+5%) | 8mo | $112,500 | $112 | 59 |
| 956 Erie St | 0.49mi | 3/1.0 (+1) | 960 (+1%) | 17mo | $70,000 | $73 | 57 |
| 415 Charlesmont Rd | 0.48mi | 2/1.0 | 1,008 (+6%) | 15mo | $111,300 | $110 | 56 |
| 1008 Parkside Dr | 0.48mi | 2/1.0 | 1,040 (+9%) | 10mo | $115,000 | $111 | 54 |
| 559 Post St | 0.56mi | 2/1.0 | 875 (-8%) | 10mo | $115,000 | $131 | 51 |
| 767 Erie St | 0.45mi | 3/1.5 (+1) | 1,036 (+9%) | 8mo | $23,000 | $22 | 51 |
| 206 Overland St | 0.42mi | 2/1.0 | 848 (-11%) | 16mo | $97,800 | $115 | 48 |
| 218 Brand St | 0.70mi | 3/1.0 (+1) | 1,008 (+6%) | 12mo | $22,000 | $22 | 43 |
Match score weights: distance 35% · size 25% · config 20% · recency 20%. Top-matched comps best support the ARV.
Projected returns pro-forma
-3.0% appreciation · 3.0% rent growth · sell at horizon
- IRR
- -12.5%
- Equity multiple
- 0.55×
- Total profit
- $-16,359
- Equity at exit
- $19,369
- IRR
- -3.3%
- Equity multiple
- 0.78×
- Total profit
- $-8,125
- Equity at exit
- $11,231
Cash invested: $36,372 (down + closing). Projections, not guarantees.
Landlord ↔ Tenant lean methodology
- Overall (STATE)
- 15 Strongly Tenant-Friendly
- State New York
- 15 Strongly Tenant-Friendly · D+10
- County
- — inherits STATE
- City
- — inherits STATE
ZIP-level market 14904
- Home prices YoY
- -9.6%
- Active inventory
- 104
- Price-to-rent
- 8.7×
Monthly cashflow live
- Estimated rent
- $1,251 high interval (Pro) →
- Mortgage (P&I)
- −$681
- Tax from tax record
- −$179 /mo · $2,154/yr
- Insurance
- −$54
- HOA
- −$0
- Vacancy / Maint / Mgmt
- −$263
- Net cashflow
- $73
Break-even live
Sensitivity live
| Price | -10% $147 | -5% $110 | +0% $73 | +5% $36 | +10% $0 |
|---|---|---|---|---|---|
| Rent | -10% $-26 | -5% $24 | +0% $73 | +5% $123 | +10% $172 |
| Rate | -1.0pp $139 | -0.5pp $106 | base $73 | +0.5pp $40 | +1.0pp $5 |
UW: 25.0% down · 7.5% · 30yr · 1.5% tax · 5.0% vac · 8.0% maint · 8.0% mgmt
Financing live
Cash to close
- Down payment
- $32,475
- Closing costs
- $3,897
- Reserves months
- —
- Total cash needed
- —
Loan-product check · same deal, 3 products live
Conventional
25% down · 7.5% · 30yr
- Down + closing
- —
- Monthly P&I
- —
- Monthly cashflow
- —
- DSCR
- —
- Eligible?
- —
Personal DTI + credit; lowest rate.
DSCR
20% down · 8.5% · 30yr
- Down + closing
- —
- Monthly P&I
- —
- Monthly cashflow
- —
- DSCR
- —
- Eligible?
- —
No personal income docs; deal must DSCR.
Hard money
10% down · 12.0% · 12mo
- Down + closing
- —
- Monthly P&I
- —
- Monthly cashflow
- —
- DSCR
- —
- Eligible?
- —
Short-term bridge; refi at stabilization.
Rent comps 5 comps
| Address | Beds | Baths | Sqft | Rent | $/sqft | DOM | Units | Dist |
|---|---|---|---|---|---|---|---|---|
| 752 S Main St Unit 2 Elmira, NY | 1.0 | 1.0 | 841 | $995 | $1.18 | 45d | 1 | 0.80mi |
| 235 Allen St Elmira, NY | 2.0 | 1.0 | 780 | $950 | $1.22 | 45d | 1 | 1.02mi |
| 419 Jefferson St Unit A Elmira, NY | 2.0 | 2.0 | 1100 | $1,995 | $1.81 | 45d | 1 | 1.23mi |
| 410 E 2nd St Unit FS3W Elmira, NY | 3.0 | 1.0 | 800 | $1,250 | $1.56 | 45d | 1 | 1.39mi |
| 363 W Water St #2 Elmira, NY | 3.0 | 1.0 | 1084 | $1,250 | $1.15 | 45d | 1 | 1.47mi |
Listing history 25 events
-
2026-06-21days on market $129,900 Active 23 DOM
-
2026-06-19days on market $129,900 Active 21 DOM
-
2026-06-18days on market $129,900 Active 20 DOM
-
2026-06-17days on market $129,900 Active 19 DOM
-
2026-06-16days on market $129,900 Active 18 DOM
-
2026-06-15days on market $129,900 Active 17 DOM
-
2026-06-14days on market $129,900 Active 15 DOM
-
2026-06-12days on market $129,900 Active 14 DOM
-
2026-06-09days on market $129,900 Active 11 DOM
-
2026-06-09price $129,900 Active 10 DOM
-
2026-06-08days on market $139,900 Active 10 DOM
-
2026-06-07days on market $139,900 Active 9 DOM
-
2026-06-05days on market $139,900 Active 6 DOM
-
2026-06-03days on market $139,900 Active 5 DOM
-
2026-06-02days on market $139,900 Active 4 DOM
-
2026-06-01days on market $139,900 Active 3 DOM
-
2026-05-31days on market $139,900 Active 2 DOM
-
2026-05-29$139,900 Active
-
2024-10-29soldstatus $65,000
-
2024-10-07soldstatus $65,000 564-char remark
Show marketing remark (564 chars)
Check out this cozy affordable ranch home just outside the city limit, yet still in town (still has public water and sewer). This home has some newer updates of flooring, paint and handmade bar in back room. This home boasts large addition on the back of the house which can be used as a 2nd living room, gathering area or recreation area for children. Efficiency is what you get with this home and there is a private back yard area and a 1 car detached garage for extra storage. Located on a side street with minimal traffic. Home is being sold "As Is".
-
2024-08-13$69,000 564-char remark
Show marketing remark (564 chars)
Check out this cozy affordable ranch home just outside the city limit, yet still in town (still has public water and sewer). This home has some newer updates of flooring, paint and handmade bar in back room. This home boasts large addition on the back of the house which can be used as a 2nd living room, gathering area or recreation area for children. Efficiency is what you get with this home and there is a private back yard area and a 1 car detached garage for extra storage. Located on a side street with minimal traffic. Home is being sold "As Is".
-
2022-01-31soldstatus $62,000
-
2022-01-28soldstatus $62,000 585-char remark
Show marketing remark (585 chars)
Make yourself at home with this super affordable Town of Southport ranch! This home sits just outside the city for great convenience, still having public water, sewer, & gas! Outside enjoy the paved driveway, maintenance free siding, nicely landscaped yard with mature privacy trees, deck and fencing in the back. Inside you will be greeted by hardwood floors in the living room, some bathroom updates, built in storage, and don't forget the big family room right off the kitchen. 3rd bedroom offers multiple uses. A great value in an established neighborhood, being sold 'as is'.
-
2021-09-27$59,000 585-char remark
Show marketing remark (585 chars)
Make yourself at home with this super affordable Town of Southport ranch! This home sits just outside the city for great convenience, still having public water, sewer, & gas! Outside enjoy the paved driveway, maintenance free siding, nicely landscaped yard with mature privacy trees, deck and fencing in the back. Inside you will be greeted by hardwood floors in the living room, some bathroom updates, built in storage, and don't forget the big family room right off the kitchen. 3rd bedroom offers multiple uses. A great value in an established neighborhood, being sold 'as is'.
-
1995-10-02soldstatus $56,500
ⓘ Source: listings_history table (triggers on properties + properties_extension) + one-shot
backfill from property_details.listing_events for pre-trigger history.
Tax reassessment forecast NY · Partial reset (capped growth)
- Current annual tax
- $2,154 · $179/mo
- Projected year-2 tax
- $2,175 · $181/mo
- Expected delta
- +$21/yr (+$2/mo · 1.0%)
ⓘ Screening estimate from a state-policy table — verify with the county assessor before closing.
Climate risk First Street
- Flood 4/10 Moderate FEMA zone X · 21% chance over 30 yrs
- Wildfire 1/10 Low
- Heat 3/10 Moderate 7 d/yr ≥96°F today · 16 d/yr by 30 yrs out
- Wind 2/10 Low 100% chance of damaging wind over 30 yrs
- Air quality 1/10 Low 0 unhealthy d/yr today · 0 by 30 yrs out
Nearby sold comps map
Loading sold comps map…
Walkable amenities ~0.75 mi
Loading nearby amenities…
Taxation est. · year 1
- Rental income
- $15,007
- − Mortgage interest
- −$7,276
- − Property taxes
- −$2,154
- − Insurance
- −$650
- − Repairs & maintenance
- −$1,201
- − Management
- −$1,201
- − Depreciation
- −$3,779
- Taxable loss
- −$1,252
- Est. tax savings @ 24.0%
- +$301
- After-tax cash flow
- $1,179/yr
For passive investors: Depreciation is non-cash, so a rental often shows a tax loss while cash-flowing — sheltering income. Rental losses are passive: they offset passive income freely, and up to $25,000/yr can offset ordinary (W-2) income if you actively participate and your MAGI is under $100k (phasing out to $0 by $150k); unused losses carry forward. On sale, claimed depreciation is recaptured at up to 25%, and gains may owe capital-gains tax (a 1031 exchange can defer both). Figures are a year-1 estimate at your 24.0% rate — not tax advice; consult a CPA.
Schools (NCES district)
- District
- Elmira City School District
- NCES district ID
- 3610560
- Math proficiency
- 23% ▼ -7.00%
- Reading proficiency
- 35% ▲ 7.00%
- Median HH income
- $40,180
- Composite
- 24.39/100
- National rank
- #7688
- State rank
- #580 of 590 in NY
Livability — Southport
- Score
- 65/100
- State rank
- #690
- US rank
- #13026
Category grades
Schools grade is shown separately in the Schools card above.
Census & demographics
- Census place
- Southport, NY
- City population
- 14,276
- Population (ZIP)
- 14,276
Population outlook (Chemung County) Hauer SSP2
- Today (2025)
- 82,931 people
- By 2030
- 80,356 · -3.1%
- By 2040
- 74,745 · -9.9%
- By 2050
- 69,012 · -16.8%
- By 2075
- 55,689 · -32.8%
- By 2100
- 41,428 · -50.0%
Race, ethnicity, and origin ACS 2023
- Neighborhood character
- Predominantly White (83%)
- Race & ethnicity
- White 83% Two or more races 7% Black 7% Hispanic / Latino 5% Native American 1%
- Common ancestry
- Romanian 7% Lithuanian 3% Slovak 2%
- Foreign-born
- 2% · Canada, Jamaica, Dominican Republic
- Languages at home
- 97% English-only · Spanish 2%
Political lean MEDSL · Chemung
- 2024 margin
- R (+16.8) · D 41.6% · R 58.4%
- 2008→2024 swing
- -15.6pp toward R · 2008: -1.2pp · 2024: -16.8pp
- All cycles
- 2024: R+16.8 2020: R+13.4 2016: R+20.0 2012: R+2.9 2008: R+1.2
Not yet ingested
- Civics
- —
Market trends
- HPI YoY
- ▼ -23.33%
- Current HPI
- 220.688
- Rent YoY
- —
- Metro
- —
- State GDP YoY
- ▲ 2.60%
- F500 in state
- 92
Industry mix (Fortune 500 HQ in NY)
| Industry | F500 HQs | Revenue |
|---|---|---|
| Financial Services | 10 | $950B |
|
||
| Consumer Goods | 9 | $162B |
|
||
| Insurance | 4 | $225B |
|
||
| Telecommunications | 2 | $144B |
|
||
| Pharmaceuticals | 2 | $112B |
|
||
| Media / Entertainment | 2 | $69B |
|
||
Price history
+147.6% since first listed8 events — show timeline
- 2026-05-29 Listed $139,900 UNYREIS
- 2024-10-29 Sold (Public Records) $65,000 Public Records
- 2024-10-07 Sold (MLS) $65,000 UNYREIS
- 2024-08-13 Listed $69,000 UNYREIS
- 2022-01-31 Sold (Public Records) $62,000 Public Records
- 2022-01-28 Sold (MLS) $62,000 UNYREIS
- 2021-09-27 Listed $59,000 UNYREIS
- 1995-10-02 Sold (Public Records) $56,500 Public Records
Property tax history
+1.4%/yrLatest (2025): $2,154 · -1.4% YoY. Source: county tax records.
Cash-flow waterfall
monthlySold comps — $/sqft
last 12 mo · ≤1 miLoading sold comps…