 🌊 Lakefront
700 Valley Stream Dr #101 · Lely, FL
Flood risk 9/10 · Severe
- FEMA flood zone
- X (shaded)
- Chance of flooding over 30 yrs
- 0.99%
- Est. flood insurance / yr
- $507 – $1,088
Fire risk 3/10 · Minor
- Est. fire insurance / yr
- $947 – $1,759
Heat risk 10/10 · Severe
- Hot days now (above 107°F)
- 7 days/yr
- Hot days in 30 yrs
- 28 days/yr
Wind risk 10/10 · Severe
- Chance of severe wind over 30 yrs
- 99.0%
Air-quality risk 2/10 · Minimal
- Unhealthy air days now
- 2 days/yr
- Unhealthy air days in 30 yrs
- 2 days/yr
Risk factors via First Street. Map © Google.
Why this score? — see what drove the B grade
The composite is a weighted blend of 9 inputs, each scored 0–100. Each bar is that input's sub-score; the figure is the points it added to the 100-point composite (weight × sub-score).
- Cash flow +30.0/30.0
- 1% rule +10.0/10.0
- DSCR +10.0/10.0
- ARV discount +7.5/15.0
- Schools +5.0/10.0
- Rent growth +3.9/5.0
- Livability +3.3/5.0
- Condition / age +2.5/5.0
- Appreciation +0.0/10.0
$140,000
🖨 Deal sheet 📄 Offer letter ✓ Due diligence
Listing remarks
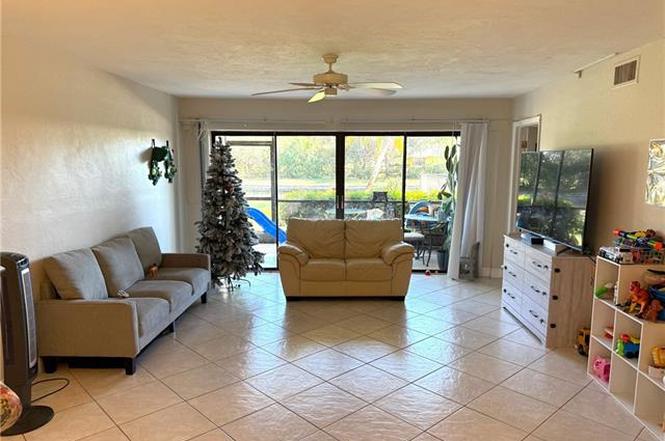
UNBELIEVEABLE PRICING! This charming first-floor condo offers 2 bedrooms, 2 full baths, and an assigned carport, making everyday living both comfortable and convenient. Price just reduced to an amazing $145,000. With 1,200 square feet of well-designed space and several recent upgrades, the home feels fresh, welcoming, and move-in ready. Step out to the screened lanai, where the community pool sits just steps away—perfect for relaxing, socializing, or enjoying the Florida sunshine. The location is ideal, with shopping, dining, and grocery options only a few short blocks away, plus public transportation readily available for easy access around town. SUBSTANTIAL Recent price reductions m
Key facts
- Detached carport
- New elevator
- Community pool
Tags
Property features AI
Finance
- Other: Unit is one of 15 units in the complex and building; single-floor unit; Subdivision: EL CAPISTRANO (LELY development); Directions: Tamiami or Rattlesnake to Valley Stream; unit is closer to Tamiami; Possession: Subject to lease
- HOA & community: Quarterly condo fee ($2,250); Condo management; Community amenities include BBQ/picnic area and community pool; Maintenance covers irrigation water, lawn/land maintenance, manager, sewer, trash removal and water; Community type: Condo/Hotel; Total annual recurring fees: $9,000 (annually); Total one-time fees: $100
Exterior
- Parking: 1 assigned parking space; Detached 1-car carport
- Utilities: Central water (assessment paid); Central sewer (assessment paid); Cable available; Electric service for heat and cooling (central electric)
- Home design: Residential low-rise (1–3 stories); Spanish-style building design; Rear exposure facing SE; Entry level: 1
- Construction: Concrete block construction; Stucco exterior finish; Tile roof; Built in 1982; Foundation information not specified
- Exterior features: Patio; Canal view / waterfront on a canal (canal width 81–120 ft); Zero lot line
Interior
- Kitchen: Pantry; Electric cooktop; Microwave; Refrigerator/Freezer; Disposal
- Bedrooms: 2 bedrooms with a split bedroom layout
- Flooring: Tile flooring
- Bathrooms: 2 full bathrooms; Master bath with shower only
- Heating & cooling: Central electric heat; Central electric cooling
- Interior features: High-speed internet available; Pantry; Smoke detectors; Great room floor plan; Screened lanai/porch; Common elevator
- Laundry & utility: Washer and Dryer in residence
Neighborhood map
What this means for you Summary
Snapshot
- This is a 2-bed/2.0-bath condo listed at $140k.
Deal economics
- At list price, monthly cash flow is $821 ($10k/yr) — positive.
- The deal already cash-flows at list — no discount required.
- Meets the 1% rule at list price ($3k rent vs $140k).
- Recommended offer: $123k (12.0% below list) — sets the bar for market timing.
Location & tenants
- Location reads 66/100 on livability (#586 in FL) — a middle-class / working-renter tenant base. Strengths: crime A+, housing A+; Watch: schools D+, health & safety D, amenities F.
- Collier (suburban): math 60% / reading 56% proficiency, ranked #16 of 73 in FL (top 22%) — acceptable for families but not a draw, mixed tenant base, ~2y average lease.
- Market conditions: Rents rising fast (+5.6%/yr); 597 active listings in the ZIP; 40 comparable units currently listed for rent nearby; rentals at typical pace (median 24d on market — plan ~3-4 weeks tenant-placement turnaround); solid renter incomes; 3,520 units permitted in Collier County in 2024 (959 in 5+ unit buildings).
- At $3,284/mo this rent would consume 48% of the median local household income ($82k/yr) (locally 954% of renters already pay >50% of income on rent) — very limited rent-growth headroom before tenants either downsize or default.
Forward outlook
- Local home prices are declining (-3.0%/yr); year-one equity from $968 of loan paydown is wiped out by about $4k of value loss. Plan a longer hold.
- Collier County population projected at +30% by 2050 — long-run rental-demand tailwind backs the buy-and-hold thesis.
- At projected returns (-3.0% appreciation + 5.6% rent growth), your $39k cash investment doubles in ~5 years — after that, you're playing with house money.
Negotiation context
- It's been on market 202 days — a 12% lower offer ($123k) is reasonable based on typical stale-listing flexibility.
- 4 sale attempts since 7y ago; this cycle's ask has dropped $110k (44%) from the opening price — seller is motivated, your offer sets the floor, not the list.
- Current owner paid $120k; 17% above their basis — modest negotiation headroom, anchor on the comps not their cost.
Risks & watch-outs
- Watch-outs: flood insurance adds $66/mo; HOA is 23% of rent.
- Climate carrying-cost: severe flood risk; severe wind risk, 99% chance of damaging wind over 30y; extreme-heat days projected 7→28/yr by 2055 (HVAC capex compounding) — expect insurance premiums to compound above CPI over the hold.
Questions for the listing agent
- It's been on market 202 days. Have you received any prior offers? Is the seller open to a 12% concession, seller financing, or rate buy-down credit?
- What's the actual annual flood-insurance premium (NFIP or private), and is the property in a SFHA with mandatory coverage?
- What does the HOA fee cover, when was the last increase, and are there any pending special assessments or reserve-fund shortfalls?
- Any open or pending special assessments — roof, HVAC, plumbing, elevator, façade? What's the per-unit balance and payoff schedule, and is the seller paying it off at close or rolling it to the buyer?
- Why hasn't it sold? Are there any deal-killer items the seller is aware of (foundation, flood, title, zoning, code violations)?
- Is there a deadline driving the sale (1031 exchange, divorce, estate, relocation)? That informs how much negotiation room exists.
- Schools are D-rated, which usually means shorter tenancies and higher turnover. Who's the typical renter profile here, and what's been the actual vacancy rate?
- This sits on a lake — are riparian / water-frontage rights deeded with the parcel? Any dock permits, shoreline easements, or HOA water-use restrictions?
- What's the documented flood / surge / shoreline-erosion history here (FEMA AND non-FEMA — e.g., storm surge, creek backup, septic-field saturation)?
- Any water-quality or seasonal algae-bloom issues that affect tenant satisfaction or short-term-rental demand?
- What's the average days-on-market for RENTAL listings here right now (not sales)? A rising rental-DOM trend means longer vacancies and softer asking-rent achievability than the comps imply.
- What's the recent tenant-quality profile in this submarket — average credit score on applications, eviction rate, late-payment / NSF rate, and stable-employment percentage? A property-management company in the area should have these aggregated.
- How much new apartment / multifamily construction is in the pipeline within 1–3 miles? Heavy new supply (>2% of stock underway) typically softens rents 12–24 months out; light construction supports rent growth.
Investment metrics
- 1% rule
- 2.35% ✓
- Cap rate
- 13.90%
- Cash-on-cash
- 27.17%
- DSCR
- 2.21
- GRM
- 3.6
CMA / ARV
No comps found within radius.
Projected returns pro-forma
-3.0% appreciation · 5.59% rent growth · sell at horizon
- IRR
- 23.0%
- Equity multiple
- 1.99×
- Total profit
- $38,928
- Equity at exit
- $20,874
- IRR
- 33.3%
- Equity multiple
- 4.61×
- Total profit
- $141,432
- Equity at exit
- $12,105
Cash invested: $39,200 (down + closing). Projections, not guarantees.
Landlord ↔ Tenant lean methodology
- Overall (STATE)
- 87 Strongly Landlord-Friendly
- State Florida
- 87 Strongly Landlord-Friendly · R+3
- County
- — inherits STATE
- City
- — inherits STATE
ZIP-level market 34113
- Rents YoY
- 5.6%
- Active inventory
- 597
- Price-to-rent
- 3.6×
Monthly cashflow live
- Estimated rent
- $3,284 high interval (Pro) →
- Mortgage (P&I)
- −$734
- Tax from tax record
- −$164 /mo · $1,970/yr
- Insurance
- −$58
- Flood insurance flood zone
- −$66 /mo · $798/yr
- HOA
- −$750
- Vacancy / Maint / Mgmt
- −$690
- Net cashflow
- $821
Break-even live
UW: 25.0% down · 7.5% · 30yr · 1.5% tax · 5.0% vac · 8.0% maint · 8.0% mgmt
Financing live
Cash to close
- Down payment
- $35,000
- Closing costs
- $4,200
- Reserves months
- —
- Total cash needed
- —
Loan-product check · same deal, 3 products live
Conventional
25% down · 7.5% · 30yr
- Down + closing
- —
- Monthly P&I
- —
- Monthly cashflow
- —
- DSCR
- —
- Eligible?
- —
Personal DTI + credit; lowest rate.
DSCR
20% down · 8.5% · 30yr
- Down + closing
- —
- Monthly P&I
- —
- Monthly cashflow
- —
- DSCR
- —
- Eligible?
- —
No personal income docs; deal must DSCR.
Hard money
10% down · 12.0% · 12mo
- Down + closing
- —
- Monthly P&I
- —
- Monthly cashflow
- —
- DSCR
- —
- Eligible?
- —
Short-term bridge; refi at stabilization.
Rent comps 40 comps
| Address | Beds | Baths | Sqft | Rent | $/sqft | DOM | Units | Dist |
|---|---|---|---|---|---|---|---|---|
| 4977 Pepper Cir #205 Naples, FL | 2.0 | 2.0 | 1250 | $2,250 | $1.80 | 21d | 1 | 0.14mi |
| 300 Valley Stream Dr Unit 3D Naples, FL | 2.0 | 2.0 | 979 | $1,795 | $1.83 | 21d | 1 | 0.16mi |
| 300 Valley Stream Dr Unit 3D Naples, FL | 2.0 | 2.0 | 979 | $1,795 | $1.83 | 23d | 1 | 0.16mi |
| 200 Valley Stream Dr Unit 8B Naples, FL | 2.0 | 2.0 | 979 | $1,750 | $1.79 | 23d | 1 | 0.20mi |
| 5483 Rattlesnake Hammock Rd Unit 201B Naples, FL | 2.0 | 2.0 | 1071 | $1,800 | $1.68 | 13d | 1 | 0.25mi |
| 4900 Biscayne Dr #22 Naples, FL | 2.0 | 2.0 | 1108 | $1,800 | $1.62 | 21d | 1 | 0.32mi |
| 4830 Cortez Cir Naples, FL | 3.0 | 2.0 | 1218 | $3,100 | $2.55 | 23d | 1 | 0.44mi |
| 4907 Catalina Dr Unit 45 Naples, FL | 3.0 | 2.0 | 1270 | $1,900 | $1.50 | 13d | 1 | 0.44mi |
| 4360 Petal Dr Naples, FL | 3.0 | 1.0–2.0 | 1018 | $2,566 | $2.52 | 13d | 37 | 0.45mi |
| 4911 Catalina Dr Unit 22 Naples, FL | 3.0 | 1.5 | 1200 | $1,950 | $1.62 | 13d | 1 | 0.45mi |
| 232 Pebble Beach Blvd #104 Naples, FL | 3.0 | 2.0 | 1298 | $1,975 | $1.52 | 23d | 1 | 0.46mi |
| 190 Pebble Beach Blvd #301 Naples, FL | 2.0 | 2.0 | 954 | $1,700 | $1.78 | 23d | 1 | 0.48mi |
| 240 Pebble Beach Blvd #702 Naples, FL | 2.0 | 2.0 | 1090 | $4,000 | $3.67 | 23d | 1 | 0.55mi |
| 5419 Rattlesnake Hammock Rd Unit 307F Naples, FL | 2.0 | 2.0 | 1071 | $1,950 | $1.82 | 13d | 1 | 0.61mi |
| 4300 Gulfstream Dr Unit 2D Naples, FL | 2.0 | 2.0 | 1115 | $1,295 | $1.16 | 23d | 1 | 0.63mi |
| 4290 Gulfstream Dr #5 Naples, FL | 2.0 | 2.0 | 956 | $1,600 | $1.67 | 23d | 1 | 0.66mi |
| 332 Charlemagne Blvd Unit H103 Naples, FL | 2.0 | 2.0 | 1082 | $3,495 | $3.23 | 23d | 1 | 0.68mi |
| 332 Charlemagne Blvd Unit H101 Naples, FL | 2.0 | 2.0 | 1082 | $3,500 | $3.23 | 23d | 1 | 0.68mi |
| 6984 Saona Ct Naples, FL | 2.0 | 2.0 | 1472 | $7,500 | $5.10 | 23d | 1 | 0.68mi |
| 7259 Cayo Coco Ln Naples, FL | 2.0 | 2.0 | 1411 | $6,500 | $4.61 | 23d | 1 | 0.69mi |
| 7263 Cayo Coco Ln Naples, FL | 2.0 | 2.0 | 1321 | $6,500 | $4.92 | 23d | 1 | 0.69mi |
| 5499 Rattlesnake Hammock Rd Naples, FL | 2.0 | 2.0 | 1071 | $1,775 | $1.66 | 13d | 2 | 0.70mi |
| 4231 Gulfstream Dr Apt 102 Naples, FL | 3.0 | 2.0 | 1178 | $1,995 | $1.69 | 13d | 1 | 0.70mi |
| 7299 Cayo Coco Ln Naples, FL | 2.0 | 2.0 | 1476 | $6,500 | $4.40 | 23d | 1 | 0.71mi |
| 7204 Cayo Coco Ln Naples, FL | 2.0 | 2.0 | 1308 | $7,500 | $5.73 | 23d | 1 | 0.71mi |
| 7142 Cayo Coco Ln Naples, FL | 2.0 | 2.0 | 1490 | $10,000 | $6.71 | 23d | 1 | 0.71mi |
| 7138 Cayo Coco Ln Naples, FL | 2.0 | 2.0 | 1205 | $6,500 | $5.39 | 23d | 1 | 0.72mi |
| 7110 Cayo Coco Ln Naples, FL | 2.0 | 2.0 | 1387 | $9,250 | $6.67 | 23d | 1 | 0.72mi |
| 7289 Saona Ct Naples, FL | 2.0 | 2.0 | 1411 | $10,000 | $7.09 | 23d | 1 | 0.73mi |
| 3625 Boca Ciega Dr Naples, FL | 2.0 | 2.0 | 930 | $2,400 | $2.58 | 23d | 2 | 0.74mi |
| 7197 Saona Ct Unit 1545994P Naples, FL | 2.0 | 2.0 | 1291 | $4,152 | $3.22 | 13d | 1 | 0.75mi |
| 360 Charlemagne Blvd Unit D105 Naples, FL | 2.0 | 2.0 | 1082 | $3,200 | $2.96 | 23d | 1 | 0.76mi |
| 7213 Saona Ct Naples, FL | 2.0 | 2.0 | 1308 | $7,500 | $5.73 | 23d | 1 | 0.76mi |
| 7286 Saona Ct Naples, FL | 2.0 | 2.0 | 1205 | $10,000 | $8.30 | 23d | 1 | 0.77mi |
| 7242 Saona Ct Naples, FL | 2.0 | 2.0 | 1204 | $7,750 | $6.44 | 23d | 1 | 0.78mi |
| 7124 Saona Ct Naples, FL | 2.0 | 2.0 | 1387 | $8,000 | $5.77 | 23d | 1 | 0.79mi |
| 5595 Greenwood Cir #92 Naples, FL | 3.0 | 2.0 | 1450 | $5,000 | $3.45 | 23d | 1 | 0.80mi |
| 4410 Chantelle Dr Unit H-205 Naples, FL | 2.0 | 2.0 | 1349 | $3,500 | $2.59 | 13d | 1 | 0.80mi |
| 2093 Pine Isle Ln #2093 Naples, FL | 2.0 | 2.0 | 927 | $1,695 | $1.83 | 23d | 1 | 0.82mi |
| 7162 Saona Ct Naples, FL | 2.0 | 2.0 | 1482 | $9,000 | $6.07 | 23d | 1 | 0.82mi |
HOA detail condo
- Monthly dues
- $750 · $9,000/yr
- Likely covers
- pool
- Assessments
- None detected in remarks — confirm with the listing agent.
Listing history 44 events
-
2026-06-18days on market $140,000 Active 202 DOM
-
2026-06-17days on market $140,000 Active 201 DOM
-
2026-06-16days on market $140,000 Active 200 DOM
-
2026-06-15pricedays on market $140,000 Active 199 DOM
-
2026-06-10days on market $145,000 Active 194 DOM
-
2026-06-09days on market $145,000 Active 193 DOM
-
2026-06-08days on market $145,000 Active 192 DOM
-
2026-06-07days on market $145,000 Active 191 DOM
-
2026-06-03days on market $145,000 Active 187 DOM
-
2026-06-02days on market $145,000 Active 186 DOM
-
2026-06-01days on market $145,000 Active 185 DOM
-
2026-05-31days on market $145,000 Active 184 DOM
-
2026-05-30days on market $145,000 Active 183 DOM
-
2026-05-23price $145,000
-
2026-05-08price $175,000
-
2026-04-14price $185,000
-
2026-04-08price $195,000
-
2026-04-04price $210,000
-
2026-03-22price $215,000
-
2026-03-04price $225,000
-
2026-02-11price $230,000
-
2026-01-29price $239,500
-
2026-01-04price $244,500
-
2025-11-28$249,500 Active
-
2025-05-31historical
-
2025-02-28price $264,795
-
2025-01-28price $269,795
-
2024-12-21price $279,750
-
2024-12-10price $289,750
-
2024-11-29$299,750 Active
-
2024-10-09historical
-
2024-07-05price $305,000
-
2024-05-30price $310,000
-
2024-04-18price $315,000
-
2024-03-30price $325,000
-
2024-03-21$339,000 Active
-
2019-09-13soldstatus $120,000
-
2019-09-12soldstatus $120,000 Sold
-
2019-08-29status Pending
-
2019-08-27$125,000 Active
-
2005-03-01soldstatus $154,500
-
2004-12-16soldstatus $132,500
-
1987-06-01soldstatus $45,000
-
1981-10-01soldstatus $79,900
ⓘ Source: listings_history table (triggers on properties + properties_extension) + one-shot
backfill from property_details.listing_events for pre-trigger history.
Tax reassessment forecast FL · Resets to sale price
- Current annual tax
- $1,970 · $164/mo
- Projected year-2 tax
- $1,970 · $164/mo
- Expected delta
- $0/yr ($0/mo · 0.0%)
ⓘ Screening estimate from a state-policy table — verify with the county assessor before closing.
Climate risk First Street
- Flood 9/10 Extreme FEMA zone X (shaded) · 99% chance over 30 yrs
- Wildfire 3/10 Moderate
- Heat 10/10 Extreme 7 d/yr ≥107°F today · 28 d/yr by 30 yrs out
- Wind 10/10 Extreme 99% chance of damaging wind over 30 yrs
- Air quality 2/10 Low 2 unhealthy d/yr today · 2 by 30 yrs out
Nearby sold comps map
Loading sold comps map…
Walkable amenities ~0.75 mi
Loading nearby amenities…
Taxation est. · year 1
- Rental income
- $39,404
- − Mortgage interest
- −$7,842
- − Property taxes
- −$1,970
- − Insurance
- −$1,498
- − Repairs & maintenance
- −$3,152
- − Management
- −$3,152
- − HOA
- −$9,000
- − Depreciation
- −$4,073
- Taxable income
- $8,718
- Est. tax owed @ 24.0%
- −$2,092
- After-tax cash flow
- $7,760/yr
For passive investors: Depreciation is non-cash, so a rental often shows a tax loss while cash-flowing — sheltering income. Rental losses are passive: they offset passive income freely, and up to $25,000/yr can offset ordinary (W-2) income if you actively participate and your MAGI is under $100k (phasing out to $0 by $150k); unused losses carry forward. On sale, claimed depreciation is recaptured at up to 25%, and gains may owe capital-gains tax (a 1031 exchange can defer both). Figures are a year-1 estimate at your 24.0% rate — not tax advice; consult a CPA.
Schools (NCES district)
- District
- Collier
- NCES district ID
- 1200330
- Math proficiency
- 60% ▼ -4.00%
- Reading proficiency
- 56% ▼ -2.00%
- Median HH income
- $58,275
- Composite
- 50.23/100
- National rank
- #1892
- State rank
- #16 of 73 in FL
Livability — Lely
- Score
- 66/100
- State rank
- #586
- US rank
- #11224
Category grades
Schools grade is shown separately in the Schools card above.
Census & demographics
- County
- Collier County · 396,295 people
- Metro
- Naples-Marco Island, FL
- Population (ZIP)
- 26,056
- Household income
- $81,674
- Rent vs Own
- Severe rent burden
- 954.0
Population outlook (Collier County) Hauer SSP2
- Today (2025)
- 420,858 people
- By 2030
- 450,054 · +6.9%
- By 2040
- 502,232 · +19.3%
- By 2050
- 544,932 · +29.5%
- By 2075
- 627,203 · +49.0%
- By 2100
- 659,015 · +56.6%
Race, ethnicity, and origin ACS 2023
- Neighborhood character
- Diverse neighborhood (Simpson 0.59)
- Race & ethnicity
- White 56% Hispanic / Latino 28% Black 12% Two or more races 11% Asian 2%
- Hispanic origin (detail)
- Mexican 17% Puerto Rican 3% Cuban 2%
- Common ancestry
- Hispanic 10% Romanian 3% Lithuanian 2%
- Foreign-born
- 26% · Canada, Jamaica, Vietnam
- Languages at home
- 63% English-only · Spanish 24% French/Haitian/Cajun 9% Other Indo-European 2%
Political lean MEDSL · Collier
- 2024 margin
- Solid R (+33.1) · D 33.1% · R 66.2%
- 2008→2024 swing
- -10.6pp toward R · 2008: -22.5pp · 2024: -33.1pp
- All cycles
- 2024: R+33.1 2020: R+24.7 2016: R+26.0 2012: R+30.1 2008: R+22.5
Not yet ingested
- Civics
- —
Market trends
- HPI YoY
- ▼ -194.86%
- Current HPI
- 279.4232
- Rent YoY
- ▲ 5.59%
- Metro
- Naples-Marco Island, FL
- State GDP YoY
- ▲ 3.28%
- F500 in state
- 36
Industry mix (Fortune 500 HQ in FL)
| Industry | F500 HQs | Revenue |
|---|---|---|
| Industrial Technology | 2 | $29B |
|
||
| Insurance | 2 | $17B |
|
||
| Retail | 1 | $60B |
|
||
| Technology Distribution | 1 | $58B |
|
||
| Homebuilding | 1 | $35B |
|
||
| Technology Manufacturing | 1 | $35B |
|
||
Price history
+81.5% since first listed31 events — show timeline
- 2026-05-23 Price Changed $145,000 NAPLESMLS
- 2026-05-08 Price Changed $175,000 NAPLESMLS
- 2026-04-14 Price Changed $185,000 NAPLESMLS
- 2026-04-08 Price Changed $195,000 NAPLESMLS
- 2026-04-04 Price Changed $210,000 NAPLESMLS
- 2026-03-22 Price Changed $215,000 NAPLESMLS
- 2026-03-04 Price Changed $225,000 NAPLESMLS
- 2026-02-11 Price Changed $230,000 NAPLESMLS
- 2026-01-29 Price Changed $239,500 NAPLESMLS
- 2026-01-04 Price Changed $244,500 NAPLESMLS
- 2025-11-28 Listed $249,500 NAPLESMLS
- 2025-05-31 Listing Removed — NAPLESMLS
- 2025-02-28 Price Changed $264,795 NAPLESMLS
- 2025-01-28 Price Changed $269,795 NAPLESMLS
- 2024-12-21 Price Changed $279,750 NAPLESMLS
- 2024-12-10 Price Changed $289,750 NAPLESMLS
- 2024-11-29 Listed $299,750 NAPLESMLS
- 2024-10-09 Listing Removed — NAPLESMLS
- 2024-07-05 Price Changed $305,000 NAPLESMLS
- 2024-05-30 Price Changed $310,000 NAPLESMLS
- 2024-04-18 Price Changed $315,000 NAPLESMLS
- 2024-03-30 Price Changed $325,000 NAPLESMLS
- 2024-03-21 Listed $339,000 NAPLESMLS
- 2019-09-13 Sold (Public Records) $120,000 Public Records
- 2019-09-12 Sold (MLS) $120,000 NAPLESMLS
- 2019-08-29 Pending — NAPLESMLS
- 2019-08-27 Listed $125,000 NAPLESMLS
- 2005-03-01 Sold (Public Records) $154,500 Public Records
- 2004-12-16 Sold (Public Records) $132,500 Public Records
- 1987-06-01 Sold (Public Records) $45,000 Public Records
- 1981-10-01 Sold (Public Records) $79,900 Public Records
Property tax history
+9.2%/yrLatest (2025): $1,970 · +9.0% YoY. Source: county tax records.
Cash-flow waterfall
monthlySold comps — $/sqft
last 12 mo · ≤1 miLoading sold comps…