233 Buena Vista St · Paris, IL
Flood risk 1/10 · Minimal
- FEMA flood zone
- X (unshaded)
- Chance of flooding over 30 yrs
- 0.0%
- Est. flood insurance / yr
- $473 – $860
Fire risk 1/10 · Minimal
- Est. fire insurance / yr
- $804 – $1,492
Heat risk 4/10 · Minor
- Hot days now (above 105°F)
- 7 days/yr
- Hot days in 30 yrs
- 19 days/yr
Wind risk 2/10 · Minimal
- Chance of severe wind over 30 yrs
- 1.0%
Air-quality risk 4/10 · Minor
- Unhealthy air days now
- 3 days/yr
- Unhealthy air days in 30 yrs
- 5 days/yr
Risk factors via First Street. Map © Google.
Why this score? — see what drove the F grade
The composite is a weighted blend of 9 inputs, each scored 0–100. Each bar is that input's sub-score; the figure is the points it added to the 100-point composite (weight × sub-score).
- ARV discount +7.5/15.0
- Livability +3.6/5.0
- Schools +2.8/10.0
- Rent growth +2.5/5.0
- Condition / age +2.5/5.0
- Cash flow +0.0/30.0
- 1% rule +0.0/10.0
- DSCR +0.0/10.0
- Appreciation +0.0/10.0
$20,000
🖨 Deal sheet 📄 Offer letter ✓ Due diligence
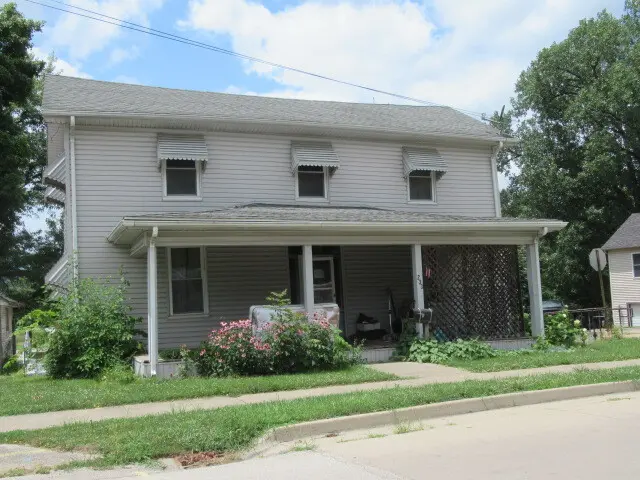
Listing remarks
Classic two story house. Windows on all sides peek out from under awnings. A covered front porch runs the width of the front of the house. Lattice on the front porch provides shade to a seating area. Vinyl siding helps lower the maintenance work and cost.
Key facts
- Listed 2 days
Property features AI
Finance
- Other: Property is in an unincorporated area (Symmes township); Directions: South on 150 to Paris, east on Union to Buena Vista, south to house
- HOA & community: No master association fee required
Exterior
- Utilities: Public water; Public sewer
- Home design: Detached single-family home; 2 stories; Fee simple ownership; Built before 1978
- Construction: Frame construction
- Exterior features: Lot less than 0.25 acre; Lot dimensions: 6940
Interior
- Kitchen: Kitchen on main level (10 x 10)
- Bedrooms: 4 bedrooms; Master bedroom on main level (13 x 10); Bedroom on second level (13 x 10); Bedroom on second level (12 x 10); Bedroom on second level (10 x 12)
- Bathrooms: 1 full bathroom
- Heating & cooling: Natural gas heating
- Interior features: 7 total rooms; Family room; Living room; Dining room; Laundry room
- Laundry & utility: Dedicated laundry room
Neighborhood map
What this means for you Summary
Snapshot
- This is a 4-bed/1.0-bath single-family listed at $20k.
Deal economics
- At list price, monthly cash flow is $-122 ($-1k/yr) — negative.
- Rent doesn't cover operating costs at any purchase price — skip.
- Cap rate -1.0% vs local median 8.3% in Paris — below-typical yield; the buyer is paying a premium for something (appreciation thesis, condition, location) that the cap rate doesn't capture.
Location & tenants
- Location reads 71/100 on livability (#342 in IL) — a middle-class / working-renter tenant base. Strengths: cost of living A+, housing A+, health & safety A+; Watch: employment D, crime F, amenities F.
- Paris-Union SD 95 (town): math 25% / reading 42% proficiency, ranked #227 of 620 in IL (top 37%) — families likely to look elsewhere, expect single-tenant / working-renter base with shorter leases.
- Market conditions: 82 active listings in the ZIP; 6 units permitted in Edgar County in 2024 (0 in 5+ unit buildings).
Forward outlook
- Local home prices are declining (-3.0%/yr); year-one equity from $138 of loan paydown is wiped out by about $600 of value loss. Plan a longer hold.
- Edgar County population projected at -30% by 2050 — secular population decline; favor cash flow + early exit over multi-decade hold.
Negotiation context
- Only 3 days on market — expect competitive offers; lowballing is unlikely to land.
- 5 sale attempts with the ask held roughly flat each time — persistent listings suggest the price (not the market) is what's stuck; bring a comps-based counter.
Questions for the listing agent
- What do current leases actually rent for vs. the listed asking? Can we see a recent rent roll and the last 12 months of T-12 income?
- Is there a deadline driving the sale (1031 exchange, divorce, estate, relocation)? That informs how much negotiation room exists.
- Crime grade is F in this area — have there been break-ins, vandalism, or insurance claims at this property in the last 3 years? What carrier currently insures it and at what premium?
- The area grade is low — what's the realistic commute time and amenity access for the typical tenant pool here? Any planned neighborhood developments (good or bad) we should know about?
- What's the average days-on-market for RENTAL listings here right now (not sales)? A rising rental-DOM trend means longer vacancies and softer asking-rent achievability than the comps imply.
- What's the recent tenant-quality profile in this submarket — average credit score on applications, eviction rate, late-payment / NSF rate, and stable-employment percentage? A property-management company in the area should have these aggregated.
- How much new for-sale + rental construction is in the pipeline within 1–3 miles? Heavy new supply typically softens prices + rents 12–24 months out; constrained supply supports both.
Investment metrics
- 1% rule
- 0.00% ✗
- Cap rate
- -1.05%
- Cash-on-cash
- -26.22%
- DSCR
- -0.17
- GRM
- 0.0
CMA / ARV
- ARV (median comp)
- $119,541
- List price
- $20,000
- Delta
- -79.09%
- Verdict
- UNDERPRICED
- Comps
- 20 within 1.0 mi
Show comp detail 12 sales within ~0.75 mi
| Address | Dist | Beds/Ba | Sqft | Sold | Price | $/sf | Match |
|---|---|---|---|---|---|---|---|
| 5 Magnolia Mnr | 0.12mi | 3/2.0 (-1) | 1,646 | 4mo | $136,000 | $83 | 70 |
| 525 Prairie St | 0.54mi | 4/2.0 | 2,244 | 0mo | $125,000 | $56 | 58 |
| 719 Connelly St | 0.51mi | 3/1.0 (-1) | 1,346 | 1mo | $115,000 | $85 | 58 |
| 512 E Court St | 0.40mi | 3/2.5 (-1) | 1,988 | 3mo | $213,500 | $107 | 56 |
| 627 Hannah Ave | 0.57mi | 3/1.0 (-1) | 1,124 | 2mo | $115,000 | $102 | 54 |
| 416 Douglas St | 0.63mi | 4/2.0 | 3,808 | 0mo | $20,000 | $5 | 54 |
| 413 W Court St | 0.59mi | 4/2.0 | 3,398 | 4mo | $46,000 | $14 | 53 |
| 410 Ten Broeck St | 0.59mi | 4/2.0 | 2,285 | 4mo | $55,000 | $24 | 53 |
| 112 S Eads Ave | 0.63mi | 3/2.0 (-1) | 1,648 | 1mo | $212,000 | $129 | 49 |
| 305 W Crawford St | 0.61mi | 3/2.0 (-1) | 1,287 | 2mo | $143,000 | $111 | 48 |
| 405 W Madison St | 0.62mi | 3/2.0 (-1) | 1,660 | 3mo | $148,000 | $89 | 47 |
| 320 E Jasper St | 0.74mi | 3/1.0 (-1) | 1,102 | 1mo | $82,000 | $74 | 47 |
Match score weights: distance 35% · size 25% · config 20% · recency 20%. Top-matched comps best support the ARV.
Projected returns pro-forma
-3.0% appreciation · 3.0% rent growth · sell at horizon
- IRR
- -76.4%
- Equity multiple
- -0.97×
- Total profit
- $-11,044
- Equity at exit
- $2,982
- IRR
- —
- Equity multiple
- -2.52×
- Total profit
- $-19,691
- Equity at exit
- $1,729
Cash invested: $5,600 (down + closing). Projections, not guarantees.
Landlord ↔ Tenant lean methodology
- Overall (STATE)
- 43 Moderately Tenant-Leaning
- State Illinois
- 43 Moderately Tenant-Leaning · D+7
- County
- — inherits STATE
- City
- — inherits STATE
ZIP-level market 61944
- Active inventory
- 82
Monthly cashflow live
- Estimated rent
- $0 none
- Mortgage (P&I)
- −$105
- Tax from tax record
- −$9 /mo · $110/yr
- Insurance
- −$8
- HOA
- −$0
- Vacancy / Maint / Mgmt
- −$0
- Net cashflow
- $-122
Break-even live
UW: 25.0% down · 7.5% · 30yr · 1.5% tax · 5.0% vac · 8.0% maint · 8.0% mgmt
Financing live
Cash to close
- Down payment
- $5,000
- Closing costs
- $600
- Reserves months
- —
- Total cash needed
- —
Loan-product check · same deal, 3 products live
Conventional
25% down · 7.5% · 30yr
- Down + closing
- —
- Monthly P&I
- —
- Monthly cashflow
- —
- DSCR
- —
- Eligible?
- —
Personal DTI + credit; lowest rate.
DSCR
20% down · 8.5% · 30yr
- Down + closing
- —
- Monthly P&I
- —
- Monthly cashflow
- —
- DSCR
- —
- Eligible?
- —
No personal income docs; deal must DSCR.
Hard money
10% down · 12.0% · 12mo
- Down + closing
- —
- Monthly P&I
- —
- Monthly cashflow
- —
- DSCR
- —
- Eligible?
- —
Short-term bridge; refi at stabilization.
Listing history 20 events
-
2026-06-18days on market $20,000 Active 3 DOM
-
2026-06-17days on market $20,000 Active 2 DOM
-
2026-06-16pricedays on market $20,000 Active 1 DOM
-
2026-06-09days on market $25,000 Active 82 DOM
-
2026-06-08days on market $25,000 Active 81 DOM
-
2026-06-07days on market $25,000 Active 80 DOM
-
2026-06-07days on market $25,000 Active 79 DOM
-
2026-06-04days on market $25,000 Active 76 DOM
-
2026-06-02days on market $25,000 Active 75 DOM
-
2026-06-01days on market $25,000 Active 74 DOM
-
2026-05-31days on market $25,000 Active 73 DOM
-
2026-05-31days on market $25,000 Active 72 DOM
-
2026-04-19price $25,000 259-char remark
-
2026-03-18$30,000 Active 259-char remark
-
2025-11-21historical
-
2025-10-27status Active
-
2025-10-11historical
-
2025-07-14historical
-
2025-07-11Active
-
2025-04-18$50,000 Active
ⓘ Source: listings_history table (triggers on properties + properties_extension) + one-shot
backfill from property_details.listing_events for pre-trigger history.
Tax reassessment forecast IL · Partial reset (capped growth)
- Current annual tax
- $110 · $9/mo
- Projected year-2 tax
- $282 · $23/mo
- Expected delta
- +$172/yr (+$14/mo · 156.9%)
ⓘ Screening estimate from a state-policy table — verify with the county assessor before closing.
Climate risk First Street
- Flood 1/10 Low FEMA zone X (unshaded) · 0% chance over 30 yrs
- Wildfire 1/10 Low
- Heat 4/10 Moderate 7 d/yr ≥105°F today · 19 d/yr by 30 yrs out
- Wind 2/10 Low 100% chance of damaging wind over 30 yrs
- Air quality 4/10 Moderate 3 unhealthy d/yr today · 5 by 30 yrs out
Nearby sold comps map
Loading sold comps map…
Walkable amenities ~0.75 mi
Loading nearby amenities…
Taxation est. · year 1
- Rental income
- $0
- − Mortgage interest
- −$1,120
- − Property taxes
- −$110
- − Insurance
- −$100
- − Repairs & maintenance
- −$0
- − Management
- −$0
- − Depreciation
- −$582
- Taxable loss
- −$1,912
- Est. tax savings @ 24.0%
- +$459
- After-tax cash flow
- $-1,009/yr
For passive investors: Depreciation is non-cash, so a rental often shows a tax loss while cash-flowing — sheltering income. Rental losses are passive: they offset passive income freely, and up to $25,000/yr can offset ordinary (W-2) income if you actively participate and your MAGI is under $100k (phasing out to $0 by $150k); unused losses carry forward. On sale, claimed depreciation is recaptured at up to 25%, and gains may owe capital-gains tax (a 1031 exchange can defer both). Figures are a year-1 estimate at your 24.0% rate — not tax advice; consult a CPA.
Schools (NCES district)
- District
- Paris-Union SD 95
- NCES district ID
- 1730750
- Math proficiency
- 25% ▼ -4.00%
- Reading proficiency
- 42% ▼ -7.00%
- Median HH income
- $36,294
- Composite
- 27.73/100
- National rank
- #6901
- State rank
- #227 of 620 in IL
Livability — Paris
- Score
- 71/100
- State rank
- #342
- US rank
- #6933
Category grades
Schools grade is shown separately in the Schools card above.
Census & demographics
- Census place
- Paris, IL
- City population
- 11,426
- Population (ZIP)
- 11,426
Population outlook (Edgar County) Hauer SSP2
- Today (2025)
- 15,960 people
- By 2030
- 14,978 · -6.2%
- By 2040
- 12,990 · -18.6%
- By 2050
- 11,087 · -30.5%
- By 2075
- 7,338 · -54.0%
- By 2100
- 4,526 · -71.6%
Race, ethnicity, and origin ACS 2023
- Neighborhood character
- Predominantly White (96%)
- Race & ethnicity
- White 96% Two or more races 3% Hispanic / Latino 1%
- Common ancestry
- Slovak 2% Serbian 2% Italian 1%
- Foreign-born
- 1%
- Languages at home
- 98% English-only · Spanish 1% Other Indo-European 1%
Political lean MEDSL · Edgar
- 2024 margin
- Solid R (+52.4) · D 23.0% · R 75.3% · Other 1.7%
- 2008→2024 swing
- -44.4pp toward R · 2008: -7.9pp · 2024: -52.4pp
- All cycles
- 2024: R+52.4 2020: R+52.5 2016: R+49.5 2012: R+32.8 2008: R+7.9
Not yet ingested
- Civics
- —
Market trends
- HPI YoY
- ▼ -66.48%
- Current HPI
- 108.1718
- Rent YoY
- —
- Metro
- —
- State GDP YoY
- ▲ 1.59%
- F500 in state
- 60
Industry mix (Fortune 500 HQ in IL)
| Industry | F500 HQs | Revenue |
|---|---|---|
| Insurance | 4 | $201B |
|
||
| Consumer Goods | 4 | $87B |
|
||
| Industrial Machinery | 3 | $64B |
|
||
| Healthcare | 2 | $55B |
|
||
| Retail / Pharmacy | 1 | $148B |
|
||
| Agriculture / Food | 1 | $86B |
|
||
Price history
-60.0% since first listed10 events — show timeline
- 2026-06-13 Listed $20,000 MRED as Distributed by MLS Grid
- 2026-06-11 Listing Removed — MRED as Distributed by MLS Grid
- 2026-04-19 Price Changed — MRED as Distributed by MLS Grid
- 2026-03-18 Listed — MRED as Distributed by MLS Grid
- 2025-11-21 Listing Removed — MRED as Distributed by MLS Grid
- 2025-10-27 Relisted — MRED as Distributed by MLS Grid
- 2025-10-11 Listing Removed — MRED as Distributed by MLS Grid
- 2025-07-14 Listing Removed — MRED as Distributed by MLS Grid
- 2025-07-11 Listed — MRED as Distributed by MLS Grid
- 2025-04-18 Listed $50,000 CIBR
Property tax history
+1.4%/yrLatest (2024): $110 · -0.3% YoY. Source: county tax records.
Cash-flow waterfall
monthlySold comps — $/sqft
last 12 mo · ≤1 miLoading sold comps…