1263 Fir St · Granby, MO
Flood risk 1/10 · Minimal
- FEMA flood zone
- X (unshaded)
- Chance of flooding over 30 yrs
- 0.0%
- Est. flood insurance / yr
- $507 – $1,088
Fire risk 5/10 · Moderate
- Est. fire insurance / yr
- $1,054 – $1,958
Heat risk 5/10 · Moderate
- Hot days now (above 105°F)
- 7 days/yr
- Hot days in 30 yrs
- 20 days/yr
Wind risk 2/10 · Minimal
- Chance of severe wind over 30 yrs
- 3.0%
Air-quality risk 2/10 · Minimal
- Unhealthy air days now
- 1 days/yr
- Unhealthy air days in 30 yrs
- 1 days/yr
Risk factors via First Street. Map © Google.
Why this score? — see what drove the C grade
The composite is a weighted blend of 9 inputs, each scored 0–100. Each bar is that input's sub-score; the figure is the points it added to the 100-point composite (weight × sub-score).
- Cash flow +24.3/30.0
- DSCR +7.8/10.0
- ARV discount +7.5/15.0
- 1% rule +6.3/10.0
- Livability +3.0/5.0
- Schools +2.7/10.0
- Rent growth +2.5/5.0
- Condition / age +2.5/5.0
- Appreciation +0.0/10.0
$89,900
🖨 Deal sheet 📄 Offer letter ✓ Due diligence
Listing remarks MLS
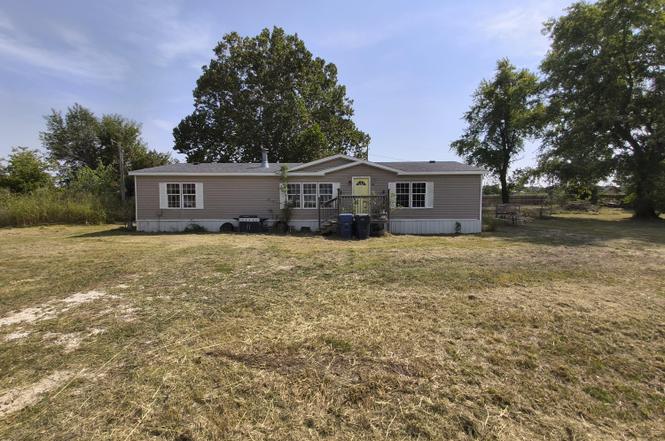
Remodeled 3 BD 2 BA Doublewide with in-ground pool on large lot in Granby! This home features spacious bedrooms, a large master bath with jetted garden tub, fireplace in living room, an open kitchen/dining area, new flooring, fresh paint throughout and new steel skirting. All this on a large lot with an in-ground pool with pool-house/storage shed and detached garage with chain link fencing for the backyard. This is a must-see!
Key facts
- Large lot
- Gunite pool
- 0.7 acre lot
Tags
Neighborhood map
What this means for you Summary
Snapshot
- This is a 3-bed/2.0-bath single-family listed at $90k.
Deal economics
- At list price, monthly cash flow is $180 ($2k/yr) — positive.
- The deal already cash-flows at list — no discount required.
- Meets the 1% rule at list price ($1k rent vs $90k).
Location & tenants
- Location reads 60/100 on livability (#462 in MO) — a middle-class / working-renter tenant base. Strengths: cost of living A+, housing A-, crime B; Watch: amenities F, commute F, employment F.
- East Newton County R-VI (rural): math 30% / reading 35% proficiency, ranked #248 of 324 in MO (top 76%) — families likely to look elsewhere, expect single-tenant / working-renter base with shorter leases.
- Zoned schools: Granby (math 26% / reading 32%, grade F, #842 of 1,115 statewide, top 76%, 587 students, 65% FRL).
- Market conditions: 41 active listings in the ZIP; 110 units permitted in Newton County in 2024 (40 in 5+ unit buildings).
Forward outlook
- Local home prices are declining (-3.0%/yr); year-one equity from $622 of loan paydown is wiped out by about $3k of value loss. Plan a longer hold.
- Newton County population projected to shrink 7% by 2050 — rents likely to lag national; underwrite the cash flow, not the appreciation.
Negotiation context
- Only 7 days on market — expect competitive offers; lowballing is unlikely to land.
- 4 sale attempts since 8y ago with the ask held roughly flat each time — persistent listings suggest the price (not the market) is what's stuck; bring a comps-based counter.
Risks & watch-outs
- Climate carrying-cost: moderate wildfire risk; extreme-heat days projected 7→20/yr by 2055 (HVAC capex compounding) — expect insurance premiums to compound above CPI over the hold.
Questions for the listing agent
- Is there a deadline driving the sale (1031 exchange, divorce, estate, relocation)? That informs how much negotiation room exists.
- Schools are D-rated, which usually means shorter tenancies and higher turnover. Who's the typical renter profile here, and what's been the actual vacancy rate?
- What's the average days-on-market for RENTAL listings here right now (not sales)? A rising rental-DOM trend means longer vacancies and softer asking-rent achievability than the comps imply.
- What's the recent tenant-quality profile in this submarket — average credit score on applications, eviction rate, late-payment / NSF rate, and stable-employment percentage? A property-management company in the area should have these aggregated.
- How much new for-sale + rental construction is in the pipeline within 1–3 miles? Heavy new supply typically softens prices + rents 12–24 months out; constrained supply supports both.
Investment metrics
- 1% rule
- 1.13% ✓
- Cap rate
- 8.70%
- Cash-on-cash
- 8.59%
- DSCR
- 1.38
- GRM
- 7.4
CMA / ARV
No comps found within radius.
Projected returns pro-forma
-3.0% appreciation · 3.0% rent growth · sell at horizon
- IRR
- -3.2%
- Equity multiple
- 0.88×
- Total profit
- $-3,070
- Equity at exit
- $13,404
- IRR
- 6.5%
- Equity multiple
- 1.48×
- Total profit
- $12,175
- Equity at exit
- $7,773
Cash invested: $25,172 (down + closing). Projections, not guarantees.
Landlord ↔ Tenant lean methodology
- Overall (STATE)
- 81 Strongly Landlord-Friendly
- State Missouri
- 81 Strongly Landlord-Friendly · R+10
- County
- — inherits STATE
- City
- — inherits STATE
ZIP-level market 64844
- Home prices YoY
- -5.1%
- Active inventory
- 41
- Price-to-rent
- 7.4×
Monthly cashflow live
- Estimated rent
- $1,015 medium interval (Pro) →
- Mortgage (P&I)
- −$471
- Tax est. 1.5%
- −$112 /mo · $1,348/yr
- Insurance
- −$37
- HOA
- −$0
- Vacancy / Maint / Mgmt
- −$213
- Net cashflow
- $180
Break-even live
UW: 25.0% down · 7.5% · 30yr · 1.5% tax · 5.0% vac · 8.0% maint · 8.0% mgmt
Financing live
Cash to close
- Down payment
- $22,475
- Closing costs
- $2,697
- Reserves months
- —
- Total cash needed
- —
Loan-product check · same deal, 3 products live
Conventional
25% down · 7.5% · 30yr
- Down + closing
- —
- Monthly P&I
- —
- Monthly cashflow
- —
- DSCR
- —
- Eligible?
- —
Personal DTI + credit; lowest rate.
DSCR
20% down · 8.5% · 30yr
- Down + closing
- —
- Monthly P&I
- —
- Monthly cashflow
- —
- DSCR
- —
- Eligible?
- —
No personal income docs; deal must DSCR.
Hard money
10% down · 12.0% · 12mo
- Down + closing
- —
- Monthly P&I
- —
- Monthly cashflow
- —
- DSCR
- —
- Eligible?
- —
Short-term bridge; refi at stabilization.
Listing history 8 events
-
2025-09-27status Pending
-
2025-09-18$89,900 Active
-
2019-06-20soldstatus 430-char remark
Show marketing remark (415 chars)
Remodeled 3 BD 2 BA Doublewide with in-ground pool on large lot in Granby! This home features spacious bedrooms, a large master bath with jetted garden tub, fireplace in living room, an open kitchen/dining area, new flooring, fresh paint throughout, and new steel skirting. All this on a large lot with an in-ground pool w/ poolhouse and detached garage with chain link fencing for the backyard. This is a must-see!
-
2019-06-20soldstatus 415-char remark
Show marketing remark (415 chars)
Remodeled 3 BD 2 BA Doublewide with in-ground pool on large lot in Granby! This home features spacious bedrooms, a large master bath with jetted garden tub, fireplace in living room, an open kitchen/dining area, new flooring, fresh paint throughout, and new steel skirting. All this on a large lot with an in-ground pool w/ poolhouse and detached garage with chain link fencing for the backyard. This is a must-see!
-
2018-12-09$74,900 415-char remark
Show marketing remark (430 chars)
Remodeled 3 BD 2 BA Doublewide with in-ground pool on large lot in Granby! This home features spacious bedrooms, a large master bath with jetted garden tub, fireplace in living room, an open kitchen/dining area, new flooring, fresh paint throughout and new steel skirting. All this on a large lot with an in-ground pool with pool-house/storage shed and detached garage with chain link fencing for the backyard. This is a must-see!
-
2018-12-09$74,900 430-char remark
Show marketing remark (430 chars)
Remodeled 3 BD 2 BA Doublewide with in-ground pool on large lot in Granby! This home features spacious bedrooms, a large master bath with jetted garden tub, fireplace in living room, an open kitchen/dining area, new flooring, fresh paint throughout and new steel skirting. All this on a large lot with an in-ground pool with pool-house/storage shed and detached garage with chain link fencing for the backyard. This is a must-see!
-
2018-08-28soldstatus
-
2018-07-24$35,500
ⓘ Source: listings_history table (triggers on properties + properties_extension) + one-shot
backfill from property_details.listing_events for pre-trigger history.
Climate risk First Street
- Flood 1/10 Low FEMA zone X (unshaded) · 0% chance over 30 yrs
- Wildfire 5/10 Major
- Heat 5/10 Major 7 d/yr ≥105°F today · 20 d/yr by 30 yrs out
- Wind 2/10 Low 3% chance of damaging wind over 30 yrs
- Air quality 2/10 Low 1 unhealthy d/yr today · 1 by 30 yrs out
Nearby sold comps map
Loading sold comps map…
Walkable amenities ~0.75 mi
Loading nearby amenities…
Taxation est. · year 1
- Rental income
- $12,176
- − Mortgage interest
- −$5,036
- − Property taxes
- −$1,348
- − Insurance
- −$450
- − Repairs & maintenance
- −$974
- − Management
- −$974
- − Depreciation
- −$2,615
- Taxable income
- $779
- Est. tax owed @ 24.0%
- −$187
- After-tax cash flow
- $1,977/yr
For passive investors: Depreciation is non-cash, so a rental often shows a tax loss while cash-flowing — sheltering income. Rental losses are passive: they offset passive income freely, and up to $25,000/yr can offset ordinary (W-2) income if you actively participate and your MAGI is under $100k (phasing out to $0 by $150k); unused losses carry forward. On sale, claimed depreciation is recaptured at up to 25%, and gains may owe capital-gains tax (a 1031 exchange can defer both). Figures are a year-1 estimate at your 24.0% rate — not tax advice; consult a CPA.
Schools (NCES district)
- District
- East Newton County R-VI
- NCES district ID
- 2930420
- Math proficiency
- 30% ▼ -2.00%
- Reading proficiency
- 35% ▼ -3.00%
- Median HH income
- $39,447
- Composite
- 27.25/100
- National rank
- #7011
- State rank
- #248 of 324 in MO
Livability — Granby
- Score
- 60/100
- State rank
- #462
- US rank
- #18519
Category grades
Schools grade is shown separately in the Schools card above.
Census & demographics
- Census place
- Granby, MO
- City population
- 4,131
- Population (ZIP)
- 4,131
Population outlook (Newton County) Hauer SSP2
- Today (2025)
- 59,151 people
- By 2030
- 58,961 · -0.3%
- By 2040
- 57,609 · -2.6%
- By 2050
- 54,775 · -7.4%
- By 2075
- 46,140 · -22.0%
- By 2100
- 34,348 · -41.9%
Race, ethnicity, and origin ACS 2023
- Neighborhood character
- Predominantly White (90%)
- Race & ethnicity
- White 90% Two or more races 6% Asian 2% Hispanic / Latino 2% Native American 1%
- Common ancestry
- Romanian 2% Iranian 1% Slovak 1%
- Foreign-born
- 1%
- Languages at home
- 98% English-only · Other Asian/Pacific 1% Spanish 1%
Political lean MEDSL · Newton
- 2024 margin
- Solid R (+58.6) · D 20.2% · R 78.8% · Other 1.0%
- 2008→2024 swing
- -18.5pp toward R · 2008: -40.1pp · 2024: -58.6pp
- All cycles
- 2024: R+58.6 2020: R+57.4 2016: R+58.7 2012: R+46.9 2008: R+40.1
Not yet ingested
- Civics
- —
Market trends
- HPI YoY
- ▼ -11.38%
- Current HPI
- 213.4988
- Rent YoY
- —
- Metro
- —
- State GDP YoY
- ▲ 1.84%
- F500 in state
- 20
Industry mix (Fortune 500 HQ in MO)
| Industry | F500 HQs | Revenue |
|---|---|---|
| Healthcare | 1 | $163B |
|
||
| Insurance | 1 | $21B |
|
||
| Industrial Technology | 1 | $17B |
|
||
| Retail | 1 | $16B |
|
||
| Industrial Distribution | 1 | $10B |
|
||
| Utilities | 1 | $9B |
|
||
Price history
+153.2% since first listed8 events — show timeline
- 2025-09-27 Pending — OGAR
- 2025-09-18 Listed $89,900 OGAR
- 2019-06-20 Sold (MLS) — SOMO
- 2019-06-20 Sold (MLS) — OGAR
- 2018-12-09 Listed $74,900 SOMO
- 2018-12-09 Listed $74,900 OGAR
- 2018-08-28 Sold (MLS) — OGAR
- 2018-07-24 Listed $35,500 OGAR
Cash-flow waterfall
monthlySold comps — $/sqft
last 12 mo · ≤1 miLoading sold comps…