58655 Penn Rd · Vandalia, MI
Flood risk 1/10 · Minimal
- FEMA flood zone
- X (unshaded)
- Chance of flooding over 30 yrs
- 0.0%
- Est. flood insurance / yr
- $473 – $860
Fire risk 1/10 · Minimal
- Est. fire insurance / yr
- $784 – $1,456
Heat risk 2/10 · Minimal
- Hot days now (above 99°F)
- 7 days/yr
- Hot days in 30 yrs
- 16 days/yr
Wind risk 2/10 · Minimal
- Chance of severe wind over 30 yrs
- —
Air-quality risk 2/10 · Minimal
- Unhealthy air days now
- 1 days/yr
- Unhealthy air days in 30 yrs
- 1 days/yr
Risk factors via First Street. Map © Google.
Why this score? — see what drove the C grade
The composite is a weighted blend of 9 inputs, each scored 0–100. Each bar is that input's sub-score; the figure is the points it added to the 100-point composite (weight × sub-score).
- Cash flow +26.0/30.0
- DSCR +8.8/10.0
- ARV discount +7.5/15.0
- 1% rule +6.3/10.0
- Livability +2.9/5.0
- Rent growth +2.5/5.0
- Condition / age +2.5/5.0
- Schools +1.9/10.0
- Appreciation +0.0/10.0
$100,000
🖨 Deal sheet 📄 Offer letter ✓ Due diligence
Listing remarks MLS
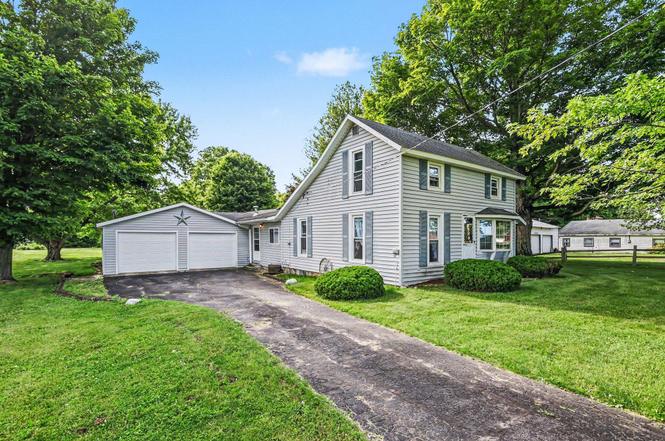
Auction Property - Taking Offers June 29, 2026 at 5:00 PM. The list price reflects the suggested opening bid only and is not the seller's asking price. Opportunity awaits in Penn Township! Situated in a beautiful park-like setting with mature shade trees, this 3-bedroom, 1-bath country home offers plenty of potential for the right buyer. The home features a 2-car attached garage, replacement windows, a covered front porch, and a spacious family room with vaulted knotty pine ceilings that opens to a delightful three-season room overlooking the backyard. Inside, you'll find a traditional farmhouse-style layout with a main-floor bedroom that includes laundry in the closet, plus two upper-level bedrooms with a walkthrough design. The front living room is highlighted by a bay window that brings in great natural light. Note: active roof leaks have resulted in water damage to ceilings throughout the home. This property is being sold in AS-IS condition and presents an excellent opportunity for investors, renovators, or buyers looking to build equity. Property Preview: Monday, June 29, 2026 beginning at 12:00 Noon. On-Site Auction begins at 5:00 PM EST. Auction Terms: $5,000 non-refundable deposit due on auction day. Balance due within 30 days. Property transfers by new deed with title insurance. Buyer responsible for closing fee, recording fees, lender-required fees (if any), and a 10% Buyer's Premium. Sold AS-IS. Announcements made day of auction supersede all printed material. Contact Penn Township regarding zoning and permitted uses. Offers are subject to acceptance. Property sold by current legal description.
Key facts
- 2 acre lot
- 2 garage spots
- Built 1908
Property features AI
Finance
- Financial info: 2025 tax year; annual tax amount reported
Exterior
- Parking: Attached 2-car garage
- Utilities: Well water
- Home design: Single-family residence; Residential property; Built in 1908
- Construction: Vinyl siding
- Exterior features: 2.0-acre lot; Well water
Interior
- Bathrooms: One full bathroom
- Heating & cooling: Forced air heating
- Interior features: Replacement windows; Seven total rooms; Partial Michigan-style basement
Neighborhood map
What this means for you Summary
Snapshot
- This is a 3-bed/1.0-bath single-family listed at $100k.
Deal economics
- At list price, monthly cash flow is $250 ($3k/yr) — positive.
- The deal already cash-flows at list — no discount required.
- Meets the 1% rule at list price ($1k rent vs $100k).
Location & tenants
- Location reads 58/100 on livability (#634 in MI) — a working-class tenant base; expect higher turnover. Strengths: cost of living A+, housing A+; Watch: schools F, crime F, amenities F.
- Cassopolis Public Schools (rural): math 14% / reading 29% proficiency, ranked #453 of 540 in MI (top 84%) — low school quality limits family demand, transient renter base, plan for 1-2y turnover.
- Market conditions: 81 active listings in the ZIP; 128 units permitted in Cass County in 2024 (0 in 5+ unit buildings).
Forward outlook
- Local home prices are declining (-3.0%/yr); year-one equity from $691 of loan paydown is wiped out by about $3k of value loss. Plan a longer hold.
- Cass County population projected at -20% by 2050 — secular population decline; favor cash flow + early exit over multi-decade hold.
Negotiation context
- Only 3 days on market — expect competitive offers; lowballing is unlikely to land.
- 3 sale attempts with the ask held roughly flat each time — persistent listings suggest the price (not the market) is what's stuck; bring a comps-based counter.
Risks & watch-outs
- Watch-outs: built in 1908 — expect roof / HVAC / electrical / plumbing capex.
Questions for the listing agent
- Built in 1908 — when were the roof, HVAC, electrical panel, plumbing, and water heater last replaced?
- Is there a deadline driving the sale (1031 exchange, divorce, estate, relocation)? That informs how much negotiation room exists.
- Schools are F-rated, which usually means shorter tenancies and higher turnover. Who's the typical renter profile here, and what's been the actual vacancy rate?
- Crime grade is F in this area — have there been break-ins, vandalism, or insurance claims at this property in the last 3 years? What carrier currently insures it and at what premium?
- What's the average days-on-market for RENTAL listings here right now (not sales)? A rising rental-DOM trend means longer vacancies and softer asking-rent achievability than the comps imply.
- What's the recent tenant-quality profile in this submarket — average credit score on applications, eviction rate, late-payment / NSF rate, and stable-employment percentage? A property-management company in the area should have these aggregated.
- How much new for-sale + rental construction is in the pipeline within 1–3 miles? Heavy new supply typically softens prices + rents 12–24 months out; constrained supply supports both.
Investment metrics
- 1% rule
- 1.13% ✓
- Cap rate
- 9.30%
- Cash-on-cash
- 10.72%
- DSCR
- 1.48
- GRM
- 7.4
CMA / ARV
No comps found within radius.
Projected returns pro-forma
-3.0% appreciation · 3.0% rent growth · sell at horizon
- IRR
- -0.3%
- Equity multiple
- 0.99×
- Total profit
- $-285
- Equity at exit
- $14,910
- IRR
- 9.4%
- Equity multiple
- 1.72×
- Total profit
- $20,210
- Equity at exit
- $8,646
Cash invested: $28,000 (down + closing). Projections, not guarantees.
Landlord ↔ Tenant lean methodology
- Overall (STATE)
- 62 Landlord-Friendly
- State Michigan
- 62 Landlord-Friendly · EVEN
- County
- — inherits STATE
- City
- — inherits STATE
ZIP-level market 49031
- Active inventory
- 81
- Price-to-rent
- 7.4×
Monthly cashflow live
- Estimated rent
- $1,126 medium interval (Pro) →
- Mortgage (P&I)
- −$524
- Tax from tax record
- −$73 /mo · $880/yr
- Insurance
- −$42
- HOA
- −$0
- Vacancy / Maint / Mgmt
- −$236
- Net cashflow
- $250
Break-even live
UW: 25.0% down · 7.5% · 30yr · 1.5% tax · 5.0% vac · 8.0% maint · 8.0% mgmt
Financing live
Cash to close
- Down payment
- $25,000
- Closing costs
- $3,000
- Reserves months
- —
- Total cash needed
- —
Loan-product check · same deal, 3 products live
Conventional
25% down · 7.5% · 30yr
- Down + closing
- —
- Monthly P&I
- —
- Monthly cashflow
- —
- DSCR
- —
- Eligible?
- —
Personal DTI + credit; lowest rate.
DSCR
20% down · 8.5% · 30yr
- Down + closing
- —
- Monthly P&I
- —
- Monthly cashflow
- —
- DSCR
- —
- Eligible?
- —
No personal income docs; deal must DSCR.
Hard money
10% down · 12.0% · 12mo
- Down + closing
- —
- Monthly P&I
- —
- Monthly cashflow
- —
- DSCR
- —
- Eligible?
- —
Short-term bridge; refi at stabilization.
Listing history 4 events
-
2026-06-19days on market $100,000 Active 3 DOM
-
2026-06-18days on market $100,000 Active 2 DOM
-
2026-06-17remarks 699-char remark
-
2026-06-17$100,000 Active 1 DOM
ⓘ Source: listings_history table (triggers on properties + properties_extension) + one-shot
backfill from property_details.listing_events for pre-trigger history.
Tax reassessment forecast MI · Partial reset (capped growth)
- Current annual tax
- $880 · $73/mo
- Projected year-2 tax
- $1,210 · $101/mo
- Expected delta
- +$330/yr (+$27/mo · 37.5%)
ⓘ Screening estimate from a state-policy table — verify with the county assessor before closing.
Climate risk First Street
- Flood 1/10 Low FEMA zone X (unshaded) · 0% chance over 30 yrs
- Wildfire 1/10 Low
- Heat 2/10 Low 7 d/yr ≥99°F today · 16 d/yr by 30 yrs out
- Wind 2/10 Low
- Air quality 2/10 Low 1 unhealthy d/yr today · 1 by 30 yrs out
Nearby sold comps map
Loading sold comps map…
Walkable amenities ~0.75 mi
Loading nearby amenities…
Taxation est. · year 1
- Rental income
- $13,513
- − Mortgage interest
- −$5,602
- − Property taxes
- −$880
- − Insurance
- −$500
- − Repairs & maintenance
- −$1,081
- − Management
- −$1,081
- − Depreciation
- −$2,909
- Taxable income
- $1,460
- Est. tax owed @ 24.0%
- −$350
- After-tax cash flow
- $2,652/yr
For passive investors: Depreciation is non-cash, so a rental often shows a tax loss while cash-flowing — sheltering income. Rental losses are passive: they offset passive income freely, and up to $25,000/yr can offset ordinary (W-2) income if you actively participate and your MAGI is under $100k (phasing out to $0 by $150k); unused losses carry forward. On sale, claimed depreciation is recaptured at up to 25%, and gains may owe capital-gains tax (a 1031 exchange can defer both). Figures are a year-1 estimate at your 24.0% rate — not tax advice; consult a CPA.
Schools (NCES district)
- District
- Cassopolis Public Schools
- NCES district ID
- 2608430
- Math proficiency
- 14% ▼ -6.00%
- Reading proficiency
- 29% ▼ -1.00%
- Median HH income
- $44,696
- Composite
- 18.59/100
- National rank
- #8906
- State rank
- #453 of 540 in MI
Livability — Vandalia
- Score
- 58/100
- State rank
- #634
- US rank
- #21374
Category grades
Schools grade is shown separately in the Schools card above.
Census & demographics
- Population (ZIP)
- 8,320
Population outlook (Cass County) Hauer SSP2
- Today (2025)
- 49,919 people
- By 2030
- 48,320 · -3.2%
- By 2040
- 44,230 · -11.4%
- By 2050
- 39,852 · -20.2%
- By 2075
- 31,440 · -37.0%
- By 2100
- 23,914 · -52.1%
Race, ethnicity, and origin ACS 2023
- Neighborhood character
- Predominantly White (72%)
- Race & ethnicity
- White 72% Black 11% Two or more races 10% Hispanic / Latino 5% Asian 2%
- Common ancestry
- Lithuanian 4% Italian 4% Romanian 3%
- Foreign-born
- 5% · Canada, China
- Languages at home
- 96% English-only · Spanish 1% German/W. Germanic 1% Chinese 1%
Political lean MEDSL · Cass
- 2024 margin
- Solid R (+33.9) · D 32.5% · R 66.4% · Other 1.1%
- 2008→2024 swing
- -38.0pp toward R · 2008: 4.1pp · 2024: -33.9pp
- All cycles
- 2024: R+33.9 2020: R+28.9 2016: R+29.9 2012: R+13.7 2008: D+4.1
Not yet ingested
- Civics
- —
Market trends
- HPI YoY
- ▼ -277.15%
- Current HPI
- 163.1792
- Rent YoY
- —
- Metro
- —
- State GDP YoY
- ▲ 1.37%
- F500 in state
- 28
Industry mix (Fortune 500 HQ in MI)
| Industry | F500 HQs | Revenue |
|---|---|---|
| Automotive Parts | 3 | $48B |
|
||
| Automotive | 2 | $372B |
|
||
| Chemicals | 1 | $45B |
|
||
| Automotive Retail | 1 | $29B |
|
||
| Healthcare / Medical Devices | 1 | $23B |
|
||
| Automotive Technology | 1 | $20B |
|
||
Price history
+0.0% since first listed3 events — show timeline
- 2026-06-16 Listed $100,000 REALCOMP
- 2026-06-16 Listed $100,000 MiRealSource-MiMLS
- 2026-06-16 Listed $100,000 SW Michigan MLS
Property tax history
-2.8%/yrLatest (2025): $880 · +1.9% YoY. Source: county tax records.
Cash-flow waterfall
monthlySold comps — $/sqft
last 12 mo · ≤1 miLoading sold comps…