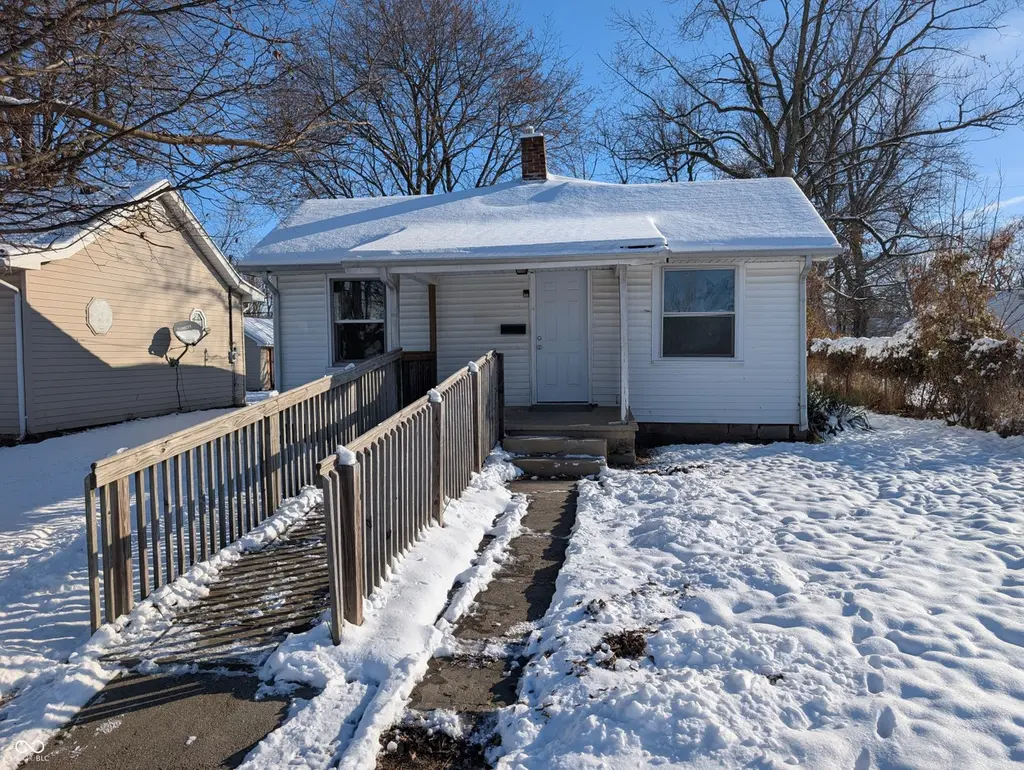
1410 Walton St · Anderson, IN
Flood risk 1/10 · Minimal
- FEMA flood zone
- X (unshaded)
- Chance of flooding over 30 yrs
- 0.0%
- Est. flood insurance / yr
- $507 – $1,088
Fire risk 1/10 · Minimal
- Est. fire insurance / yr
- $717 – $1,331
Heat risk 3/10 · Minor
- Hot days now (above 100°F)
- 7 days/yr
- Hot days in 30 yrs
- 18 days/yr
Wind risk 2/10 · Minimal
- Chance of severe wind over 30 yrs
- 0.0%
Air-quality risk 3/10 · Minor
- Unhealthy air days now
- 2 days/yr
- Unhealthy air days in 30 yrs
- 3 days/yr
Risk factors via First Street. Map © Google.
Why this score? — see what drove the B+ grade
The composite is a weighted blend of 9 inputs, each scored 0–100. Each bar is that input's sub-score; the figure is the points it added to the 100-point composite (weight × sub-score).
- Cash flow +30.0/30.0
- ARV discount +15.0/15.0
- 1% rule +10.0/10.0
- DSCR +10.0/10.0
- Rent growth +4.5/5.0
- Livability +3.0/5.0
- Condition / age +2.5/5.0
- Schools +1.6/10.0
- Appreciation +0.0/10.0
$38,900
🖨 Deal sheet 📄 Offer letter ✓ Due diligence
Listing remarks MLS
Investor Alert! Don't miss this single-family home located near downtown Anderson. This property is a fixer and needs to be renovated and brought back to life so it can truly shine. This cute little bungalow sits on a good-sized lot and has 2 bedrooms, 1 bathroom, and nearly 800 sq ft of finished living space. Excellent location within a mile of downtown Anderson, the property benefits from convenient access to local amenities and public transportation, further enhancing rental demand. If you're looking to expand your portfolio with a cash-flowing rental via the BRRRR strategy, or a fix and flip, this property provides a golden chance to invest in a rapidly improving area. Capitalize on this opportunity and grow your real estate portfolio today! Property sold as-is. Cash or hard/private money only due to condition.
Key facts
- Good-sized lot
- Convenient access
- Local amenities
Tags
Neighborhood map
What this means for you Summary
Snapshot
- This is a 2-bed/1.0-bath single-family listed at $39k.
Deal economics
- At list price, monthly cash flow is $464 ($6k/yr) — positive.
- The deal already cash-flows at list — no discount required.
- Meets the 1% rule at list price ($952 rent vs $39k).
- Recommended offer: $34k (12.0% below list) — sets the bar for market timing.
- Cap rate 20.6% vs local median 6.5% in Anderson — top-decile yield for the area; either an underpriced asset or a hidden risk that comps aren't pricing in. Stress-test before assuming the spread holds.
Location & tenants
- Location reads 60/100 on livability (#521 in IN) — a middle-class / working-renter tenant base. Strengths: cost of living A+, housing A+; Watch: schools F, crime D-, amenities F.
- Anderson Community School Corporation (urban): math 15% / reading 23% proficiency, ranked #280 of 301 in IN (top 93%) — low school quality limits family demand, transient renter base, plan for 1-2y turnover; 70% free/reduced lunch — lower-income household profile, screen leases tightly.
- Market conditions: Rents rising fast (+7.9%/yr); 185 active listings in the ZIP; 40 comparable units currently listed for rent nearby; rentals at typical pace (median 24d on market — plan ~3-4 weeks tenant-placement turnaround); 48% of comp listings sitting > 30 days — soft ceiling on asking rent; lower-income renter base — watch delinquency; 184 units permitted in Madison County in 2024 (0 in 5+ unit buildings).
- This rent runs 32% of the median local income ($36k/yr) — at the standard rent-burdened threshold; future hikes will face affordability resistance.
Forward outlook
- Local home prices are declining (-3.0%/yr); year-one equity from $269 of loan paydown is wiped out by about $1k of value loss. Plan a longer hold.
- Madison County population projected at -14% by 2050 — secular population decline; favor cash flow + early exit over multi-decade hold.
- At projected returns (-3.0% appreciation + 7.9% rent growth), your $11k cash investment doubles in ~3 years — after that, you're playing with house money.
Negotiation context
- It's been on market 158 days — a 12% lower offer ($34k) is reasonable based on typical stale-listing flexibility.
- 4 sale attempts since 20y ago with the ask held roughly flat each time — persistent listings suggest the price (not the market) is what's stuck; bring a comps-based counter.
- Current owner paid $32k; 22% above their basis — modest negotiation headroom, anchor on the comps not their cost.
Risks & watch-outs
- Watch-outs: built in 1929 — expect roof / HVAC / electrical / plumbing capex.
Questions for the listing agent
- It's been on market 158 days. Have you received any prior offers? Is the seller open to a 12% concession, seller financing, or rate buy-down credit?
- Built in 1929 — when were the roof, HVAC, electrical panel, plumbing, and water heater last replaced?
- Why hasn't it sold? Are there any deal-killer items the seller is aware of (foundation, flood, title, zoning, code violations)?
- Is there a deadline driving the sale (1031 exchange, divorce, estate, relocation)? That informs how much negotiation room exists.
- Schools are F-rated, which usually means shorter tenancies and higher turnover. Who's the typical renter profile here, and what's been the actual vacancy rate?
- Crime grade is D in this area — have there been break-ins, vandalism, or insurance claims at this property in the last 3 years? What carrier currently insures it and at what premium?
- What's the average days-on-market for RENTAL listings here right now (not sales)? A rising rental-DOM trend means longer vacancies and softer asking-rent achievability than the comps imply.
- What's the recent tenant-quality profile in this submarket — average credit score on applications, eviction rate, late-payment / NSF rate, and stable-employment percentage? A property-management company in the area should have these aggregated.
- How much new for-sale + rental construction is in the pipeline within 1–3 miles? Heavy new supply typically softens prices + rents 12–24 months out; constrained supply supports both.
Investment metrics
- 1% rule
- 2.45% ✓
- Cap rate
- 20.62%
- Cash-on-cash
- 51.15%
- DSCR
- 3.28
- GRM
- 3.4
CMA / ARV
- ARV (median comp)
- $65,750
- List price
- $38,900
- Delta
- -40.84%
- Verdict
- UNDERPRICED
- Comps
- 20 within 1.0 mi
Show comp detail 12 sales within ~0.75 mi
| Address | Dist | Beds/Ba | Sqft | Sold | Price | $/sf | Match |
|---|---|---|---|---|---|---|---|
| 2308 W 16th St | 0.12mi | 2/1.0 | 756 (-4%) | 3mo | $91,500 | $121 | 86 |
| 1516 Fulton St | 0.09mi | 2/1.0 | 720 (-8%) | 3mo | $63,500 | $88 | 80 |
| 1402 Walton St | 0.03mi | 2/1.0 | 820 (+5%) | 16mo | $40,000 | $49 | 78 |
| 1423 Halford St | 0.10mi | 3/1.0 (+1) | 864 (+10%) | 2mo | $68,000 | $79 | 72 |
| 1812 Halford St | 0.29mi | 2/1.0 | 720 (-8%) | 3mo | $50,000 | $69 | 70 |
| 2241 Nelle St | 0.60mi | 2/1.0 | 796 (+2%) | 4mo | $66,500 | $84 | 66 |
| 1632 W 17th St | 0.38mi | 2/1.0 | 840 (+7%) | 12mo | $38,000 | $45 | 60 |
| 1827 Fulton St | 0.30mi | 2/1.0 | 668 (-15%) | 4mo | $94,900 | $142 | 58 |
| 2310 Halford St | 0.64mi | 2/2.0 | 744 (-5%) | 2mo | $150,000 | $202 | 56 |
| 1640 W 7th St | 0.63mi | 2/1.0 | 810 (+3%) | 12mo | $98,500 | $122 | 56 |
| 1902 Dewey St | 0.32mi | 2/1.0 | 672 (-14%) | 23mo | $77,500 | $115 | 42 |
| 2610 W 18th St | 0.40mi | 3/1.0 (+1) | 900 (+15%) | 13mo | $119,000 | $132 | 40 |
Match score weights: distance 35% · size 25% · config 20% · recency 20%. Top-matched comps best support the ARV.
Projected returns pro-forma
-3.0% appreciation · 7.88% rent growth · sell at horizon
- IRR
- 54.6%
- Equity multiple
- 3.59×
- Total profit
- $28,200
- Equity at exit
- $5,800
- IRR
- 61.6%
- Equity multiple
- 8.80×
- Total profit
- $85,008
- Equity at exit
- $3,363
Cash invested: $10,892 (down + closing). Projections, not guarantees.
Landlord ↔ Tenant lean methodology
- Overall (STATE)
- 90 Strongly Landlord-Friendly
- State Indiana
- 90 Strongly Landlord-Friendly · R+11
- County
- — inherits STATE
- City
- — inherits STATE
ZIP-level market 46016
- Home prices YoY
- -3.5%
- Rents YoY
- 7.9%
- Active inventory
- 185
- Price-to-rent
- 3.4×
Monthly cashflow live
- Estimated rent
- $952 high interval (Pro) →
- Mortgage (P&I)
- −$204
- Tax from tax record
- −$68 /mo · $811/yr
- Insurance
- −$16
- HOA
- −$0
- Vacancy / Maint / Mgmt
- −$200
- Net cashflow
- $464
Break-even live
UW: 25.0% down · 7.5% · 30yr · 1.5% tax · 5.0% vac · 8.0% maint · 8.0% mgmt
Financing live
Cash to close
- Down payment
- $9,725
- Closing costs
- $1,167
- Reserves months
- —
- Total cash needed
- —
Loan-product check · same deal, 3 products live
Conventional
25% down · 7.5% · 30yr
- Down + closing
- —
- Monthly P&I
- —
- Monthly cashflow
- —
- DSCR
- —
- Eligible?
- —
Personal DTI + credit; lowest rate.
DSCR
20% down · 8.5% · 30yr
- Down + closing
- —
- Monthly P&I
- —
- Monthly cashflow
- —
- DSCR
- —
- Eligible?
- —
No personal income docs; deal must DSCR.
Hard money
10% down · 12.0% · 12mo
- Down + closing
- —
- Monthly P&I
- —
- Monthly cashflow
- —
- DSCR
- —
- Eligible?
- —
Short-term bridge; refi at stabilization.
Rent comps 40 comps
| Address | Beds | Baths | Sqft | Rent | $/sqft | DOM | Units | Dist |
|---|---|---|---|---|---|---|---|---|
| 1404 Walton St Anderson, IN | 3.0 | 1.0 | 1090 | $995 | $0.91 | 43d | 1 | 0.05mi |
| 1136 Irving Way Anderson, IN | 2.0 | 1.0 | 900 | $895 | $0.99 | 21d | 1 | 0.26mi |
| 1123 Louise St Anderson, IN | 2.0 | 1.0 | 850 | $850 | $1.00 | 43d | 1 | 0.29mi |
| 1720 Nelle St Anderson, IN | 2.0 | 1.0 | 768 | $1,100 | $1.43 | 23d | 1 | 0.30mi |
| 1640 W 17th St Anderson, IN | 2.0 | 1.0 | 810 | $895 | $1.10 | 20d | 1 | 0.36mi |
| 1616 W 16th St Anderson, IN | 2.0 | 1.0 | 1038 | $1,050 | $1.01 | 43d | 1 | 0.39mi |
| 1614 W 18th St Anderson, IN | 2.0 | 1.0 | 690 | $975 | $1.41 | 23d | 1 | 0.43mi |
| 2004 Arrow Ave Anderson, IN | 2.0 | 1.0 | 816 | $1,125 | $1.38 | 23d | 1 | 0.46mi |
| 2705 Horton Dr Anderson, IN | 3.0 | 1.0 | 936 | $1,050 | $1.12 | 20d | 1 | 0.47mi |
| 1708 W 7th St Anderson, IN | 1.0 | 1.0 | 700 | $875 | $1.25 | 17d | 1 | 0.63mi |
| 1708 W 7th St Anderson, IN | 1.0 | 1.0 | 700 | $875 | $1.25 | 19d | 1 | 0.63mi |
| 1708 W 7th St Anderson, IN | 1.0 | 1.0 | 700 | $1,000 | $1.43 | 43d | 1 | 0.63mi |
| 1631 W 7th St Anderson, IN | 3.0 | 1.0 | 900 | $1,000 | $1.11 | 43d | 1 | 0.64mi |
| 1222 Nichol Ave Unit 4 Anderson, IN | 3.0 | 1.0 | 1000 | $1,135 | $1.14 | 7d | 1 | 0.67mi |
| 1627 W 6th St Anderson, IN | 2.0 | 1.0 | 650 | $850 | $1.31 | 23d | 1 | 0.70mi |
| 1502 Cedar St Anderson, IN | 2.0 | 1.0 | 1104 | $850 | $0.77 | 43d | 1 | 0.75mi |
| 1312 W 8th St Unit 1308H Anderson, IN | 1.0 | 1.0 | 750 | $999 | $1.33 | 14d | 1 | 0.82mi |
| 1312 W 8th St Unit 1332 F Anderson, IN | 2.0 | 1.0 | 850 | $979 | $1.15 | 43d | 1 | 0.82mi |
| 1708 Euclid Dr Anderson, IN | 2.0 | 1.0 | 732 | $1,225 | $1.67 | 43d | 1 | 0.82mi |
| 2613 Louise St Anderson, IN | 2.0 | 1.0 | 1096 | $950 | $0.87 | 21d | 1 | 0.83mi |
| 2719 Dewey St Anderson, IN | 2.0 | 1.0 | 877 | $1,150 | $1.31 | 43d | 1 | 0.88mi |
| 2203 W 28th St Anderson, IN | 3.0 | 1.0 | 1068 | $1,000 | $0.94 | 43d | 1 | 0.91mi |
| 1529 W 2nd St Anderson, IN | 3.0 | 1.0 | 884 | $1,200 | $1.36 | 23d | 1 | 0.96mi |
| 2208 Hendricks St Unit 3 Anderson, IN | 1.0 | 1.0 | 585 | $675 | $1.15 | 43d | 1 | 0.99mi |
| 1020 W 5th St Unit 1022 Anderson, IN | 1.0 | 1.0 | 550 | $750 | $1.36 | 43d | 1 | 1.02mi |
| 2411 Hendricks St Anderson, IN | 3.0 | 1.0 | 860 | $1,000 | $1.16 | 23d | 1 | 1.05mi |
| 803 1/2 W 9th St Anderson, IN | 1.0 | 1.0 | 600 | $525 | $0.88 | 43d | 1 | 1.05mi |
| 925 W 5th St Unit 1 Anderson, IN | 1.0 | 1.0 | 617 | $775 | $1.26 | 16d | 1 | 1.06mi |
| 924 W 5th St Unit 924 Anderson, IN | 1.0 | 1.0 | 750 | $600 | $0.80 | 23d | 1 | 1.08mi |
| 924 W 5th St Unit 928 Anderson, IN | 1.0 | 1.0 | 600 | $600 | $1.00 | 43d | 1 | 1.08mi |
| 702 W 23rd St Anderson, IN | 1.0 | 1.0 | 560 | $595 | $1.06 | 4d | 1 | 1.09mi |
| 618 W 22nd St Anderson, IN | 3.0 | 1.0 | 900 | $1,250 | $1.39 | 43d | 1 | 1.10mi |
| 2301 Sheridan St Anderson, IN | 2.0 | 1.0 | 900 | $950 | $1.06 | 43d | 1 | 1.10mi |
| 215 S Madison Ave Anderson, IN | 1.0 | 1.0 | 600 | $650 | $1.08 | 43d | 1 | 1.16mi |
| 213 Madison Ave Anderson, IN | 1.0 | 1.0 | 600 | $650 | $1.08 | 43d | 1 | 1.17mi |
| 1010 W 2nd St Unit 2 Anderson, IN | 2.0 | 1.0 | 875 | $1,025 | $1.17 | 21d | 1 | 1.18mi |
| 1010 W 2nd St Unit 1 Anderson, IN | 1.0 | 1.0 | 724 | $925 | $1.28 | 23d | 1 | 1.18mi |
| 1010 W 2nd St Unit 3 Anderson, IN | 3.0 | 1.0 | 1025 | $1,125 | $1.10 | 14d | 1 | 1.18mi |
| 2442 Morton St Anderson, IN | 2.0 | 1.0 | 862 | $1,125 | $1.31 | 23d | 1 | 1.30mi |
| 2324 Chase St Anderson, IN | 2.0 | 1.0 | 783 | $950 | $1.21 | 43d | 1 | 1.37mi |
Listing history 22 events
-
2026-06-18days on market $38,900 Active 158 DOM
-
2026-06-17days on market $38,900 Active 157 DOM
-
2026-06-16days on market $38,900 Active 156 DOM
-
2026-06-15days on market $38,900 Active 155 DOM
-
2026-06-13days on market $38,900 Active 153 DOM
-
2026-06-09days on market $38,900 Active 149 DOM
-
2026-06-08days on market $38,900 Active 148 DOM
-
2026-06-07days on market $38,900 Active 147 DOM
-
2026-06-05days on market $38,900 Active 144 DOM
-
2026-06-03days on market $38,900 Active 143 DOM
-
2026-06-02days on market $38,900 Active 142 DOM
-
2026-06-01days on market $38,900 Active 141 DOM
-
2026-05-31days on market $38,900 Active 140 DOM
-
2026-04-30price $38,900 826-char remark
Show marketing remark (826 chars)
Investor Alert! Don't miss this single-family home located near downtown Anderson. This property is a fixer and needs to be renovated and brought back to life so it can truly shine. This cute little bungalow sits on a good-sized lot and has 2 bedrooms, 1 bathroom, and nearly 800 sq ft of finished living space. Excellent location within a mile of downtown Anderson, the property benefits from convenient access to local amenities and public transportation, further enhancing rental demand. If you're looking to expand your portfolio with a cash-flowing rental via the BRRRR strategy, or a fix and flip, this property provides a golden chance to invest in a rapidly improving area. Capitalize on this opportunity and grow your real estate portfolio today! Property sold as-is. Cash or hard/private money only due to condition.
-
2026-03-30status Active 826-char remark
Show marketing remark (826 chars)
Investor Alert! Don't miss this single-family home located near downtown Anderson. This property is a fixer and needs to be renovated and brought back to life so it can truly shine. This cute little bungalow sits on a good-sized lot and has 2 bedrooms, 1 bathroom, and nearly 800 sq ft of finished living space. Excellent location within a mile of downtown Anderson, the property benefits from convenient access to local amenities and public transportation, further enhancing rental demand. If you're looking to expand your portfolio with a cash-flowing rental via the BRRRR strategy, or a fix and flip, this property provides a golden chance to invest in a rapidly improving area. Capitalize on this opportunity and grow your real estate portfolio today! Property sold as-is. Cash or hard/private money only due to condition.
-
2026-02-24status Pending 826-char remark
Show marketing remark (826 chars)
Investor Alert! Don't miss this single-family home located near downtown Anderson. This property is a fixer and needs to be renovated and brought back to life so it can truly shine. This cute little bungalow sits on a good-sized lot and has 2 bedrooms, 1 bathroom, and nearly 800 sq ft of finished living space. Excellent location within a mile of downtown Anderson, the property benefits from convenient access to local amenities and public transportation, further enhancing rental demand. If you're looking to expand your portfolio with a cash-flowing rental via the BRRRR strategy, or a fix and flip, this property provides a golden chance to invest in a rapidly improving area. Capitalize on this opportunity and grow your real estate portfolio today! Property sold as-is. Cash or hard/private money only due to condition.
-
2025-12-08$40,000 Active 826-char remark
Show marketing remark (826 chars)
Investor Alert! Don't miss this single-family home located near downtown Anderson. This property is a fixer and needs to be renovated and brought back to life so it can truly shine. This cute little bungalow sits on a good-sized lot and has 2 bedrooms, 1 bathroom, and nearly 800 sq ft of finished living space. Excellent location within a mile of downtown Anderson, the property benefits from convenient access to local amenities and public transportation, further enhancing rental demand. If you're looking to expand your portfolio with a cash-flowing rental via the BRRRR strategy, or a fix and flip, this property provides a golden chance to invest in a rapidly improving area. Capitalize on this opportunity and grow your real estate portfolio today! Property sold as-is. Cash or hard/private money only due to condition.
-
2022-09-21historical
-
2022-08-24price $44,000
-
2022-03-21$45,000 Active
-
2007-11-11soldstatus $32,000
-
2006-02-21$42,000
ⓘ Source: listings_history table (triggers on properties + properties_extension) + one-shot
backfill from property_details.listing_events for pre-trigger history.
Tax reassessment forecast IN · Partial reset (capped growth)
- Current annual tax
- $811 · $68/mo
- Projected year-2 tax
- $811 · $68/mo
- Expected delta
- $0/yr ($0/mo · 0.0%)
ⓘ Screening estimate from a state-policy table — verify with the county assessor before closing.
Climate risk First Street
- Flood 1/10 Low FEMA zone X (unshaded) · 0% chance over 30 yrs
- Wildfire 1/10 Low
- Heat 3/10 Moderate 7 d/yr ≥100°F today · 18 d/yr by 30 yrs out
- Wind 2/10 Low 0% chance of damaging wind over 30 yrs
- Air quality 3/10 Moderate 2 unhealthy d/yr today · 3 by 30 yrs out
Nearby sold comps map
Loading sold comps map…
Walkable amenities ~0.75 mi
Loading nearby amenities…
Taxation est. · year 1
- Rental income
- $11,424
- − Mortgage interest
- −$2,179
- − Property taxes
- −$811
- − Insurance
- −$194
- − Repairs & maintenance
- −$914
- − Management
- −$914
- − Depreciation
- −$1,132
- Taxable income
- $5,280
- Est. tax owed @ 24.0%
- −$1,267
- After-tax cash flow
- $4,304/yr
For passive investors: Depreciation is non-cash, so a rental often shows a tax loss while cash-flowing — sheltering income. Rental losses are passive: they offset passive income freely, and up to $25,000/yr can offset ordinary (W-2) income if you actively participate and your MAGI is under $100k (phasing out to $0 by $150k); unused losses carry forward. On sale, claimed depreciation is recaptured at up to 25%, and gains may owe capital-gains tax (a 1031 exchange can defer both). Figures are a year-1 estimate at your 24.0% rate — not tax advice; consult a CPA.
Schools (NCES district)
- District
- Anderson Community School Corporation
- NCES district ID
- 1800150
- Math proficiency
- 15% ▼ -14.00%
- Reading proficiency
- 23% ▼ -7.00%
- Median HH income
- $38,208
- Composite
- 15.93/100
- National rank
- #9250
- State rank
- #280 of 301 in IN
Livability — Anderson
- Score
- 60/100
- State rank
- #521
- US rank
- #18709
Category grades
Schools grade is shown separately in the Schools card above.
Census & demographics
- Census place
- Anderson, IN
- County
- Madison County · 69,445 people
- City population
- 57,762
- Metro
- Indianapolis-Carmel-Anderson, IN
- Population (ZIP)
- 17,834
- Household income
- $36,029
- Rent vs Own
- Severe rent burden
- 1193.0
Population outlook (Madison County) Hauer SSP2
- Today (2025)
- 125,800 people
- By 2030
- 122,640 · -2.5%
- By 2040
- 115,420 · -8.3%
- By 2050
- 108,148 · -14.0%
- By 2075
- 91,838 · -27.0%
- By 2100
- 75,670 · -39.8%
Race, ethnicity, and origin ACS 2023
- Neighborhood character
- Diverse neighborhood (Simpson 0.58)
- Race & ethnicity
- White 61% Black 18% Hispanic / Latino 13% Two or more races 11% Native American 1%
- Hispanic origin (detail)
- Mexican 10% Puerto Rican 1%
- Common ancestry
- Italian 2% Slovak 1% Iranian 1%
- Foreign-born
- 4% · Canada
- Languages at home
- 86% English-only · Spanish 12%
Political lean MEDSL · Madison
- 2024 margin
- Strong R (+26.9) · D 35.6% · R 62.5% · Other 1.9%
- 2008→2024 swing
- -33.5pp toward R · 2008: 6.5pp · 2024: -26.9pp
- All cycles
- 2024: R+26.9 2020: R+22.6 2016: R+25.7 2012: R+4.5 2008: D+6.5
Not yet ingested
- Civics
- —
Market trends
- HPI YoY
- ▼ -11.12%
- Current HPI
- 302.7437
- Rent YoY
- ▲ 7.88%
- Metro
- Indianapolis-Carmel-Anderson, IN
- State GDP YoY
- ▲ 2.90%
- F500 in state
- 18
Industry mix (Fortune 500 HQ in IN)
| Industry | F500 HQs | Revenue |
|---|---|---|
| Industrial Machinery | 2 | $37B |
|
||
| Healthcare | 1 | $177B |
|
||
| Pharmaceuticals | 1 | $45B |
|
||
| Metals / Steel | 1 | $18B |
|
||
| Agriculture | 1 | $17B |
|
||
| Packaging | 1 | $12B |
|
||
Price history
-7.4% since first listed9 events — show timeline
- 2026-04-30 Price Changed $38,900 MIBOR as Distributed by MLS Grid
- 2026-03-30 Relisted — MIBOR as Distributed by MLS Grid
- 2026-02-24 Pending — MIBOR as Distributed by MLS Grid
- 2025-12-08 Listed $40,000 MIBOR as Distributed by MLS Grid
- 2022-09-21 Listing Removed — MIBOR as Distributed by MLS Grid
- 2022-08-24 Price Changed $44,000 MIBOR as Distributed by MLS Grid
- 2022-03-21 Listed $45,000 MIBOR as Distributed by MLS Grid
- 2007-11-11 Sold (MLS) $32,000 MIBOR as Distributed by MLS Grid
- 2006-02-21 Listed $42,000 MIBOR as Distributed by MLS Grid
Property tax history
+9.4%/yrLatest (2024): $811 · +8.9% YoY. Source: county tax records.
Cash-flow waterfall
monthlySold comps — $/sqft
last 12 mo · ≤1 miLoading sold comps…