 11-Plex
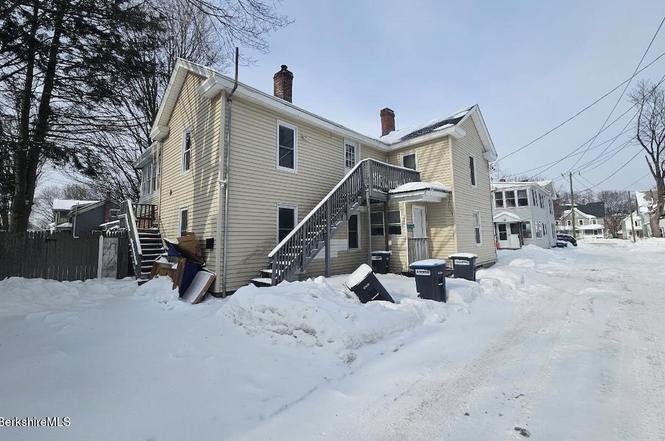
27-31 Pleasant St · Pittsfield, MA
Flood risk 1/10 · Minimal
- FEMA flood zone
- X
- Chance of flooding over 30 yrs
- 0.0%
- Est. flood insurance / yr
- $473 – $860
Fire risk 1/10 · Minimal
- Est. fire insurance / yr
- $915 – $1,699
Heat risk 2/10 · Minimal
- Hot days now (above 92°F)
- 7 days/yr
- Hot days in 30 yrs
- 16 days/yr
Wind risk 4/10 · Minor
- Chance of severe wind over 30 yrs
- 9.0%
Air-quality risk 2/10 · Minimal
- Unhealthy air days now
- 1 days/yr
- Unhealthy air days in 30 yrs
- 1 days/yr
Risk factors via First Street. Map © Google.
Why this score? — see what drove the D- grade
The composite is a weighted blend of 9 inputs, each scored 0–100. Each bar is that input's sub-score; the figure is the points it added to the 100-point composite (weight × sub-score).
- Cash flow +15.0/30.0
- 1% rule +5.0/10.0
- DSCR +5.0/10.0
- Rent growth +4.4/5.0
- Livability +3.8/5.0
- Condition / age +2.5/5.0
- Schools +2.3/10.0
- ARV discount +1.1/15.0
- Appreciation +0.0/10.0
$300,000
🖨 Deal sheet 📄 Offer letter ✓ Due diligence
Multi-family units
County records classify this as Multi-Family (2-4 Unit). Listing-text estimate: 11 units. estimate disagrees with records
Listing remarks MLS
Take advantage of this vacant and turnkey 3 family property. Perfect for an owner occupied ready to produce exceptional rental income with current market rents. This property offers off street parking, separate utilities. The apartments breakdown are one with 3 beds 1 bath, the second unit with 2 beds 1 bath and there is the studio unit as well.
Key facts
- 4,791 sq ft lot
- Built 1880
- Listed 39 days
Neighborhood map
What this means for you Summary
Snapshot
- This is a 11 × 1-bed/?-bath units multifamily listed at $300k.
Deal economics
- At list price, monthly cash flow is $10k ($122k/yr) — positive. Per door: $921/mo.
- The deal already cash-flows at list — no discount required.
- Meets the 1% rule at list price ($15k rent vs $300k).
- Recommended offer: $291k (3.0% below list) — sets the bar for market timing.
- Cap rate 46.8% vs local median 3.6% in Pittsfield — top-decile yield for the area; either an underpriced asset or a hidden risk that comps aren't pricing in. Stress-test before assuming the spread holds.
Location & tenants
- Location reads 75/100 on livability (#70 in MA, #3,820 nationally) — a middle-class / working-renter tenant base. Strengths: commute A+, housing A+, health & safety A+; Watch: employment C-, amenities D+, crime D.
- Pittsfield (urban): math 19% / reading 34% proficiency, ranked #272 of 302 in MA (top 90%) — low school quality limits family demand, transient renter base, plan for 1-2y turnover.
- Zoned schools: Morningside Community School (math 8% / reading 22%, grade F, #854 of 938 statewide, top 93%, 355 students, 0% FRL); John T Reid Middle (math 7% / reading 17%, grade F, #283 of 305 statewide, top 93%, 450 students, 0% FRL); Pittsfield High (math 32% / reading 57%, grade F, #203 of 343 statewide, top 60%, 651 students, 0% FRL) — zoned schools average 0% FRL vs 50% district-wide (50 pts lower); this property's tenant base skews higher-income than the district average.
- Market conditions: Rents rising fast (+7.7%/yr); 275 active listings in the ZIP; 2 comparable units currently listed for rent nearby; 130 units permitted in Berkshire County in 2024 (10 in 5+ unit buildings).
- At $15,249/mo this rent would consume 257% of the median local household income ($71k/yr) (locally 1580% of renters already pay >50% of income on rent) — very limited rent-growth headroom before tenants either downsize or default.
Forward outlook
- Local home prices are declining (-3.0%/yr); year-one equity from $2k of loan paydown is wiped out by about $9k of value loss. Plan a longer hold.
- Berkshire County population projected at -24% by 2050 — secular population decline; favor cash flow + early exit over multi-decade hold.
- At projected returns (-3.0% appreciation + 7.7% rent growth), your $84k cash investment doubles in ~1 year — after that, you're playing with house money.
Negotiation context
- It's been on market 39 days — a 3% lower offer ($291k) is reasonable based on typical stale-listing flexibility.
- 2 sale attempts since 3y ago with the ask held roughly flat each time — persistent listings suggest the price (not the market) is what's stuck; bring a comps-based counter.
- Current owner paid $240k; 25% above their basis — modest negotiation headroom, anchor on the comps not their cost.
Risks & watch-outs
- Watch-outs: built in 1880 — expect roof / HVAC / electrical / plumbing capex.
Questions for the listing agent
- It's been on market 39 days. Have you received any prior offers? Is the seller open to a 3% concession, seller financing, or rate buy-down credit?
- Can we see the unit-by-unit rent roll, current vacancy, and any below-market leases? What's the average tenancy length?
- What capital expenditures (roof, boiler, parking lot, exteriors) have been made in the last 5 years, and what's planned in the next 2?
- Built in 1880 — when were the roof, HVAC, electrical panel, plumbing, and water heater last replaced?
- Is there a deadline driving the sale (1031 exchange, divorce, estate, relocation)? That informs how much negotiation room exists.
- Schools are D-rated, which usually means shorter tenancies and higher turnover. Who's the typical renter profile here, and what's been the actual vacancy rate?
- Crime grade is D in this area — have there been break-ins, vandalism, or insurance claims at this property in the last 3 years? What carrier currently insures it and at what premium?
- The area grade is low — what's the realistic commute time and amenity access for the typical tenant pool here? Any planned neighborhood developments (good or bad) we should know about?
- What's the average days-on-market for RENTAL listings here right now (not sales)? A rising rental-DOM trend means longer vacancies and softer asking-rent achievability than the comps imply.
- What's the recent tenant-quality profile in this submarket — average credit score on applications, eviction rate, late-payment / NSF rate, and stable-employment percentage? A property-management company in the area should have these aggregated.
- How much new apartment / multifamily construction is in the pipeline within 1–3 miles? Heavy new supply (>2% of stock underway) typically softens rents 12–24 months out; light construction supports rent growth.
Investment metrics
- 1% rule
- 5.08% ✓
- Cap rate
- 46.81%
- Cash-on-cash
- 144.70%
- DSCR
- 7.44
- GRM
- 1.6
CMA / ARV
- ARV (on-the-fly)
- $262,632
- Comps found
- 12
Show comp detail 12 sales within ~0.75 mi
| Address | Dist | Beds/Ba | Sqft | Sold | Price | $/sf | Match |
|---|---|---|---|---|---|---|---|
| 27-31 Pleasant St | 0.00mi | 6/3.0 (+1) | 2,118 (0%) | 1mo | $300,000 | $142 | 94 |
| 3-5 Pleasant St | 0.01mi | 6/2.0 (+1) | 2,214 (+4%) | 14mo | $255,851 | $116 | 71 |
| 500 Fenn St | 0.38mi | 4/3.0 (-1) | 2,208 (+4%) | 5mo | $285,000 | $129 | 66 |
| 30 Edgewood Rd | 0.59mi | 4/2.0 (-1) | 2,112 (-0%) | 3mo | $270,000 | $128 | 61 |
| 5-7 Wallace Pl | 0.22mi | 4/2.0 (-1) | 1,964 (-7%) | 12mo | $250,000 | $127 | 58 |
| 217-219 Bradford St | 0.58mi | 5/2.0 | 2,160 (+2%) | 12mo | $233,200 | $108 | 55 |
| 790 North St | 0.48mi | 4/2.0 (-1) | 2,186 (+3%) | 13mo | $270,000 | $124 | 53 |
| 104 Linden | 0.57mi | 6/2.0 (+1) | 2,103 (-1%) | 15mo | $115,000 | $55 | 51 |
| 12 Willow St | 0.19mi | 6/2.0 (+1) | 2,400 (+13%) | 12mo | $215,000 | $90 | 50 |
| 171 Francis Ave | 0.57mi | 4/2.0 (-1) | 2,045 (-3%) | 11mo | $100,000 | $49 | 49 |
| 30-32 Sadler Ave | 0.67mi | 4/2.0 (-1) | 2,208 (+4%) | 9mo | $239,000 | $108 | 45 |
| 114 Danforth Ave | 0.72mi | 5/2.0 | 1,828 (-14%) | 6mo | $289,900 | $159 | 35 |
Match score weights: distance 35% · size 25% · config 20% · recency 20%. Top-matched comps best support the ARV.
Projected returns pro-forma
-3.0% appreciation · 7.72% rent growth · sell at horizon
- IRR
- —
- Equity multiple
- 9.01×
- Total profit
- $672,496
- Equity at exit
- $44,731
- IRR
- —
- Equity multiple
- 21.95×
- Total profit
- $1,760,084
- Equity at exit
- $25,939
Cash invested: $84,000 (down + closing). Projections, not guarantees.
Landlord ↔ Tenant lean methodology
- Overall (STATE)
- 20 Strongly Tenant-Friendly
- State Massachusetts
- 20 Strongly Tenant-Friendly · D+15
- County
- — inherits STATE
- City
- — inherits STATE
ZIP-level market 01201
- Rents YoY
- 7.7%
- Active inventory
- 275
- Price-to-rent
- 18.0×
Monthly cashflow live
- Estimated rent
- $15,249 high interval (Pro) →
- Mortgage (P&I)
- −$1,573
- Tax from tax record
- −$220 /mo · $2,636/yr
- Insurance
- −$125
- HOA
- −$0
- Vacancy / Maint / Mgmt
- −$3,202
- Net cashflow
- $10,129
Break-even live
11-unit breakdown (identical units grouped — click to expand)
| Units | Beds | Baths | Est. rent |
|---|---|---|---|
| 11× units | 1 | — | $15,246 |
| #1 | 1 | — | $1,386 |
| #2 | 1 | — | $1,386 |
| #3 | 1 | — | $1,386 |
| #4 | 1 | — | $1,386 |
| #5 | 1 | — | $1,386 |
| #6 | 1 | — | $1,386 |
| #7 | 1 | — | $1,386 |
| #8 | 1 | — | $1,386 |
| #9 | 1 | — | $1,386 |
| #10 | 1 | — | $1,386 |
| #11 | 1 | — | $1,386 |
| Total (11 units) | $15,249 | ||
UW: 25.0% down · 7.5% · 30yr · 1.5% tax · 5.0% vac · 8.0% maint · 8.0% mgmt
Financing live
Cash to close
- Down payment
- $75,000
- Closing costs
- $9,000
- Reserves months
- —
- Total cash needed
- —
Loan-product check · same deal, 3 products live
Conventional
25% down · 7.5% · 30yr
- Down + closing
- —
- Monthly P&I
- —
- Monthly cashflow
- —
- DSCR
- —
- Eligible?
- —
Personal DTI + credit; lowest rate.
DSCR
20% down · 8.5% · 30yr
- Down + closing
- —
- Monthly P&I
- —
- Monthly cashflow
- —
- DSCR
- —
- Eligible?
- —
No personal income docs; deal must DSCR.
Hard money
10% down · 12.0% · 12mo
- Down + closing
- —
- Monthly P&I
- —
- Monthly cashflow
- —
- DSCR
- —
- Eligible?
- —
Short-term bridge; refi at stabilization.
Rent comps 2 comps
| Address | Beds | Baths | Sqft | Rent | $/sqft | DOM | Units | Dist |
|---|---|---|---|---|---|---|---|---|
| 117 Lincoln St Unit 117 Pittsfield, MA | 4.0 | 2.0 | 1500 | $2,000 | $1.33 | 44d | 1 | 0.14mi |
| 76 Stoddard Ave Unit 78 Pittsfield, MA | 4.0 | 1.5 | 1560 | $2,000 | $1.28 | 44d | 1 | 0.36mi |
Listing history 6 events
-
2026-03-30status Pending
-
2026-02-17$300,000 Active
-
2023-08-18soldstatus $240,500 Closed 347-char remark
Show marketing remark (347 chars)
Take advantage of this vacant and turnkey 3 family property. Perfect for an owner occupied ready to produce exceptional rental income with current market rents. This property offers off street parking, separate utilities. The apartments breakdown are one with 3 beds 1 bath, the second unit with 2 beds 1 bath and there is the studio unit as well.
-
2023-07-23status Pending 347-char remark
Show marketing remark (347 chars)
Take advantage of this vacant and turnkey 3 family property. Perfect for an owner occupied ready to produce exceptional rental income with current market rents. This property offers off street parking, separate utilities. The apartments breakdown are one with 3 beds 1 bath, the second unit with 2 beds 1 bath and there is the studio unit as well.
-
2023-07-15$239,900 Active 347-char remark
Show marketing remark (347 chars)
Take advantage of this vacant and turnkey 3 family property. Perfect for an owner occupied ready to produce exceptional rental income with current market rents. This property offers off street parking, separate utilities. The apartments breakdown are one with 3 beds 1 bath, the second unit with 2 beds 1 bath and there is the studio unit as well.
-
1989-11-06soldstatus $77,000
ⓘ Source: listings_history table (triggers on properties + properties_extension) + one-shot
backfill from property_details.listing_events for pre-trigger history.
Tax reassessment forecast MA · Partial reset (capped growth)
- Current annual tax
- $2,636 · $220/mo
- Projected year-2 tax
- $3,163 · $264/mo
- Expected delta
- +$527/yr (+$44/mo · 20.0%)
ⓘ Screening estimate from a state-policy table — verify with the county assessor before closing.
Climate risk First Street
- Flood 1/10 Low FEMA zone X · 0% chance over 30 yrs
- Wildfire 1/10 Low
- Heat 2/10 Low 7 d/yr ≥92°F today · 16 d/yr by 30 yrs out
- Wind 4/10 Moderate 9% chance of damaging wind over 30 yrs
- Air quality 2/10 Low 1 unhealthy d/yr today · 1 by 30 yrs out
Nearby sold comps map
Loading sold comps map…
Walkable amenities ~0.75 mi
Loading nearby amenities…
Taxation est. · year 1
- Rental income
- $182,988
- − Mortgage interest
- −$16,805
- − Property taxes
- −$2,636
- − Insurance
- −$1,500
- − Repairs & maintenance
- −$14,639
- − Management
- −$14,639
- − Depreciation
- −$8,727
- Taxable income
- $124,042
- Est. tax owed @ 24.0%
- −$29,770
- After-tax cash flow
- $91,776/yr
For passive investors: Depreciation is non-cash, so a rental often shows a tax loss while cash-flowing — sheltering income. Rental losses are passive: they offset passive income freely, and up to $25,000/yr can offset ordinary (W-2) income if you actively participate and your MAGI is under $100k (phasing out to $0 by $150k); unused losses carry forward. On sale, claimed depreciation is recaptured at up to 25%, and gains may owe capital-gains tax (a 1031 exchange can defer both). Figures are a year-1 estimate at your 24.0% rate — not tax advice; consult a CPA.
Schools (NCES district)
- District
- Pittsfield
- NCES district ID
- 2509630
- Math proficiency
- 19% ▼ -10.00%
- Reading proficiency
- 34% ▼ -2.00%
- Median HH income
- $44,032
- Composite
- 22.67/100
- National rank
- #8046
- State rank
- #272 of 302 in MA
Livability — Pittsfield
- Score
- 75/100
- State rank
- #70
- US rank
- #3820
Category grades
Schools grade is shown separately in the Schools card above.
Census & demographics
- Census place
- Pittsfield, MA
- County
- Berkshire County · 44,848 people
- City population
- 44,848
- Metro
- Pittsfield, MA
- Population (ZIP)
- 44,848
- Household income
- $71,093
- Rent vs Own
- Severe rent burden
- 1580.0
Population outlook (Berkshire County) Hauer SSP2
- Today (2025)
- 119,723 people
- By 2030
- 114,608 · -4.3%
- By 2040
- 102,806 · -14.1%
- By 2050
- 91,305 · -23.7%
- By 2075
- 71,517 · -40.3%
- By 2100
- 57,988 · -51.6%
Race, ethnicity, and origin ACS 2023
- Neighborhood character
- Predominantly White (78%)
- Race & ethnicity
- White 78% Two or more races 10% Hispanic / Latino 9% Black 5% Asian 1%
- Hispanic origin (detail)
- Puerto Rican 3%
- Common ancestry
- Lithuanian 8% Romanian 6% Slovak 2%
- Foreign-born
- 7% · Canada, Jamaica
- Languages at home
- 90% English-only · Spanish 6% Other Indo-European 1% Russian/Polish/Slavic 1%
Political lean MEDSL · Berkshire
- 2024 margin
- Solid D (+39.9) · D 68.9% · R 29.0% · Other 2.1%
- 2008→2024 swing
- -12.5pp toward R · 2008: 52.4pp · 2024: 39.9pp
- All cycles
- 2024: D+39.9 2020: D+47.1 2016: D+41.5 2012: D+53.7 2008: D+52.4
Not yet ingested
- Civics
- —
Market trends
- HPI YoY
- ▼ -199.88%
- Current HPI
- 283.3421
- Rent YoY
- ▲ 7.72%
- Metro
- Pittsfield, MA
- State GDP YoY
- ▲ 2.28%
- F500 in state
- 38
Industry mix (Fortune 500 HQ in MA)
| Industry | F500 HQs | Revenue |
|---|---|---|
| Technology | 3 | $17B |
|
||
| Insurance | 2 | $84B |
|
||
| Retail | 2 | $76B |
|
||
| Life Sciences | 1 | $43B |
|
||
| Energy Technology | 1 | $31B |
|
||
| Aerospace / Defense | 1 | $18B |
|
||
Price history
+289.6% since first listed6 events — show timeline
- 2026-03-30 Pending — BCMLS
- 2026-02-17 Listed $300,000 BCMLS
- 2023-08-18 Sold (MLS) $240,500 BCMLS
- 2023-07-23 Pending — BCMLS
- 2023-07-15 Listed $239,900 BCMLS
- 1989-11-06 Sold (Public Records) $77,000 Public Records
Property tax history
+3.4%/yrLatest (2023): $2,636 · +5.5% YoY. Source: county tax records.
Cash-flow waterfall
monthlySold comps — $/sqft
last 12 mo · ≤1 miLoading sold comps…