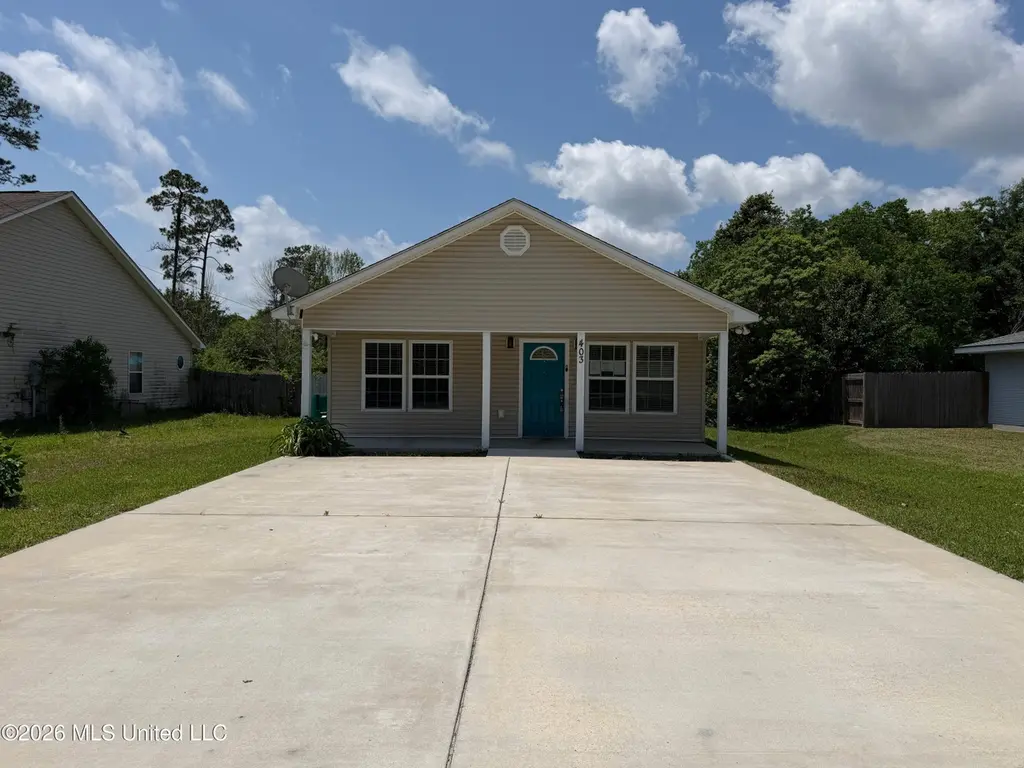
403 Saint Jude St · Waveland, MS
Flood risk 6/10 · Moderate
- FEMA flood zone
- AE
- Chance of flooding over 30 yrs
- 0.51%
- Est. flood insurance / yr
- $1,737 – $8,500
Fire risk 1/10 · Minimal
- Est. fire insurance / yr
- $1,241 – $2,305
Heat risk 10/10 · Severe
- Hot days now (above 107°F)
- 7 days/yr
- Hot days in 30 yrs
- 21 days/yr
Wind risk 9/10 · Severe
- Chance of severe wind over 30 yrs
- 99.0%
Air-quality risk 1/10 · Minimal
- Unhealthy air days now
- 0 days/yr
- Unhealthy air days in 30 yrs
- 0 days/yr
Risk factors via First Street. Map © Google.
Why this score? — see what drove the B+ grade
The composite is a weighted blend of 9 inputs, each scored 0–100. Each bar is that input's sub-score; the figure is the points it added to the 100-point composite (weight × sub-score).
- Cash flow +30.0/30.0
- ARV discount +15.0/15.0
- 1% rule +10.0/10.0
- DSCR +10.0/10.0
- Schools +3.9/10.0
- Livability +3.1/5.0
- Rent growth +2.5/5.0
- Condition / age +2.5/5.0
- Appreciation +0.0/10.0
$159,000
🖨 Deal sheet (PDF) 📄 Offer letter ✓ Due diligence
Listing remarks
Charming 4 bed, 2 bath, with fenced yard and parking for 4 vehicles. Open living kitchen combo with LVP flooring throughout. Property is owned by the US Dept. of HUD. Case # 281-539742. FHA Insurable w/ escrow. "IE, Subject to Appraisal" Seller makes no representations or warranties as to property condition. Buyer is responsible for connecting utilities at their expense. Managed by Olympusams. Visit Hudhomestore. gov for availability and placing bids. Exclusive bidding periods are open to Owner Occupants, Nonprofits and Gov't Agencies only.
Key facts
- 5,227 sq ft lot
- 4 parking spots
- Built 2007
Property features AI
Exterior
- Parking: Parking for 4 vehicles; Concrete parking with direct access
- Utilities: Public water; Public sewer; Electricity available
- Home design: Single-family house; One story; Move-in ready
- Construction: Vinyl siding construction; Shingle roof; Slab foundation; Built area of 1,494 (public records)
- Exterior features: Porch; Back yard fencing; Fenced, city lot; Private yard
Interior
- Kitchen: Dishwasher; Electric range; Microwave; Refrigerator
- Flooring: Luxury vinyl flooring
- Bathrooms: 2 full bathrooms
- Heating & cooling: Central electric heating; Central electric air conditioning
- Interior features: Move-in ready condition; Private yard access (from interior to exterior)
- Laundry & utility: Indoor laundry room
Neighborhood map
What this means for you Summary
Snapshot
- This is a 4-bed/2.0-bath single-family listed at $159k.
Deal economics
- At list price, monthly cash flow is $491 ($6k/yr) — positive.
- The deal already cash-flows at list — no discount required.
- Meets the 1% rule at list price ($2k rent vs $159k).
- Recommended offer: $154k (3.0% below list) — sets the bar for market timing.
- Cap rate 13.2% vs local median 2.5% in Waveland — top-decile yield for the area; either an underpriced asset or a hidden risk that comps aren't pricing in. Stress-test before assuming the spread holds.
Location & tenants
- Location reads 61/100 on livability (#199 in MS) — a middle-class / working-renter tenant base. Strengths: cost of living A+, housing A+, health & safety A+; Watch: amenities F, commute F, employment D-.
- Bay St Louis Waveland School District (suburban): math 51% / reading 43% proficiency, ranked #21 of 130 in MS (top 16%) — families likely to look elsewhere, expect single-tenant / working-renter base with shorter leases; 74% free/reduced lunch — lower-income household profile, screen leases tightly.
- Zoned schools: Waveland Elementary School (425 students, 100% FRL); Bay Waveland Middle School (math 51% / reading 42%, grade D+, #38 of 179 statewide, top 21%, 392 students, 100% FRL); Bay High School (math 47% / reading 37%, grade F, #43 of 197 statewide, top 24%, 491 students, 100% FRL) — zoned schools average 100% FRL vs 74% district-wide (26 pts higher); higher-poverty schools than district average — tighter screening recommended.
- Market conditions: 227 active listings in the ZIP; 1 comparable units currently listed for rent nearby; 248 units permitted in Hancock County in 2024 (0 in 5+ unit buildings).
Forward outlook
- Local home prices are declining (-3.0%/yr); year-one equity from $1k of loan paydown is wiped out by about $5k of value loss. Plan a longer hold.
- Hancock County population projected at +20% by 2050 — long-run rental-demand tailwind backs the buy-and-hold thesis.
- At projected returns (-3.0% appreciation + 3.0% rent growth), your $45k cash investment doubles in ~9 years — after that, you're playing with house money.
Negotiation context
- It's been on market 46 days — a 3% lower offer ($154k) is reasonable based on typical stale-listing flexibility.
- 8 sale attempts since 10y ago; this cycle's ask has dropped $53k (25%) from the opening price — seller is motivated, your offer sets the floor, not the list.
Risks & watch-outs
- Watch-outs: flood insurance adds $427/mo.
- Climate carrying-cost: in FEMA flood zone AE (mandatory federal flood insurance); severe wind risk, 99% chance of damaging wind over 30y; extreme-heat days projected 7→21/yr by 2055 (HVAC capex compounding) — expect insurance premiums to compound above CPI over the hold.
Questions for the listing agent
- It's been on market 46 days. Have you received any prior offers? Is the seller open to a 3% concession, seller financing, or rate buy-down credit?
- What's the actual annual flood-insurance premium (NFIP or private), and is the property in a SFHA with mandatory coverage?
- Is there a deadline driving the sale (1031 exchange, divorce, estate, relocation)? That informs how much negotiation room exists.
- Schools are F-rated, which usually means shorter tenancies and higher turnover. Who's the typical renter profile here, and what's been the actual vacancy rate?
- What's the average days-on-market for RENTAL listings here right now (not sales)? A rising rental-DOM trend means longer vacancies and softer asking-rent achievability than the comps imply.
- What's the recent tenant-quality profile in this submarket — average credit score on applications, eviction rate, late-payment / NSF rate, and stable-employment percentage? A property-management company in the area should have these aggregated.
- How much new for-sale + rental construction is in the pipeline within 1–3 miles? Heavy new supply typically softens prices + rents 12–24 months out; constrained supply supports both.
Investment metrics
- 1% rule
- 1.57% ✓
- Cap rate
- 13.22%
- Cash-on-cash
- 24.74%
- DSCR
- 2.10
- GRM
- 5.3
CMA / ARV
- ARV (on-the-fly)
- $262,080
- Comps found
- 12
Show comp detail 12 sales within ~0.75 mi
| Address | Dist | Beds/Ba | Sqft | Sold | Price | $/sf | Match |
|---|---|---|---|---|---|---|---|
| 1017 Longo St | 0.33mi | 3/2.0 (-1) | 1,517 (+4%) | 8mo | $219,000 | $144 | 66 |
| 506 Fayard St | 0.37mi | 4/1.5 | 1,512 (+4%) | 18mo | $65,000 | $43 | 59 |
| 107 Andre Ct | 0.67mi | 4/2.0 | 1,520 (+4%) | 9mo | $133,500 | $88 | 54 |
| 105 Andre Ct | 0.68mi | 3/2.0 (-1) | 1,491 (+2%) | 8mo | $269,000 | $180 | 53 |
| 210 Bay Oaks Dr | 0.70mi | 3/2.0 (-1) | 1,500 (+3%) | 10mo | $380,000 | $253 | 49 |
| 524 Seventh St | 0.74mi | 3/2.0 (-1) | 1,564 (+7%) | 1mo | $317,500 | $203 | 47 |
| 138 Lafitte Dr | 0.65mi | 3/2.0 (-1) | 1,409 (-3%) | 16mo | $389,900 | $277 | 46 |
| 105 Bouslog St | 0.61mi | 3/2.0 (-1) | 1,300 (-11%) | 5mo | $205,000 | $158 | 44 |
| 212 Seventh St | 0.68mi | 3/1.5 (-1) | 1,330 (-9%) | 10mo | $159,000 | $120 | 38 |
| 400 Seventh St | 0.69mi | 3/2.0 (-1) | 1,590 (+9%) | 13mo | $299,900 | $189 | 37 |
| 124 Lafitte Dr | 0.65mi | 3/2.0 (-1) | 1,588 (+9%) | 17mo | $499,000 | $314 | 36 |
| 104 Carlos Ct | 0.72mi | 3/2.0 (-1) | 1,299 (-11%) | 12mo | $175,000 | $135 | 33 |
Match score weights: distance 35% · size 25% · config 20% · recency 20%. Top-matched comps best support the ARV.
Projected returns pro-forma
-3.0% appreciation · 3.0% rent growth · sell at horizon
- IRR
- 3.4%
- Equity multiple
- 1.13×
- Total profit
- $5,795
- Equity at exit
- $23,707
- IRR
- 13.0%
- Equity multiple
- 2.04×
- Total profit
- $46,445
- Equity at exit
- $13,747
Cash invested: $44,520 (down + closing). Projections, not guarantees.
Landlord ↔ Tenant lean methodology
- Overall (STATE)
- 90 Strongly Landlord-Friendly
- State Mississippi
- 90 Strongly Landlord-Friendly · R+11
- County
- — inherits STATE
- City
- — inherits STATE
ZIP-level market 39576
- Active inventory
- 227
- Price-to-rent
- 5.3×
Monthly cashflow live
- Estimated rent
- $2,500 medium interval (Pro) →
- Mortgage (P&I)
- −$834
- Tax from tax record
- −$157 /mo · $1,886/yr
- Insurance
- −$66
- Flood insurance flood zone
- −$427 /mo · $5,118/yr
- HOA
- −$0
- Vacancy / Maint / Mgmt
- −$525
- Net cashflow
- $491
Break-even live
Sensitivity live
| Price | -10% $581 | -5% $536 | +0% $491 | +5% $446 | +10% $401 |
|---|---|---|---|---|---|
| Rent | -10% $294 | -5% $392 | +0% $491 | +5% $590 | +10% $689 |
| Rate | -1.0pp $571 | -0.5pp $532 | base $491 | +0.5pp $450 | +1.0pp $408 |
UW: 25.0% down · 7.5% · 30yr · 1.5% tax · 5.0% vac · 8.0% maint · 8.0% mgmt
Financing live
Cash to close
- Down payment
- $39,750
- Closing costs
- $4,770
- Reserves months
- —
- Total cash needed
- —
Loan-product check · same deal, 3 products live
Conventional
25% down · 7.5% · 30yr
- Down + closing
- —
- Monthly P&I
- —
- Monthly cashflow
- —
- DSCR
- —
- Eligible?
- —
Personal DTI + credit; lowest rate.
DSCR
20% down · 8.5% · 30yr
- Down + closing
- —
- Monthly P&I
- —
- Monthly cashflow
- —
- DSCR
- —
- Eligible?
- —
No personal income docs; deal must DSCR.
Hard money
10% down · 12.0% · 12mo
- Down + closing
- —
- Monthly P&I
- —
- Monthly cashflow
- —
- DSCR
- —
- Eligible?
- —
Short-term bridge; refi at stabilization.
Rent comps 1 comps
| Address | Beds | Baths | Sqft | Rent | $/sqft | DOM | Units | Dist |
|---|---|---|---|---|---|---|---|---|
| 216 Carre Ct Bay Saint Louis, MS | 3.0 | 2.5 | 1480 | $2,500 | $1.69 | 15d | 1 | 1.33mi |
Listing history 47 events
-
2026-06-16status $159,000 Pending 46 DOM
-
2026-06-15days on market $159,000 Active 46 DOM
-
2026-06-14price $159,000 Active 44 DOM
-
2026-06-13days on market $212,000 Active 44 DOM
-
2026-06-12days on market $212,000 Active 43 DOM
-
2026-06-09days on market $212,000 Active 40 DOM
-
2026-06-08days on market $212,000 Active 39 DOM
-
2026-06-07days on market $212,000 Active 37 DOM
-
2026-06-04days on market $212,000 Active 34 DOM
-
2026-06-02days on market $212,000 Active 33 DOM
-
2026-06-01days on market $212,000 Active 32 DOM
-
2026-05-31days on market $212,000 Active 31 DOM
-
2026-04-29$212,000 Active
-
2026-02-16historical
-
2025-10-24price $239,000
-
2025-08-06price $227,000
-
2025-06-17$229,000 Active
-
2025-03-10price $215,000
-
2025-02-28historical
-
2024-12-13price $215,000
-
2024-12-13price $215,000
-
2024-12-13price $215,000
-
2024-12-01price $222,400
-
2024-11-28price $222,400
-
2024-11-28price $222,400
-
2024-11-28price $222,400
-
2024-11-19price $224,900
-
2024-11-19price $224,900
-
2024-11-19price $224,900
-
2024-11-19price $224,900
-
2024-09-06price $229,900
-
2024-09-06price $229,900
-
2024-09-06price $229,900
-
2024-08-27$235,000 Active
-
2024-08-20$229,900 Active
-
2023-08-04soldstatus
-
2023-07-31soldstatus Closed
-
2023-06-24status Pending
-
2023-05-11status Active
-
2023-04-23status Pending
-
2023-04-20$219,000 Active
-
2020-05-12soldstatus
-
2020-03-10$30,000
-
2017-03-01soldstatus
-
2016-09-10$89,500
-
2007-02-23soldstatus
-
1995-12-06soldstatus
ⓘ Source: listings_history table (triggers on properties + properties_extension) + one-shot
backfill from property_details.listing_events for pre-trigger history.
Tax reassessment forecast MS · Resets to sale price
- Current annual tax
- $1,886 · $157/mo
- Projected year-2 tax
- $1,886 · $157/mo
- Expected delta
- $0/yr ($0/mo · 0.0%)
ⓘ Screening estimate from a state-policy table — verify with the county assessor before closing.
Climate risk First Street
- Flood 6/10 Major FEMA zone AE · 51% chance over 30 yrs
- Wildfire 1/10 Low
- Heat 10/10 Extreme 7 d/yr ≥107°F today · 21 d/yr by 30 yrs out
- Wind 9/10 Extreme 99% chance of damaging wind over 30 yrs
- Air quality 1/10 Low 0 unhealthy d/yr today · 0 by 30 yrs out
Nearby sold comps map
Loading sold comps map…
Walkable amenities ~0.75 mi
Loading nearby amenities…
Taxation est. · year 1
- Rental income
- $30,000
- − Mortgage interest
- −$8,906
- − Property taxes
- −$1,886
- − Insurance
- −$5,914
- − Repairs & maintenance
- −$2,400
- − Management
- −$2,400
- − Depreciation
- −$4,625
- Taxable income
- $3,868
- Est. tax owed @ 24.0%
- −$928
- After-tax cash flow
- $4,966/yr
For passive investors: Depreciation is non-cash, so a rental often shows a tax loss while cash-flowing — sheltering income. Rental losses are passive: they offset passive income freely, and up to $25,000/yr can offset ordinary (W-2) income if you actively participate and your MAGI is under $100k (phasing out to $0 by $150k); unused losses carry forward. On sale, claimed depreciation is recaptured at up to 25%, and gains may owe capital-gains tax (a 1031 exchange can defer both). Figures are a year-1 estimate at your 24.0% rate — not tax advice; consult a CPA.
Schools (NCES district)
- District
- Bay St Louis Waveland School District
- NCES district ID
- 2800570
- Math proficiency
- 51% ▲ 4.00%
- Reading proficiency
- 43% ▼ -3.00%
- Median HH income
- $38,774
- Composite
- 39.27/100
- National rank
- #3998
- State rank
- #21 of 130 in MS
Livability — Waveland
- Score
- 61/100
- State rank
- #199
- US rank
- #18110
Category grades
Schools grade is shown separately in the Schools card above.
Census & demographics
- Census place
- Waveland, MS
- City population
- 6,249
- Population (ZIP)
- 6,249
Population outlook (Hancock County) Hauer SSP2
- Today (2025)
- 52,161 people
- By 2030
- 54,753 · +5.0%
- By 2040
- 59,242 · +13.6%
- By 2050
- 62,417 · +19.7%
- By 2075
- 68,168 · +30.7%
- By 2100
- 69,212 · +32.7%
Race, ethnicity, and origin ACS 2023
- Neighborhood character
- Predominantly White (76%)
- Race & ethnicity
- White 76% Black 13% Two or more races 8% Hispanic / Latino 4%
- Common ancestry
- Lithuanian 8% Italian 1% Russian 1%
- Foreign-born
- 4% · Canada
- Languages at home
- 95% English-only · French/Haitian/Cajun 2% Spanish 2% Arabic 1%
Political lean MEDSL · Hancock
- 2024 margin
- Solid R (+58.7) · D 20.1% · R 78.8% · Other 1.1%
- 2008→2024 swing
- -4.4pp toward R · 2008: -54.2pp · 2024: -58.7pp
- All cycles
- 2024: R+58.7 2020: R+55.5 2016: R+59.4 2012: R+52.8 2008: R+54.2
Not yet ingested
- Civics
- —
Market trends
- HPI YoY
- ▼ -144.70%
- Current HPI
- 218.6299
- Rent YoY
- —
- Metro
- —
- State GDP YoY
- —
- F500 in state
- 0
Price history
+136.9% since first listed35 events — show timeline
- 2026-04-29 Listed $212,000 MLSU
- 2026-02-16 Listing Removed — MLSU
- 2025-10-24 Price Changed $239,000 MLSU
- 2025-08-06 Price Changed $227,000 MLSU
- 2025-06-17 Listed $229,000 MLSU
- 2025-03-10 Price Changed $215,000 AcadianaMLS
- 2025-02-28 Listing Removed — MLSU
- 2024-12-13 Price Changed $215,000 MLSU
- 2024-12-13 Price Changed $215,000 PRCBOR
- 2024-12-13 Price Changed $215,000 GSREIN
- 2024-12-01 Price Changed $222,400 AcadianaMLS
- 2024-11-28 Price Changed $222,400 MLSU
- 2024-11-28 Price Changed $222,400 PRCBOR
- 2024-11-28 Price Changed $222,400 GSREIN
- 2024-11-19 Price Changed $224,900 PRCBOR
- 2024-11-19 Price Changed $224,900 AcadianaMLS
- 2024-11-19 Price Changed $224,900 GSREIN
- 2024-11-19 Price Changed $224,900 MLSU
- 2024-09-06 Price Changed $229,900 PRCBOR
- 2024-09-06 Price Changed $229,900 MLSU
- 2024-09-06 Price Changed $229,900 GSREIN
- 2024-08-27 Listed $235,000 MLSU
- 2024-08-20 Listed $229,900 AcadianaMLS
- 2023-08-04 Sold (Public Records) — Public Records
- 2023-07-31 Sold (MLS) — MLSU
- 2023-06-24 Pending — MLSU
- 2023-05-11 Relisted — MLSU
- 2023-04-23 Pending — MLSU
- 2023-04-20 Listed $219,000 MLSU
- 2020-05-12 Sold (MLS) — MLSU
- 2020-03-10 Listed $30,000 MLSU
- 2017-03-01 Sold (MLS) — MLSU
- 2016-09-10 Listed $89,500 MLSU
- 2007-02-23 Sold (Public Records) — Public Records
- 1995-12-06 Sold (Public Records) — Public Records
Property tax history
+54.3%/yrLatest (2025): $1,886 · +0.0% YoY. Source: county tax records.
Cash-flow waterfall
monthlySold comps — $/sqft
last 12 mo · ≤1 miLoading sold comps…