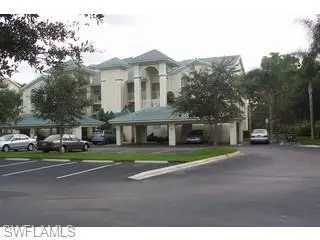
15405 Cedarwood Ln #201 · Bonita Springs, FL
Flood risk 7/10 · Major
- FEMA flood zone
- X (shaded)
- Chance of flooding over 30 yrs
- 0.94%
- Est. flood insurance / yr
- $507 – $1,088
Fire risk 3/10 · Minor
- Est. fire insurance / yr
- $947 – $1,759
Heat risk 10/10 · Severe
- Hot days now (above 107°F)
- 7 days/yr
- Hot days in 30 yrs
- 31 days/yr
Wind risk 10/10 · Severe
- Chance of severe wind over 30 yrs
- 99.0%
Air-quality risk 2/10 · Minimal
- Unhealthy air days now
- 1 days/yr
- Unhealthy air days in 30 yrs
- 1 days/yr
Risk factors via First Street. Map © Google.
Why this score? — see what drove the B- grade
The composite is a weighted blend of 9 inputs, each scored 0–100. Each bar is that input's sub-score; the figure is the points it added to the 100-point composite (weight × sub-score).
- Cash flow +27.3/30.0
- 1% rule +9.6/10.0
- DSCR +9.5/10.0
- ARV discount +7.5/15.0
- Schools +5.0/10.0
- Livability +3.5/5.0
- Condition / age +2.5/5.0
- Rent growth +2.2/5.0
- Appreciation +0.0/10.0
$299,500
🖨 Deal sheet 📄 Offer letter ✓ Due diligence
Listing remarks
Welcome to Bermuda Bay at Bay Forest, where coastal living meets comfort and convenience! This beautifully maintained 2-bedroom + den, 2-bath end-unit condo offers a rare combination of privacy, natural light, and access to world class amenities, just 3.5 miles (8 minutes) from the beach. Step inside to an open, airy floor plan featuring luxury vinyl plank flooring and a tile entryway for easy care and lasting style. The bright eat in kitchen includes white cabinetry, smooth-top stove, side by side refrigerator, microwave, dishwasher, pantry, and a modern tile backsplash. The space flows seamlessly into the dining and living areas, perfect for everyday living or hosting friends and family.
Key facts
- Open airy floor plan
- Tile entryway
- White cabinetry
Tags
Property features AI
Finance
- Financial info: Rental/pet policy: pets allowed conditionally (call for details); Maximum of 3 pets, maximum pet weight 30 lbs
- HOA & community: Homeowners association with quarterly fee; Quarterly association fee: $2,070; Association covers grounds maintenance, pest control, road maintenance, and street lights; Community amenities include fitness center, pier, pickleball, pool, sidewalks, trails, and management; Gated community with street lights; Community has 87 units
Exterior
- Parking: Parking details not provided
- Security: Security gate; Gated community; Key card entry; Smoke detectors
- Utilities: Public water; Public sewer; Cable available; High-speed internet available
- Home design: Single-story; Entry level 2; Northeast-facing; Resale property
- Construction: Built with block, concrete, and stucco; Tile roof
- Exterior features: Patio; Zero lot line; Paved road access; Southwest exposure; Reclaimed water irrigation; Community pool
Interior
- Kitchen: Dishwasher; Microwave; Range; Refrigerator; Eat-in kitchen with pantry
- Bedrooms: Den; Great room
- Flooring: Vinyl
- Bathrooms: 2 full bathrooms
- Heating & cooling: Central heating (electric); Central air conditioning (electric)
- Interior features: Closet cabinetry; Dual sinks; Eat-in kitchen; Family/dining room; Living/dining room; Pantry; Tub/shower; Cable TV available; High-speed internet available; Split bedrooms; Single-hung windows; Unfurnished
- Laundry & utility: Washer; Dryer
Neighborhood map
What this means for you Summary
Snapshot
- This is a 2-bed/2.0-bath condo listed at $300k.
Deal economics
- At list price, monthly cash flow is $803 ($10k/yr) — positive.
- The deal already cash-flows at list — no discount required.
- Meets the 1% rule at list price ($4k rent vs $300k).
- Recommended offer: $282k (6.0% below list) — sets the bar for market timing.
- Cap rate 9.8% vs local median 1.7% in Bonita Springs — top-decile yield for the area; either an underpriced asset or a hidden risk that comps aren't pricing in. Stress-test before assuming the spread holds.
Location & tenants
- Location reads 70/100 on livability (#428 in FL) — a middle-class / working-renter tenant base. Strengths: crime A+, housing A+, employment A; Watch: schools C-, cost of living C-, health & safety D.
- Collier (suburban): math 60% / reading 56% proficiency, ranked #16 of 73 in FL (top 22%) — acceptable for families but not a draw, mixed tenant base, ~2y average lease.
- Market conditions: Rents soft (-1.1%/yr); 595 active listings in the ZIP; 40 comparable units currently listed for rent nearby; rentals at typical pace (median 24d on market — plan ~3-4 weeks tenant-placement turnaround); solid renter incomes; 3,520 units permitted in Collier County in 2024 (959 in 5+ unit buildings).
- At $4,365/mo this rent would consume 54% of the median local household income ($98k/yr) (locally 1006% of renters already pay >50% of income on rent) — very limited rent-growth headroom before tenants either downsize or default.
Forward outlook
- Local home prices are declining (-3.0%/yr); year-one equity from $2k of loan paydown is wiped out by about $9k of value loss. Plan a longer hold.
- Collier County population projected at +30% by 2050 — long-run rental-demand tailwind backs the buy-and-hold thesis.
Negotiation context
- It's been on market 79 days — a 6% lower offer ($282k) is reasonable based on typical stale-listing flexibility.
- 4 sale attempts since 19y ago with the ask held roughly flat each time — persistent listings suggest the price (not the market) is what's stuck; bring a comps-based counter.
- Current owner paid $205k; 46% above their basis — modest negotiation headroom, anchor on the comps not their cost.
Risks & watch-outs
- Watch-outs: flood insurance adds $66/mo.
- Climate carrying-cost: major flood risk; severe wind risk, 99% chance of damaging wind over 30y; extreme-heat days projected 7→31/yr by 2055 (HVAC capex compounding) — expect insurance premiums to compound above CPI over the hold.
Questions for the listing agent
- It's been on market 79 days. Have you received any prior offers? Is the seller open to a 6% concession, seller financing, or rate buy-down credit?
- What's the actual annual flood-insurance premium (NFIP or private), and is the property in a SFHA with mandatory coverage?
- What does the HOA fee cover, when was the last increase, and are there any pending special assessments or reserve-fund shortfalls?
- Any open or pending special assessments — roof, HVAC, plumbing, elevator, façade? What's the per-unit balance and payoff schedule, and is the seller paying it off at close or rolling it to the buyer?
- Why hasn't it sold? Are there any deal-killer items the seller is aware of (foundation, flood, title, zoning, code violations)?
- Is there a deadline driving the sale (1031 exchange, divorce, estate, relocation)? That informs how much negotiation room exists.
- What's the average days-on-market for RENTAL listings here right now (not sales)? A rising rental-DOM trend means longer vacancies and softer asking-rent achievability than the comps imply.
- What's the recent tenant-quality profile in this submarket — average credit score on applications, eviction rate, late-payment / NSF rate, and stable-employment percentage? A property-management company in the area should have these aggregated.
- How much new apartment / multifamily construction is in the pipeline within 1–3 miles? Heavy new supply (>2% of stock underway) typically softens rents 12–24 months out; light construction supports rent growth.
Investment metrics
- 1% rule
- 1.46% ✓
- Cap rate
- 9.78%
- Cash-on-cash
- 12.44%
- DSCR
- 1.55
- GRM
- 5.7
CMA / ARV
No comps found within radius.
Projected returns pro-forma
-3.0% appreciation · 0.0% rent growth · sell at horizon
- IRR
- -3.2%
- Equity multiple
- 0.88×
- Total profit
- $-9,779
- Equity at exit
- $44,656
- IRR
- 1.9%
- Equity multiple
- 1.11×
- Total profit
- $9,586
- Equity at exit
- $25,895
Cash invested: $83,860 (down + closing). Projections, not guarantees.
Landlord ↔ Tenant lean methodology
- Overall (STATE)
- 87 Strongly Landlord-Friendly
- State Florida
- 87 Strongly Landlord-Friendly · R+3
- County
- — inherits STATE
- City
- — inherits STATE
ZIP-level market 34110
- Rents YoY
- -1.1%
- Active inventory
- 595
- Price-to-rent
- 5.7×
Monthly cashflow live
- Estimated rent
- $4,365 high interval (Pro) →
- Mortgage (P&I)
- −$1,571
- Tax from tax record
- −$194 /mo · $2,322/yr
- Insurance
- −$125
- Flood insurance flood zone
- −$66 /mo · $798/yr
- HOA
- −$690
- Vacancy / Maint / Mgmt
- −$917
- Net cashflow
- $803
Break-even live
UW: 25.0% down · 7.5% · 30yr · 1.5% tax · 5.0% vac · 8.0% maint · 8.0% mgmt
Financing live
Cash to close
- Down payment
- $74,875
- Closing costs
- $8,985
- Reserves months
- —
- Total cash needed
- —
Loan-product check · same deal, 3 products live
Conventional
25% down · 7.5% · 30yr
- Down + closing
- —
- Monthly P&I
- —
- Monthly cashflow
- —
- DSCR
- —
- Eligible?
- —
Personal DTI + credit; lowest rate.
DSCR
20% down · 8.5% · 30yr
- Down + closing
- —
- Monthly P&I
- —
- Monthly cashflow
- —
- DSCR
- —
- Eligible?
- —
No personal income docs; deal must DSCR.
Hard money
10% down · 12.0% · 12mo
- Down + closing
- —
- Monthly P&I
- —
- Monthly cashflow
- —
- DSCR
- —
- Eligible?
- —
Short-term bridge; refi at stabilization.
Rent comps 40 comps
| Address | Beds | Baths | Sqft | Rent | $/sqft | DOM | Units | Dist |
|---|---|---|---|---|---|---|---|---|
| 15415 Cedarwood Ln Unit 3 Naples, FL | 2.0 | 2.0 | 1428 | $2,200 | $1.54 | 13d | 1 | 0.04mi |
| 285 Naples Cove Dr #1103 Naples, FL | 2.0 | 2.0 | 1267 | $2,475 | $1.95 | 23d | 1 | 0.05mi |
| 15400 Cedarwood Ln Unit 1-201 Naples, FL | 2.0 | 2.0 | 1286 | $6,000 | $4.67 | 23d | 1 | 0.07mi |
| 15400 Cedarwood Ln #102 Naples, FL | 2.0 | 2.0 | 1286 | $6,300 | $4.90 | 13d | 1 | 0.07mi |
| 270 Naples Cove Dr #3506 Naples, FL | 3.0 | 2.0 | 1475 | $2,500 | $1.69 | 21d | 1 | 0.08mi |
| 290 Naples Cove Dr Naples, FL | 2.0 | 2.0 | 1327 | $3,400 | $2.56 | 23d | 3 | 0.09mi |
| 15191 Cedarwood Ln #2602 Naples, FL | 2.0 | 2.0 | 1267 | $2,300 | $1.82 | 23d | 1 | 0.14mi |
| 15161 Cedarwood Ln Naples, FL | 2.0 | 2.0 | 1267 | $4,000 | $3.16 | 23d | 3 | 0.19mi |
| 386 Emerald Bay Cir Unit G4 Naples, FL | 3.0 | 2.0 | 1490 | $2,500 | $1.68 | 23d | 1 | 0.27mi |
| 341 Emerald Bay Cir Unit T5 Naples, FL | 3.0 | 2.0 | 1611 | $4,500 | $2.79 | 23d | 1 | 0.34mi |
| 306 Emerald Bay Cir Unit J5 Naples, FL | 3.0 | 2.0 | 1490 | $5,900 | $3.96 | 23d | 1 | 0.36mi |
| 306 Emerald Bay Cir Unit J8 Naples, FL | 2.0 | 2.0 | 1350 | $4,000 | $2.96 | 23d | 1 | 0.36mi |
| 298 Emerald Bay Cir Unit K6 Naples, FL | 2.0 | 2.0 | 1202 | $4,750 | $3.95 | 23d | 1 | 0.38mi |
| 505 Lake Louise Cir #101 Naples, FL | 2.0 | 2.0 | 1444 | $5,500 | $3.81 | 23d | 1 | 0.53mi |
| 1001 Arbor Lake Dr Naples, FL | 2.0–3.0 | 2.0–2.5 | 1755 | $3,800 | $2.16 | 23d | 2 | 0.54mi |
| 513 Lake Louise Cir #202 Naples, FL | 2.0 | 2.0 | 1444 | $5,300 | $3.67 | 23d | 1 | 0.60mi |
| 28940 Bermuda Pointe Cir #102 Bonita Springs, FL | 2.0 | 2.0 | 1076 | $5,500 | $5.11 | 23d | 1 | 0.61mi |
| 28720 Bermuda Bay Way #205 Bonita Springs, FL | 2.0 | 2.0 | 1097 | $2,200 | $2.01 | 14d | 1 | 0.72mi |
| 526 Lake Louise Cir Unit 4-403 Naples, FL | 3.0 | 2.0 | 1740 | $6,500 | $3.74 | 23d | 1 | 0.75mi |
| 28712 Carmel Way Bonita Springs, FL | 3.0 | 2.5 | 1626 | $9,250 | $5.69 | 23d | 1 | 0.84mi |
| 3930 Windward Passage Cir #202 Bonita Springs, FL | 2.0 | 2.0 | 1478 | $1,900 | $1.29 | 16d | 1 | 0.87mi |
| 999 E Valley Dr Unit 1073522P Bonita Springs, FL | 3.0 | 2.5 | 1668 | $9,929 | $5.95 | 21d | 1 | 0.87mi |
| 62 8th St Unit 1073526P Bonita Springs, FL | 2.0 | 2.0 | 1593 | $5,435 | $3.41 | 23d | 1 | 0.90mi |
| 3951 Windward Passage Cir #102 Bonita Springs, FL | 2.0 | 2.0 | 1397 | $5,200 | $3.72 | 23d | 1 | 0.91mi |
| 265 Barefoot Beach Blvd Bonita Springs, FL | 2.0–3.0 | 2.0 | 1604 | $9,500 | $5.92 | 23d | 3 | 0.92mi |
| 265 Barefoot Beach Blvd #203 Bonita Springs, FL | 3.0 | 2.0 | 1604 | $13,000 | $8.10 | 13d | 1 | 0.93mi |
| 262 Barefoot Beach Blvd Bonita Springs, FL | 3.0 | 2.0–3.0 | 1864 | $10,500 | $5.63 | 23d | 2 | 0.93mi |
| 74 7th St Bonita Springs, FL | 3.0 | 2.0 | 1124 | $3,150 | $2.80 | 23d | 1 | 0.97mi |
| 3941 Leeward Passage Ct #203 Bonita Springs, FL | 2.0 | 2.0 | 1204 | $2,000 | $1.66 | 23d | 1 | 0.97mi |
| 3921 Leeward Passage Ct #203 Bonita Springs, FL | 2.0 | 2.0 | 1204 | $3,500 | $2.91 | 23d | 1 | 0.99mi |
| 28650 Carriage Home Dr Unit 1049692P Bonita Springs, FL | 3.0 | 2.0 | 1528 | $3,980 | $2.60 | 16d | 1 | 1.07mi |
| 64 4th St Bonita Springs, FL | 2.0 | 2.0 | 1231 | $3,700 | $3.01 | 23d | 2 | 1.13mi |
| 28611 Carriage Home Dr #101 Bonita Springs, FL | 2.0 | 2.0 | 1433 | $2,550 | $1.78 | 23d | 1 | 1.15mi |
| 60 4th St Bonita Springs, FL | 3.0 | 2.0 | 1860 | $11,400 | $6.13 | 23d | 1 | 1.16mi |
| 255 Barefoot Beach Blvd Bonita Springs, FL | 2.0–3.0 | 2.0–3.5 | 1864 | $9,700 | $5.20 | 13d | 2 | 1.17mi |
| 28327 Hidden Lake Dr Bonita Springs, FL | 3.0 | 2.0 | 1567 | $8,950 | $5.71 | 23d | 1 | 1.18mi |
| 817 Carrick Bend Cir #101 Naples, FL | 3.0 | 2.0 | 1660 | $5,995 | $3.61 | 13d | 1 | 1.23mi |
| 75 3rd St Bonita Springs, FL | 3.0 | 3.0 | 1630 | $8,900 | $5.46 | 23d | 1 | 1.24mi |
| 28700 Trails Edge Blvd Bonita Springs, FL | 3.0 | 2.0 | 1458 | $2,175 | $1.49 | 3d | 2 | 1.25mi |
| 340 Horse Creek Dr #304 Naples, FL | 2.0 | 2.0 | 1326 | $2,950 | $2.22 | 23d | 1 | 1.26mi |
HOA detail condo
- Monthly dues
- $690 · $8,280/yr
- Assessments
- None detected in remarks — confirm with the listing agent.
Listing history 5 events
-
2026-06-03days on market $299,500 Active 79 DOM
-
2026-06-02days on market $299,500 Active 78 DOM
-
2026-06-01days on market $299,500 Active 77 DOM
-
2026-05-31remarks 699-char remark
-
2026-05-31$299,500 Active 76 DOM
ⓘ Source: listings_history table (triggers on properties + properties_extension) + one-shot
backfill from property_details.listing_events for pre-trigger history.
Tax reassessment forecast FL · Resets to sale price
- Current annual tax
- $2,322 · $194/mo
- Projected year-2 tax
- $2,486 · $207/mo
- Expected delta
- +$164/yr (+$14/mo · 7.0%)
ⓘ Screening estimate from a state-policy table — verify with the county assessor before closing.
Climate risk First Street
- Flood 7/10 Severe FEMA zone X (shaded) · 94% chance over 30 yrs
- Wildfire 3/10 Moderate
- Heat 10/10 Extreme 7 d/yr ≥107°F today · 31 d/yr by 30 yrs out
- Wind 10/10 Extreme 99% chance of damaging wind over 30 yrs
- Air quality 2/10 Low 1 unhealthy d/yr today · 1 by 30 yrs out
Nearby sold comps map
Loading sold comps map…
Walkable amenities ~0.75 mi
Loading nearby amenities…
Taxation est. · year 1
- Rental income
- $52,376
- − Mortgage interest
- −$16,777
- − Property taxes
- −$2,322
- − Insurance
- −$2,295
- − Repairs & maintenance
- −$4,190
- − Management
- −$4,190
- − HOA
- −$8,280
- − Depreciation
- −$8,713
- Taxable income
- $5,609
- Est. tax owed @ 24.0%
- −$1,346
- After-tax cash flow
- $8,286/yr
For passive investors: Depreciation is non-cash, so a rental often shows a tax loss while cash-flowing — sheltering income. Rental losses are passive: they offset passive income freely, and up to $25,000/yr can offset ordinary (W-2) income if you actively participate and your MAGI is under $100k (phasing out to $0 by $150k); unused losses carry forward. On sale, claimed depreciation is recaptured at up to 25%, and gains may owe capital-gains tax (a 1031 exchange can defer both). Figures are a year-1 estimate at your 24.0% rate — not tax advice; consult a CPA.
Schools (NCES district)
- District
- Collier
- NCES district ID
- 1200330
- Math proficiency
- 60% ▼ -4.00%
- Reading proficiency
- 56% ▼ -2.00%
- Median HH income
- $58,275
- Composite
- 50.23/100
- National rank
- #1892
- State rank
- #16 of 73 in FL
Livability — Bonita Springs
- Score
- 70/100
- State rank
- #428
- US rank
- #7576
Category grades
Schools grade is shown separately in the Schools card above.
Census & demographics
- County
- Collier County · 396,295 people
- City population
- 64,727
- Metro
- Naples-Marco Island, FL
- Population (ZIP)
- 25,630
- Household income
- $97,564
- Rent vs Own
- Severe rent burden
- 1006.0
Population outlook (Collier County) Hauer SSP2
- Today (2025)
- 420,858 people
- By 2030
- 450,054 · +6.9%
- By 2040
- 502,232 · +19.3%
- By 2050
- 544,932 · +29.5%
- By 2075
- 627,203 · +49.0%
- By 2100
- 659,015 · +56.6%
Race, ethnicity, and origin ACS 2023
- Neighborhood character
- Predominantly White (84%)
- Race & ethnicity
- White 84% Hispanic / Latino 10% Two or more races 9% Asian 2% Black 1%
- Hispanic origin (detail)
- Mexican 2% Puerto Rican 1% Cuban 3%
- Common ancestry
- Romanian 4% Lithuanian 3% Slovak 2%
- Foreign-born
- 11% · Canada, South Korea
- Languages at home
- 87% English-only · Spanish 7% Other Indo-European 3% French/Haitian/Cajun 1%
Political lean MEDSL · Collier
- 2024 margin
- Solid R (+33.1) · D 33.1% · R 66.2%
- 2008→2024 swing
- -10.6pp toward R · 2008: -22.5pp · 2024: -33.1pp
- All cycles
- 2024: R+33.1 2020: R+24.7 2016: R+26.0 2012: R+30.1 2008: R+22.5
Not yet ingested
- Civics
- —
Market trends
- HPI YoY
- ▼ -172.68%
- Current HPI
- 267.4644
- Rent YoY
- ▼ -1.06%
- Metro
- Naples-Marco Island, FL
- State GDP YoY
- ▲ 3.28%
- F500 in state
- 36
Industry mix (Fortune 500 HQ in FL)
| Industry | F500 HQs | Revenue |
|---|---|---|
| Industrial Technology | 2 | $29B |
|
||
| Insurance | 2 | $17B |
|
||
| Retail | 1 | $60B |
|
||
| Technology Distribution | 1 | $58B |
|
||
| Homebuilding | 1 | $35B |
|
||
| Technology Manufacturing | 1 | $35B |
|
||
Price history
+130.4% since first listed11 events — show timeline
- 2026-03-13 Listed $299,500 FORTMLS
- 2023-09-07 Listing Removed — NAPLESMLS
- 2023-06-12 Price Changed $375,000 NAPLESMLS
- 2023-06-01 Listed $390,000 NAPLESMLS
- 2018-06-19 Sold (Public Records) $205,000 Public Records
- 2018-05-17 Listing Removed — NAPLESMLS
- 2018-05-08 Listed $225,000 NAPLESMLS
- 2009-03-26 Sold (Public Records) $190,000 Public Records
- 2009-03-20 Sold (MLS) $190,000 NAPLESMLS
- 2007-01-25 Listed $215,000 NAPLESMLS
- 2001-04-11 Sold (Public Records) $130,000 Public Records
Property tax history
+3.5%/yrLatest (2025): $2,322 · -3.6% YoY. Source: county tax records.
Cash-flow waterfall
monthlySold comps — $/sqft
last 12 mo · ≤1 miLoading sold comps…