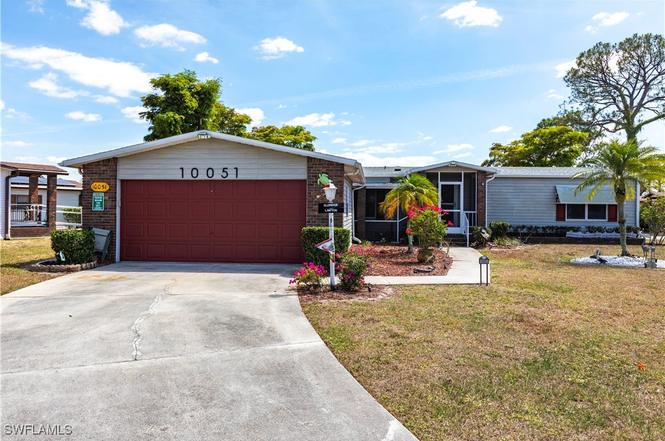
10051 Broken Woods Ct S · North Fort Myers, FL
Flood risk 1/10 · Minimal
- FEMA flood zone
- X (unshaded)
- Chance of flooding over 30 yrs
- 0.0%
- Est. flood insurance / yr
- $507 – $1,088
Fire risk 8/10 · Major
- Est. fire insurance / yr
- $947 – $1,759
Heat risk 10/10 · Severe
- Hot days now (above 107°F)
- 7 days/yr
- Hot days in 30 yrs
- 30 days/yr
Wind risk 10/10 · Severe
- Chance of severe wind over 30 yrs
- 99.0%
Air-quality risk 2/10 · Minimal
- Unhealthy air days now
- 1 days/yr
- Unhealthy air days in 30 yrs
- 1 days/yr
Risk factors via First Street. Map © Google.
Why this score? — see what drove the D grade
The composite is a weighted blend of 9 inputs, each scored 0–100. Each bar is that input's sub-score; the figure is the points it added to the 100-point composite (weight × sub-score).
- Cash flow +18.4/30.0
- 1% rule +6.3/10.0
- DSCR +5.8/10.0
- Schools +4.1/10.0
- Livability +3.7/5.0
- Condition / age +2.5/5.0
- Rent growth +2.0/5.0
- ARV discount +0.0/15.0
- Appreciation +0.0/10.0
$199,000
🖨 Deal sheet 📄 Offer letter ✓ Due diligence
Listing remarks MLS
BEAUTIFUL UPDATED HOME DESIRABLE GOLF & TENNIS COMMUNITY. OVER 1600 S. FT. WITH AN ADDITIONAL 240 S. FT. AIR CONDITIONED FINISHED LANAI. ISLAND KITCHEN WITH WALK-IN PANTRY AND WALL OVEN. LARGE MASTER SUITE WITH 2 CLOSETS AND DUAL SINKS IN BATH. GREAT CORNER LOT WITH 2 CAR GARAGE. THIS IS A MUST SEE IN A GATED, PET FRIENDLY, VERY ACTIVE 55+ COMMUNITY. CLUBHOUSE, POOL, RESTAURANT, CARDS, DANCES AND INSTANT SOCIAL LIFE.
Key facts
- Hot tub
- Beautiful clubhouse
- Owned land
Tags
Neighborhood map
What this means for you Summary
Snapshot
- This is a 2-bed/2.0-bath manufactured listed at $199k.
Deal economics
- At list price, monthly cash flow is $187 ($2k/yr) — positive.
- The deal already cash-flows at list — no discount required.
- Meets the 1% rule at list price ($2k rent vs $199k).
- Recommended offer: $175k (12.0% below list) — sets the bar for market timing.
- Cap rate 7.4% vs local median 3.6% in North Fort Myers — top-decile yield for the area; either an underpriced asset or a hidden risk that comps aren't pricing in. Stress-test before assuming the spread holds.
Location & tenants
- Location reads 74/100 on livability (#269 in FL, #4,409 nationally) — a middle-class / working-renter tenant base. Strengths: cost of living A+, housing A+, health & safety A+; Watch: employment C-, amenities F, commute F.
- Lee (suburban): math 47% / reading 50% proficiency, ranked #42 of 73 in FL (top 58%) — families likely to look elsewhere, expect single-tenant / working-renter base with shorter leases.
- Market conditions: Rents soft (-1.9%/yr); 472 active listings in the ZIP; 25 comparable units currently listed for rent nearby; rentals at typical pace (median 16d on market — plan ~3-4 weeks tenant-placement turnaround); 15,411 units permitted in Lee County in 2024 (4,686 in 5+ unit buildings).
- At $2,247/mo this rent would consume 47% of the median local household income ($57k/yr) (locally 468% of renters already pay >50% of income on rent) — very limited rent-growth headroom before tenants either downsize or default.
Forward outlook
- Local home prices are declining (-3.0%/yr); year-one equity from $1k of loan paydown is wiped out by about $6k of value loss. Plan a longer hold.
- Lee County population projected at +44% by 2050 — long-run rental-demand tailwind backs the buy-and-hold thesis.
Negotiation context
- It's been on market 346 days — a 12% lower offer ($175k) is reasonable based on typical stale-listing flexibility.
- 2 sale attempts since 12y ago; this cycle's ask has dropped $40k (17%) from the opening price — seller is motivated, your offer sets the floor, not the list.
- Current owner paid $115k; list at $199k implies a 73% gain — meaningful room to come down on a strong offer.
Risks & watch-outs
- Climate carrying-cost: severe wind risk, 99% chance of damaging wind over 30y; severe wildfire risk; extreme-heat days projected 7→30/yr by 2055 (HVAC capex compounding) — expect insurance premiums to compound above CPI over the hold.
Questions for the listing agent
- It's been on market 346 days. Have you received any prior offers? Is the seller open to a 12% concession, seller financing, or rate buy-down credit?
- What does the HOA fee cover, when was the last increase, and are there any pending special assessments or reserve-fund shortfalls?
- Why hasn't it sold? Are there any deal-killer items the seller is aware of (foundation, flood, title, zoning, code violations)?
- Is there a deadline driving the sale (1031 exchange, divorce, estate, relocation)? That informs how much negotiation room exists.
- The area grade is low — what's the realistic commute time and amenity access for the typical tenant pool here? Any planned neighborhood developments (good or bad) we should know about?
- What's the average days-on-market for RENTAL listings here right now (not sales)? A rising rental-DOM trend means longer vacancies and softer asking-rent achievability than the comps imply.
- What's the recent tenant-quality profile in this submarket — average credit score on applications, eviction rate, late-payment / NSF rate, and stable-employment percentage? A property-management company in the area should have these aggregated.
- How much new for-sale + rental construction is in the pipeline within 1–3 miles? Heavy new supply typically softens prices + rents 12–24 months out; constrained supply supports both.
Investment metrics
- 1% rule
- 1.13% ✓
- Cap rate
- 7.42%
- Cash-on-cash
- 4.03%
- DSCR
- 1.18
- GRM
- 7.4
CMA / ARV
- ARV (on-the-fly)
- $151,125
- Comps found
- 3
Show comp detail 3 sales within ~0.75 mi
| Address | Dist | Beds/Ba | Sqft | Sold | Price | $/sf | Match |
|---|---|---|---|---|---|---|---|
| 19844 Eagle Trace Ct | 0.45mi | 2/2.0 | 1,580 (-3%) | 0mo | $147,000 | $93 | 74 |
| 19851 Eagle Trace Ct S | 0.52mi | 2/2.0 | 1,519 (-6%) | 9mo | $105,000 | $69 | 58 |
| 19808 Frenchmans Ct | 0.56mi | 2/2.0 | 1,552 (-4%) | 19mo | $180,000 | $116 | 50 |
Match score weights: distance 35% · size 25% · config 20% · recency 20%. Top-matched comps best support the ARV.
Projected returns pro-forma
-3.0% appreciation · 0.0% rent growth · sell at horizon
- IRR
- -13.8%
- Equity multiple
- 0.52×
- Total profit
- $-26,741
- Equity at exit
- $29,672
- IRR
- -11.6%
- Equity multiple
- 0.41×
- Total profit
- $-32,709
- Equity at exit
- $17,206
Cash invested: $55,720 (down + closing). Projections, not guarantees.
Landlord ↔ Tenant lean methodology
- Overall (STATE)
- 87 Strongly Landlord-Friendly
- State Florida
- 87 Strongly Landlord-Friendly · R+3
- County
- — inherits STATE
- City
- — inherits STATE
ZIP-level market 33903
- Rents YoY
- -1.9%
- Active inventory
- 472
- Price-to-rent
- 7.4×
Monthly cashflow live
- Estimated rent
- $2,247 high interval (Pro) →
- Mortgage (P&I)
- −$1,044
- Tax from tax record
- −$93 /mo · $1,120/yr
- Insurance
- −$83
- HOA
- −$368
- Vacancy / Maint / Mgmt
- −$472
- Net cashflow
- $187
Break-even live
UW: 25.0% down · 7.5% · 30yr · 1.5% tax · 5.0% vac · 8.0% maint · 8.0% mgmt
Financing live
Cash to close
- Down payment
- $49,750
- Closing costs
- $5,970
- Reserves months
- —
- Total cash needed
- —
Loan-product check · same deal, 3 products live
Conventional
25% down · 7.5% · 30yr
- Down + closing
- —
- Monthly P&I
- —
- Monthly cashflow
- —
- DSCR
- —
- Eligible?
- —
Personal DTI + credit; lowest rate.
DSCR
20% down · 8.5% · 30yr
- Down + closing
- —
- Monthly P&I
- —
- Monthly cashflow
- —
- DSCR
- —
- Eligible?
- —
No personal income docs; deal must DSCR.
Hard money
10% down · 12.0% · 12mo
- Down + closing
- —
- Monthly P&I
- —
- Monthly cashflow
- —
- DSCR
- —
- Eligible?
- —
Short-term bridge; refi at stabilization.
Rent comps 25 comps
| Address | Beds | Baths | Sqft | Rent | $/sqft | DOM | Units | Dist |
|---|---|---|---|---|---|---|---|---|
| 10401 Circle Pine Rd North Fort Myers, FL | 2.0 | 2.0 | 1294 | $3,000 | $2.32 | 23d | 1 | 0.22mi |
| 19621 N Tamiami Trl North Fort Myers, FL | 3.0 | 2.0 | 1205 | $1,300 | $1.08 | 23d | 1 | 0.32mi |
| 19477 Bermuda Ct North Fort Myers, FL | 3.0 | 2.0 | 1460 | $1,499 | $1.03 | 2d | 1 | 0.42mi |
| 19421 Bermuda Ct North Fort Myers, FL | 3.0 | 2.0 | 1198 | $1,499 | $1.25 | 2d | 1 | 0.45mi |
| 19414 Bermuda Ct North Fort Myers, FL | 3.0 | 2.0 | 1251 | $1,499 | $1.20 | 2d | 1 | 0.48mi |
| 20038 Fiddlewood Ave North Fort Myers, FL | 3.0 | 2.0 | 1519 | $1,999 | $1.32 | 19d | 1 | 0.51mi |
| 20056 Sweetbay Dr North Fort Myers, FL | 3.0 | 2.0 | 1672 | $4,000 | $2.39 | 23d | 1 | 0.68mi |
| 19152 Meadowbrook Ct North Fort Myers, FL | 3.0 | 2.0 | 1251 | $1,499 | $1.20 | 2d | 1 | 0.71mi |
| 20559 Long Pond Rd North Fort Myers, FL | 3.0 | 2.0 | 1805 | $2,295 | $1.27 | 23d | 1 | 0.90mi |
| 1900 Corona del Sire Dr North Fort Myers, FL | 2.0 | 2.0 | 1449 | $2,400 | $1.66 | 23d | 1 | 0.98mi |
| 1670 Palo Duro Blvd North Fort Myers, FL | 2.0 | 2.0 | 1604 | $2,700 | $1.68 | 3d | 1 | 1.01mi |
| 2130 Rio Nuevo Dr Unit 1546442P North Fort Myers, FL | 2.0 | 2.0 | 1248 | $4,682 | $3.75 | 14d | 1 | 1.11mi |
| 20919 Villareal Way North Fort Myers, FL | 2.0 | 2.0 | 1428 | $4,000 | $2.80 | 23d | 1 | 1.14mi |
| 1701 NE 44th Ter Cape Coral, FL | 3.0 | 2.0 | 1147 | $1,800 | $1.57 | 16d | 1 | 1.15mi |
| 1701 NE 44th Ter Cape Coral, FL | 3.0 | 2.0 | 1147 | $1,800 | $1.57 | 14d | 1 | 1.15mi |
| 4421 NE 15th Pl Cape Coral, FL | 3.0 | 2.0 | 1240 | $2,000 | $1.61 | 23d | 1 | 1.22mi |
| 2481 Palo Duro Blvd North Fort Myers, FL | 3.0 | 2.0 | 1450 | $4,000 | $2.76 | 16d | 1 | 1.22mi |
| 2481 Palo Duro Blvd North Fort Myers, FL | 3.0 | 2.0 | 1450 | $4,000 | $2.76 | 21d | 1 | 1.22mi |
| 4215 E Gator Cir Cape Coral, FL | 3.0 | 2.0 | 1385 | $1,725 | $1.25 | 3d | 1 | 1.23mi |
| 2300 Valparaiso Blvd North Fort Myers, FL | 2.0 | 2.0 | 1237 | $4,000 | $3.23 | 23d | 1 | 1.27mi |
| 2300 Valparaiso Blvd North Fort Myers, FL | 2.0 | 2.0 | 1237 | $3,000 | $2.43 | 16d | 1 | 1.27mi |
| 4036 Avenue Del Tura North Fort Myers, FL | 2.0 | 2.0 | 1568 | $1,950 | $1.24 | 23d | 1 | 1.29mi |
| 20728 Tisbury Ln North Fort Myers, FL | 3.0 | 2.5 | 2133 | $5,000 | $2.34 | 14d | 1 | 1.32mi |
| 2117 NE 40th St Cape Coral, FL | 3.0 | 3.0 | 1776 | $2,100 | $1.18 | 16d | 1 | 1.43mi |
| 4125 NE 15th Pl Cape Coral, FL | 3.0 | 2.0 | 1556 | $2,000 | $1.29 | 23d | 1 | 1.47mi |
HOA detail
- Monthly dues
- $368 · $4,416/yr
- Likely covers
- poolsecurity
Listing history 11 events
-
2026-04-07status Pending
-
2026-01-19price $199,000
-
2026-01-19price $199,900
-
2025-12-10price $224,900
-
2025-09-22price $229,000
-
2025-04-26$239,000 Active
-
2014-08-27soldstatus $115,000
-
2014-08-26price $129,900 426-char remark
Show marketing remark (426 chars)
BEAUTIFUL UPDATED HOME DESIRABLE GOLF & TENNIS COMMUNITY. OVER 1600 S. FT. WITH AN ADDITIONAL 240 S. FT. AIR CONDITIONED FINISHED LANAI. ISLAND KITCHEN WITH WALK-IN PANTRY AND WALL OVEN. LARGE MASTER SUITE WITH 2 CLOSETS AND DUAL SINKS IN BATH. GREAT CORNER LOT WITH 2 CAR GARAGE. THIS IS A MUST SEE IN A GATED, PET FRIENDLY, VERY ACTIVE 55+ COMMUNITY. CLUBHOUSE, POOL, RESTAURANT, CARDS, DANCES AND INSTANT SOCIAL LIFE.
-
2014-08-26soldstatus $115,000 426-char remark
Show marketing remark (426 chars)
BEAUTIFUL UPDATED HOME DESIRABLE GOLF & TENNIS COMMUNITY. OVER 1600 S. FT. WITH AN ADDITIONAL 240 S. FT. AIR CONDITIONED FINISHED LANAI. ISLAND KITCHEN WITH WALK-IN PANTRY AND WALL OVEN. LARGE MASTER SUITE WITH 2 CLOSETS AND DUAL SINKS IN BATH. GREAT CORNER LOT WITH 2 CAR GARAGE. THIS IS A MUST SEE IN A GATED, PET FRIENDLY, VERY ACTIVE 55+ COMMUNITY. CLUBHOUSE, POOL, RESTAURANT, CARDS, DANCES AND INSTANT SOCIAL LIFE.
-
2014-07-15$115,000 426-char remark
Show marketing remark (426 chars)
BEAUTIFUL UPDATED HOME DESIRABLE GOLF & TENNIS COMMUNITY. OVER 1600 S. FT. WITH AN ADDITIONAL 240 S. FT. AIR CONDITIONED FINISHED LANAI. ISLAND KITCHEN WITH WALK-IN PANTRY AND WALL OVEN. LARGE MASTER SUITE WITH 2 CLOSETS AND DUAL SINKS IN BATH. GREAT CORNER LOT WITH 2 CAR GARAGE. THIS IS A MUST SEE IN A GATED, PET FRIENDLY, VERY ACTIVE 55+ COMMUNITY. CLUBHOUSE, POOL, RESTAURANT, CARDS, DANCES AND INSTANT SOCIAL LIFE.
-
1987-11-01soldstatus $109,400
ⓘ Source: listings_history table (triggers on properties + properties_extension) + one-shot
backfill from property_details.listing_events for pre-trigger history.
Tax reassessment forecast FL · Resets to sale price
- Current annual tax
- $1,120 · $93/mo
- Projected year-2 tax
- $1,652 · $138/mo
- Expected delta
- +$532/yr (+$44/mo · 47.5%)
ⓘ Screening estimate from a state-policy table — verify with the county assessor before closing.
Climate risk First Street
- Flood 1/10 Low FEMA zone X (unshaded) · 0% chance over 30 yrs
- Wildfire 8/10 Severe
- Heat 10/10 Extreme 7 d/yr ≥107°F today · 30 d/yr by 30 yrs out
- Wind 10/10 Extreme 99% chance of damaging wind over 30 yrs
- Air quality 2/10 Low 1 unhealthy d/yr today · 1 by 30 yrs out
Nearby sold comps map
Loading sold comps map…
Walkable amenities ~0.75 mi
Loading nearby amenities…
Taxation est. · year 1
- Rental income
- $26,963
- − Mortgage interest
- −$11,147
- − Property taxes
- −$1,120
- − Insurance
- −$995
- − Repairs & maintenance
- −$2,157
- − Management
- −$2,157
- − HOA
- −$4,416
- − Depreciation
- −$5,789
- Taxable loss
- −$818
- Est. tax savings @ 24.0%
- +$196
- After-tax cash flow
- $2,443/yr
For passive investors: Depreciation is non-cash, so a rental often shows a tax loss while cash-flowing — sheltering income. Rental losses are passive: they offset passive income freely, and up to $25,000/yr can offset ordinary (W-2) income if you actively participate and your MAGI is under $100k (phasing out to $0 by $150k); unused losses carry forward. On sale, claimed depreciation is recaptured at up to 25%, and gains may owe capital-gains tax (a 1031 exchange can defer both). Figures are a year-1 estimate at your 24.0% rate — not tax advice; consult a CPA.
Schools (NCES district)
- District
- Lee
- NCES district ID
- 1201080
- Math proficiency
- 47% ▼ -11.00%
- Reading proficiency
- 50% ▼ -4.00%
- Median HH income
- $49,518
- Composite
- 41.49/100
- National rank
- #3458
- State rank
- #42 of 73 in FL
Livability — North Fort Myers
- Score
- 74/100
- State rank
- #269
- US rank
- #4409
Category grades
Schools grade is shown separately in the Schools card above.
Census & demographics
- Census place
- North Fort Myers, FL
- County
- Lee County · 788,662 people
- City population
- 57,035
- Metro
- Cape Coral-Fort Myers, FL
- Population (ZIP)
- 23,655
- Household income
- $56,993
- Rent vs Own
- Severe rent burden
- 468.0
Population outlook (Lee County) Hauer SSP2
- Today (2025)
- 871,946 people
- By 2030
- 955,468 · +9.6%
- By 2040
- 1,113,587 · +27.7%
- By 2050
- 1,256,891 · +44.1%
- By 2075
- 1,560,270 · +78.9%
- By 2100
- 1,726,848 · +98.0%
Race, ethnicity, and origin ACS 2023
- Neighborhood character
- Predominantly White (81%)
- Race & ethnicity
- White 81% Hispanic / Latino 14% Two or more races 8% Black 2%
- Hispanic origin (detail)
- Mexican 3% Puerto Rican 3% Cuban 3%
- Common ancestry
- Lithuanian 4% Romanian 4% Italian 3%
- Foreign-born
- 11% · Canada
- Languages at home
- 88% English-only · Spanish 9% Other Indo-European 1%
Political lean MEDSL · Lee
- 2024 margin
- Strong R (+28.4) · D 35.5% · R 63.9%
- 2008→2024 swing
- -18.0pp toward R · 2008: -10.4pp · 2024: -28.4pp
- All cycles
- 2024: R+28.4 2020: R+19.2 2016: R+20.4 2012: R+16.6 2008: R+10.4
Not yet ingested
- Civics
- —
Market trends
- HPI YoY
- ▼ -172.26%
- Current HPI
- 256.773
- Rent YoY
- ▼ -1.94%
- Metro
- Cape Coral-Fort Myers, FL
- State GDP YoY
- ▲ 3.28%
- F500 in state
- 36
Industry mix (Fortune 500 HQ in FL)
| Industry | F500 HQs | Revenue |
|---|---|---|
| Industrial Technology | 2 | $29B |
|
||
| Insurance | 2 | $17B |
|
||
| Retail | 1 | $60B |
|
||
| Technology Distribution | 1 | $58B |
|
||
| Homebuilding | 1 | $35B |
|
||
| Technology Manufacturing | 1 | $35B |
|
||
Price history
+81.9% since first listed11 events — show timeline
- 2026-04-07 Pending — FORTMLS
- 2026-01-19 Price Changed $199,000 FORTMLS
- 2026-01-19 Price Changed $199,900 FORTMLS
- 2025-12-10 Price Changed $224,900 FORTMLS
- 2025-09-22 Price Changed $229,000 FORTMLS
- 2025-04-26 Listed $239,000 FORTMLS
- 2014-08-27 Sold (Public Records) $115,000 Public Records
- 2014-08-26 Sold (MLS) $115,000 FORTMLS
- 2014-08-26 Price Changed $129,900 FORTMLS
- 2014-07-15 Listed $115,000 FORTMLS
- 1987-11-01 Sold (Public Records) $109,400 Public Records
Property tax history
+3.6%/yrLatest (2025): $1,120 · +4.2% YoY. Source: county tax records.
Cash-flow waterfall
monthlySold comps — $/sqft
last 12 mo · ≤1 miLoading sold comps…