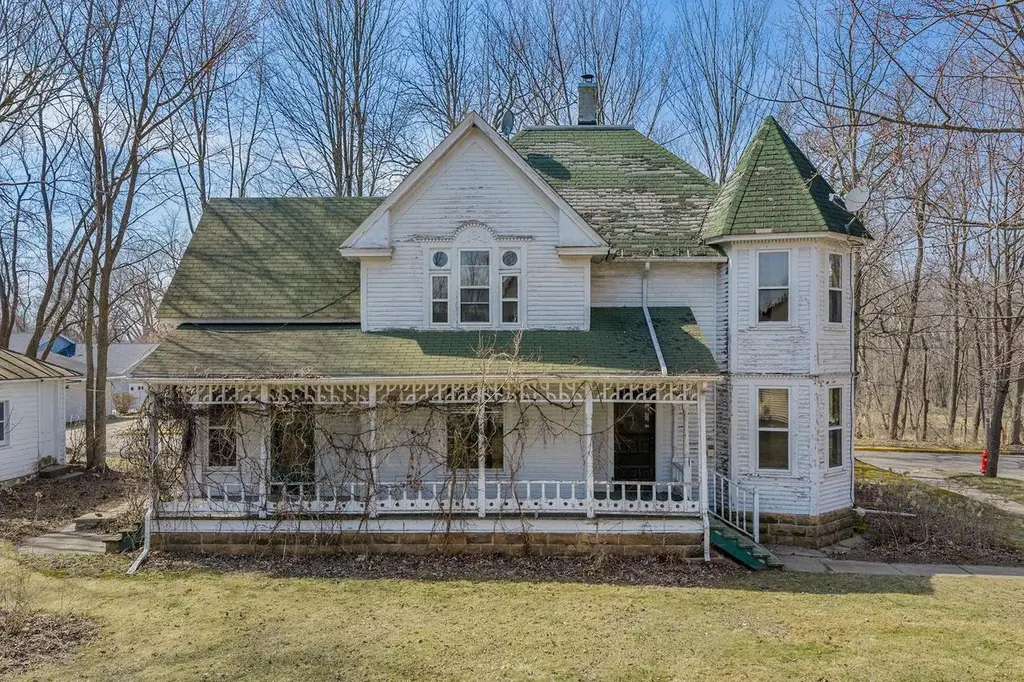
115 Lieder St · North Freedom, WI
Flood risk 1/10 · Minimal
- FEMA flood zone
- X (unshaded)
- Chance of flooding over 30 yrs
- 0.0%
- Est. flood insurance / yr
- $473 – $860
Fire risk 1/10 · Minimal
- Est. fire insurance / yr
- $636 – $1,182
Heat risk 2/10 · Minimal
- Hot days now (above 100°F)
- 7 days/yr
- Hot days in 30 yrs
- 14 days/yr
Wind risk 2/10 · Minimal
- Chance of severe wind over 30 yrs
- —
Air-quality risk 2/10 · Minimal
- Unhealthy air days now
- 0 days/yr
- Unhealthy air days in 30 yrs
- 1 days/yr
Risk factors via First Street. Map © Google.
Why this score? — see what drove the B grade
The composite is a weighted blend of 9 inputs, each scored 0–100. Each bar is that input's sub-score; the figure is the points it added to the 100-point composite (weight × sub-score).
- Cash flow +28.6/30.0
- ARV discount +15.0/15.0
- DSCR +10.0/10.0
- 1% rule +8.3/10.0
- Livability +3.4/5.0
- Schools +3.0/10.0
- Rent growth +2.5/5.0
- Condition / age +2.5/5.0
- Appreciation +0.0/10.0
$110,000
🖨 Deal sheet 📄 Offer letter ✓ Due diligence
Listing remarks
Bring your vision & restore the timeless elegance of this expansive 5-bedroom Victorian gem. Built in 1900, this home is a rare find for preservationists & DIY enthusiasts alike, retaining it's original character that is hard to find today. The interior boasts stunning, unpainted original woodwork & stained glass windows that are a testament to the craftsmanship of a bygone era. With the living room, dining, sitting room & 5 bedrooms, there's ample room for a growing household, home office or creative studio spaces. The exterior features classic architectural lines, a signature turret & both covered front & back porches. Another feature of is the original
Key facts
- 0.27 acre lot
- Garage
- Built 1900
Neighborhood map
What this means for you Summary
Snapshot
- This is a 5-bed/1.0-bath single-family listed at $110k.
Deal economics
- At list price, monthly cash flow is $363 ($4k/yr) — positive.
- The deal already cash-flows at list — no discount required.
- Meets the 1% rule at list price ($1k rent vs $110k).
Location & tenants
- Location reads 67/100 on livability (#419 in WI) — a middle-class / working-renter tenant base. Strengths: cost of living A+, housing A+, employment B+; Watch: health & safety D, amenities F, commute F.
- Baraboo School District (town): math 34% / reading 35% proficiency, ranked #232 of 342 in WI (top 68%) — families likely to look elsewhere, expect single-tenant / working-renter base with shorter leases.
- Zoned schools: North Freedom Elementary (math 34% / reading 44%, grade F, #490 of 1,041 statewide, top 53%, 111 students, 39% FRL); Baraboo High (math 31% / reading 31%, grade F, #204 of 483 statewide, top 43%, 917 students, 42% FRL) — zoned schools at 40% FRL track the district average.
- Market conditions: 20 active listings in the ZIP; 527 units permitted in Sauk County in 2024 (268 in 5+ unit buildings).
Forward outlook
- Local home prices are declining (-3.0%/yr); year-one equity from $761 of loan paydown is wiped out by about $3k of value loss. Plan a longer hold.
- At projected returns (-3.0% appreciation + 3.0% rent growth), your $31k cash investment doubles in ~9 years — after that, you're playing with house money.
Negotiation context
- Only 6 days on market — expect competitive offers; lowballing is unlikely to land.
Risks & watch-outs
- Watch-outs: built in 1900 — expect roof / HVAC / electrical / plumbing capex.
Questions for the listing agent
- Built in 1900 — when were the roof, HVAC, electrical panel, plumbing, and water heater last replaced?
- Is there a deadline driving the sale (1031 exchange, divorce, estate, relocation)? That informs how much negotiation room exists.
- Schools are D-rated, which usually means shorter tenancies and higher turnover. Who's the typical renter profile here, and what's been the actual vacancy rate?
- What's the average days-on-market for RENTAL listings here right now (not sales)? A rising rental-DOM trend means longer vacancies and softer asking-rent achievability than the comps imply.
- What's the recent tenant-quality profile in this submarket — average credit score on applications, eviction rate, late-payment / NSF rate, and stable-employment percentage? A property-management company in the area should have these aggregated.
- How much new for-sale + rental construction is in the pipeline within 1–3 miles? Heavy new supply typically softens prices + rents 12–24 months out; constrained supply supports both.
Investment metrics
- 1% rule
- 1.33% ✓
- Cap rate
- 10.26%
- Cash-on-cash
- 14.16%
- DSCR
- 1.63
- GRM
- 6.3
CMA / ARV
- ARV (on-the-fly)
- $151,140
- Comps found
- 1
Show comp detail 1 sale within ~0.75 mi
| Address | Dist | Beds/Ba | Sqft | Sold | Price | $/sf | Match |
|---|---|---|---|---|---|---|---|
| 115 Lieder St | 0.00mi | 5/1.0 | 2,290 (0%) | 1mo | $150,508 | $66 | 99 |
Match score weights: distance 35% · size 25% · config 20% · recency 20%. Top-matched comps best support the ARV.
Projected returns pro-forma
-3.0% appreciation · 3.0% rent growth · sell at horizon
- IRR
- 4.5%
- Equity multiple
- 1.17×
- Total profit
- $5,365
- Equity at exit
- $16,401
- IRR
- 14.0%
- Equity multiple
- 2.12×
- Total profit
- $34,648
- Equity at exit
- $9,511
Cash invested: $30,800 (down + closing). Projections, not guarantees.
Landlord ↔ Tenant lean methodology
- Overall (STATE)
- 73 Landlord-Friendly
- State Wisconsin
- 73 Landlord-Friendly · R+2
- County
- — inherits STATE
- City
- — inherits STATE
ZIP-level market 53951
- Active inventory
- 20
- Price-to-rent
- 6.3×
Monthly cashflow live
- Estimated rent
- $1,462 medium interval (Pro) →
- Mortgage (P&I)
- −$577
- Tax from tax record
- −$169 /mo · $2,028/yr
- Insurance
- −$46
- HOA
- −$0
- Vacancy / Maint / Mgmt
- −$307
- Net cashflow
- $363
Break-even live
UW: 25.0% down · 7.5% · 30yr · 1.5% tax · 5.0% vac · 8.0% maint · 8.0% mgmt
Financing live
Cash to close
- Down payment
- $27,500
- Closing costs
- $3,300
- Reserves months
- —
- Total cash needed
- —
Loan-product check · same deal, 3 products live
Conventional
25% down · 7.5% · 30yr
- Down + closing
- —
- Monthly P&I
- —
- Monthly cashflow
- —
- DSCR
- —
- Eligible?
- —
Personal DTI + credit; lowest rate.
DSCR
20% down · 8.5% · 30yr
- Down + closing
- —
- Monthly P&I
- —
- Monthly cashflow
- —
- DSCR
- —
- Eligible?
- —
No personal income docs; deal must DSCR.
Hard money
10% down · 12.0% · 12mo
- Down + closing
- —
- Monthly P&I
- —
- Monthly cashflow
- —
- DSCR
- —
- Eligible?
- —
Short-term bridge; refi at stabilization.
Listing history 2 events
-
2026-04-01status Pending
-
2026-03-26$110,000 Active
ⓘ Source: listings_history table (triggers on properties + properties_extension) + one-shot
backfill from property_details.listing_events for pre-trigger history.
Tax reassessment forecast WI · Partial reset (capped growth)
- Current annual tax
- $2,028 · $169/mo
- Projected year-2 tax
- $2,032 · $169/mo
- Expected delta
- +$3/yr ($0/mo · 0.2%)
ⓘ Screening estimate from a state-policy table — verify with the county assessor before closing.
Climate risk First Street
- Flood 1/10 Low FEMA zone X (unshaded) · 0% chance over 30 yrs
- Wildfire 1/10 Low
- Heat 2/10 Low 7 d/yr ≥100°F today · 14 d/yr by 30 yrs out
- Wind 2/10 Low
- Air quality 2/10 Low 0 unhealthy d/yr today · 1 by 30 yrs out
Nearby sold comps map
Loading sold comps map…
Walkable amenities ~0.75 mi
Loading nearby amenities…
Taxation est. · year 1
- Rental income
- $17,547
- − Mortgage interest
- −$6,162
- − Property taxes
- −$2,028
- − Insurance
- −$550
- − Repairs & maintenance
- −$1,404
- − Management
- −$1,404
- − Depreciation
- −$3,200
- Taxable income
- $2,799
- Est. tax owed @ 24.0%
- −$672
- After-tax cash flow
- $3,690/yr
For passive investors: Depreciation is non-cash, so a rental often shows a tax loss while cash-flowing — sheltering income. Rental losses are passive: they offset passive income freely, and up to $25,000/yr can offset ordinary (W-2) income if you actively participate and your MAGI is under $100k (phasing out to $0 by $150k); unused losses carry forward. On sale, claimed depreciation is recaptured at up to 25%, and gains may owe capital-gains tax (a 1031 exchange can defer both). Figures are a year-1 estimate at your 24.0% rate — not tax advice; consult a CPA.
Schools (NCES district)
- District
- Baraboo School District
- NCES district ID
- 5500810
- Math proficiency
- 34% ▼ -8.00%
- Reading proficiency
- 35% ▼ -6.00%
- Median HH income
- $49,101
- Composite
- 29.85/100
- National rank
- #6412
- State rank
- #232 of 342 in WI
Livability — North Freedom
- Score
- 67/100
- State rank
- #419
- US rank
- #10418
Category grades
Schools grade is shown separately in the Schools card above.
Census & demographics
- Census place
- North Freedom, WI
- Population (ZIP)
- 2,571
Population outlook (Sauk County) Hauer SSP2
- Today (2025)
- 66,065 people
- By 2030
- 66,755 · +1.0%
- By 2040
- 66,999 · +1.4%
- By 2050
- 65,499 · -0.9%
- By 2075
- 60,000 · -9.2%
- By 2100
- 51,070 · -22.7%
Race, ethnicity, and origin ACS 2023
- Neighborhood character
- Predominantly White (83%)
- Race & ethnicity
- White 83% Hispanic / Latino 11% Two or more races 4% Black 2%
- Hispanic origin (detail)
- Mexican 7%
- Common ancestry
- Lithuanian 8% Portuguese 6% Romanian 4%
- Foreign-born
- 8% · Canada, Guatemala
- Languages at home
- 91% English-only · Spanish 9% German/W. Germanic 1%
Political lean MEDSL · Sauk
- 2024 margin
- Toss-up / Even · D 48.4% · R 50.0% · Other 1.6%
- 2008→2024 swing
- -23.2pp toward R · 2008: 21.6pp · 2024: -1.7pp
- All cycles
- 2024: R+1.7 2020: D+1.7 2016: R+0.3 2012: D+18.5 2008: D+21.6
Not yet ingested
- Civics
- —
Market trends
- HPI YoY
- ▼ -155.16%
- Current HPI
- 204.3295
- Rent YoY
- —
- Metro
- —
- State GDP YoY
- ▲ 2.10%
- F500 in state
- 20
Industry mix (Fortune 500 HQ in WI)
| Industry | F500 HQs | Revenue |
|---|---|---|
| Industrial Machinery | 4 | $23B |
|
||
| Industrial Technology | 2 | $36B |
|
||
| Insurance | 1 | $36B |
|
||
| Professional Services | 1 | $19B |
|
||
| Utilities | 1 | $9B |
|
||
| Consumer Goods | 1 | $3B |
|
||
Price history
2 events — show timeline
- 2026-04-01 Pending — SCWMLS
- 2026-03-26 Listed $110,000 SCWMLS
Property tax history
+1.7%/yrLatest (2025): $2,028 · -1.6% YoY. Source: county tax records.
Cash-flow waterfall
monthlySold comps — $/sqft
last 12 mo · ≤1 miLoading sold comps…